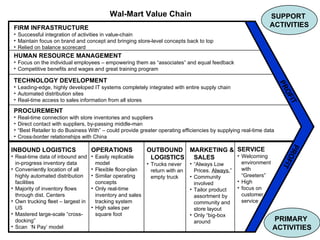
Wal-Mart Value Chain FIRM INFRASTRUCTURE Successful integration of activities in value-chain Maintain focus on brand and concept and bringing store-level concepts back to top Relied on balance scorecard PRIMARY  ACTIVITIES SU P PORT   ACTIVITIES SERVICE Welcoming environment with  “ Greeters” High  focus on customer service MARKETING & SALES “ Always Low Prices.  Always. ”  Community involved Tailor product assortment by community and store layout Only “big-box around OUTBOUND LOGISTICS Trucks never return with an empty truck PROCUREMENT Real-time connection with store inventories and suppliers Direct contact with suppliers, by-passing middle-man “ Best Retailer to do Business With” – could provide greater operating efficiencies by supplying real-time data Cross-border relationships with China TECHNOLOGY DEVELOPMENT Leading-edge, highly developed IT systems completely integrated with entire supply chain Automated distribution sites Real-time access to sales information from all stores HUMAN RESOURCE MANAGEMENT Focus on the individual employees – empowering them as “associates” and equal feedback Competitive benefits and wages and great training program INBOUND LOGISTICS Real-time data of inbound and in-progress inventory data Conveniently location of all highly automated distribution facilities Majority of inventory flows through dist. Centers Own trucking fleet – largest in US Mastered large-scale “cross-docking” Scan  ‘N Pay’ model OPERATIONS Easily replicable model Flexible floor-plan Similar operating concepts Only real-time inventory and sales tracking system High sales per square foot PROFIT PROFIT
The Porter Value Chain FIRM INFRASTRUCTURE SERVICE MARKETING & SALES Can’t compete with low prices Target – larger private label presence Higher advertising-to-sales ratio OUTBOUND LOGISTICS TECHNOLOGY DEVELOPMENT No store-level real-time access HUMAN RESOURCE MANAGEMENT PROCUREMENT Can’t compete in terms of scale Behind IT curve in determining demand INBOUND LOGISTICS Higher % of DSD High portion of operating expenses OPERATIONS Lower sales per square foot Lower sales growth

The Porter Value Chain

  • 1.
    Wal-Mart Value ChainFIRM INFRASTRUCTURE Successful integration of activities in value-chain Maintain focus on brand and concept and bringing store-level concepts back to top Relied on balance scorecard PRIMARY ACTIVITIES SU P PORT ACTIVITIES SERVICE Welcoming environment with “ Greeters” High focus on customer service MARKETING & SALES “ Always Low Prices. Always. ” Community involved Tailor product assortment by community and store layout Only “big-box around OUTBOUND LOGISTICS Trucks never return with an empty truck PROCUREMENT Real-time connection with store inventories and suppliers Direct contact with suppliers, by-passing middle-man “ Best Retailer to do Business With” – could provide greater operating efficiencies by supplying real-time data Cross-border relationships with China TECHNOLOGY DEVELOPMENT Leading-edge, highly developed IT systems completely integrated with entire supply chain Automated distribution sites Real-time access to sales information from all stores HUMAN RESOURCE MANAGEMENT Focus on the individual employees – empowering them as “associates” and equal feedback Competitive benefits and wages and great training program INBOUND LOGISTICS Real-time data of inbound and in-progress inventory data Conveniently location of all highly automated distribution facilities Majority of inventory flows through dist. Centers Own trucking fleet – largest in US Mastered large-scale “cross-docking” Scan ‘N Pay’ model OPERATIONS Easily replicable model Flexible floor-plan Similar operating concepts Only real-time inventory and sales tracking system High sales per square foot PROFIT PROFIT
  • 2.
    The Porter ValueChain FIRM INFRASTRUCTURE SERVICE MARKETING & SALES Can’t compete with low prices Target – larger private label presence Higher advertising-to-sales ratio OUTBOUND LOGISTICS TECHNOLOGY DEVELOPMENT No store-level real-time access HUMAN RESOURCE MANAGEMENT PROCUREMENT Can’t compete in terms of scale Behind IT curve in determining demand INBOUND LOGISTICS Higher % of DSD High portion of operating expenses OPERATIONS Lower sales per square foot Lower sales growth

Editor's Notes