SlideShare a Scribd company logo
1 of 8
Download to read offline
INSTRUCTIONAL DESIGN AND ASSESSMENT
A Standardized Rubric to Evaluate Student Presentations
Michael J. Peeters, PharmD, MEd,a
Eric G. Sahloff, PharmD,a
and Gregory E. Stone, PhDb
a
University of Toledo College of Pharmacy
b
University of Toledo College of Education
Submitted April 18, 2010; accepted August 2, 2010; published November 10, 2010.
Objective. To design, implement, and assess a rubric to evaluate student presentations in a capstone
doctor of pharmacy (PharmD) course.
Design. A 20-item rubric was designed and used to evaluate student presentations in a capstone fourth-
year course in 2007-2008, and then revised and expanded to 25 items and used to evaluate student
presentations for the same course in 2008-2009. Two faculty members evaluated each presentation.
Assessment. The Many-Facets Rasch Model (MFRM) was used to determine the rubric’s reliability,
quantify the contribution of evaluator harshness/leniency in scoring, and assess grading validity by
comparing the current grading method with a criterion-referenced grading scheme. In 2007-2008,
rubric reliability was 0.98, with a separation of 7.1 and 4 rating scale categories. In 2008-2009, MFRM
analysis suggested 2 of 98 grades be adjusted to eliminate evaluator leniency, while a further criterion-
referenced MFRM analysis suggested 10 of 98 grades should be adjusted.
Conclusion. The evaluation rubric was reliable and evaluator leniency appeared minimal. However, a
criterion-referenced re-analysis suggested a need for further revisions to the rubric and evaluation process.
Keywords: assessment, evaluation, reliability, rating scale, criterion-referenced grading, rubric
INTRODUCTION
Evaluations are important in the process of teaching
andlearning.Inhealthprofessionseducation,performance-
based evaluations are identified as having ‘‘an emphasis
on testing complex, ‘higher-order’ knowledge and skills in
the real-world context in which they are actually used.’’1
Objective structured clinical examinations (OSCEs) are a
common, notable example.2
On Miller’s pyramid, a frame-
work used in medical education for measuring learner out-
comes, ‘‘knows’’ is placed at the base of the pyramid,
followed by ‘‘knows how,’’ then ‘‘shows how,’’ and fi-
nally, ‘‘does’’ is placed at the top.3
Based on Miller’s
pyramid, evaluation formats that use multiple-choice test-
ing focus on ‘‘knows’’ while an OSCE focuses on ‘‘shows
how.’’ Just as performance evaluations remain highly val-
ued in medical education,4
authentic task evaluations in
pharmacy education may be better indicators of future
pharmacist performance.5
Much attention in medical ed-
ucation has been focused on reducing the unreliability of
high-stakes evaluations.6
Regardless of educational disci-
pline, high-stakes performance-based evaluations should
meet educational standards for reliability and validity.7
PharmD students at University of Toledo College of
Pharmacy (UTCP) were required to complete a course on
presentations during their final year of pharmacy school
and then give a presentation that served as both a capstone
experience and a performance-based evaluation for the
course. Pharmacists attending the presentations were
given Accreditation Council for Pharmacy Education
(ACPE)-approved continuing education credits. An eval-
uation rubric for grading the presentations was designed
to allow multiple faculty evaluators to objectively score
student performances in the domains of presentation de-
livery and content. Given the pass/fail grading procedure
used in advanced pharmacy practice experiences, passing
this presentation-based course and subsequently graduat-
ing from pharmacy school were contingent upon this
high-stakes evaluation. As a result, the reliability and
validity of the rubric used and the evaluation process
needed to be closely scrutinized.
Each year, about 100 students completed presentations
and at least 40 faculty members served as evaluators. With
the use of multiple evaluators, a question of evaluator le-
niency often arose (ie, whether evaluators used the same
criteria for evaluating performances or whether some eval-
uators graded easier or more harshly than others). At UTCP,
opinions among some faculty evaluators and many PharmD
students implied that evaluator leniency in judging the stu-
dents’ presentations significantly affected specific students’
Corresponding Author: Michael J. Peeters, PharmD, MEd,
University of Toledo College of Pharmacy, 3000 Arlington
Ave, MS 1013, Toledo, OH 43614, Phone: 419-383-1946,
E-mail: michael.peeters@utoledo.edu
American Journal of Pharmaceutical Education 2010; 74 (9) Article 171.
1
grades and ultimately their graduation from pharmacy
school.Whileitwasplausiblethatevaluatorleniencywasoc-
curring, the magnitude of the effect was unknown. Thus, this
study was initiated partly to address this concern over grad-
ing consistency and scoring variability among evaluators.
Because both students’ presentation style and content
were deemed important, each item of the rubric was
weighted the same across delivery and content. However,
because there were more categories related to delivery
than content, an additional faculty concern was that stu-
dents feasibly could present poor content but have an
effective presentation delivery and pass the course.
The objectives for this investigation were: (1) to de-
scribe and optimize the reliability of the evaluation rubric
used in this high-stakes evaluation; (2) to identify the con-
tribution and significance of evaluator leniency to evalua-
tion reliability; and (3) to assess the validity of this
evaluation rubricwithinacriterion-referencedgradingpar-
adigm focused on both presentation delivery and content.
DESIGN
The University of Toledo’s Institutional Review Board
approved this investigation. This study investigated perfor-
mance evaluation data for an oral presentation course for
final-year PharmD students from 2 consecutive academic
years (2007-2008 and 2008-2009). The course was taken
during the fourth year (P4) of the PharmD program and was
a high-stakes, performance-based evaluation. The goal of
the course was to serve as a capstone experience, enabling
studentstodemonstrateadvanceddrugliteratureevaluation
and verbal presentations skills through the development
and delivery of a 1-hour presentation. These presentations
were to be on a current pharmacy practice topic and of
sufficient quality for ACPE-approved continuing educa-
tion. This experience allowed students to demonstrate their
competencies in literature searching, literature evaluation,
andapplicationofevidence-basedmedicine,aswellastheir
oral presentation skills. Students worked closely with a
faculty advisor to develop their presentation. Each class
(2007-2008 and 2008-2009) was randomly divided, with
half of the students taking the course and completing their
presentation and evaluation in the fall semester and the
other half in the spring semester. To accommodate such a
large number of students presenting for 1 hour each, it was
necessary to use multiple rooms with presentations taking
place concurrently over 2.5 days for both the fall and spring
sessions of the course. Two faculty members indepen-
dently evaluated each student presentation using the pro-
vided evaluation rubric. The 2007-2008 presentations
involved 104 PharmD students and 40 faculty evaluators,
while the 2008-2009 presentations involved 98 students
and 46 faculty evaluators.
After vetting through the pharmacy practice faculty,
the initial rubric used in 2007-2008 focused on describing
explicit, specific evaluation criteria such as amounts of eye
contact, voice pitch/volume, and descriptions of study
methods. The evaluation rubric used in 2008-2009 was
similar to the initial rubric, but with 5 items added (Figure
1). The evaluators rated each item (eg, eye contact) based
on their perception of the student’s performance. The 25
rubric items had equal weight (ie, 4 points each), but each
item received a rating from the evaluator of 1 to 4 points.
Thus, only 4 rating categories were included as has been
recommended in the literature.8
However, some evaluators
created an additional 3 rating categories by marking lines
in between the 4 ratings to signify half points ie, 1.5, 2.5,
and 3.5. For example, for the ‘‘notecards/notes’’ item in
Figure 1, a student looked at her notes sporadically during
herpresentation,butnotdistractinglynorenoughtowarrant
a score of 3 in the faculty evaluator’s opinion, so a 3.5 was
given. Thus, a 7-category rating scale (1, 1.5, 2, 2.5. 3, 3.5,
and 4) was analyzed. Each independent evaluator’s ratings
for the 25 items were summed to form a score (0-100%).
The 2 evaluators’ scores then were averaged and a letter
grade was assigned based on the following scale: .90% 5
A, 80%-89% 5 B, 70%-79% 5 C, ,70% 5 F.
EVALUATION AND ASSESSMENT
Rubric Reliability
To measure rubric reliability, iterative analyses were
performed on the evaluations using the Many-Facets Rasch
Model (MFRM) following the 2007-2008 data collection
period. While Cronbach’s alpha is the most commonly
reported coefficient of reliability, its single number report-
ing without supplementary information can provide incom-
plete information about reliability.9-11
Due to its formula,
Cronbach’s alpha can be increased by simply adding more
repetitive rubric items or having more rating scale cate-
gories, even when no further useful information has been
added. The MFRM reports separation, which is calculated
differently than Cronbach’s alpha, is another source of re-
liability information. Unlike Cronbach’s alpha, separation
does not appear enhanced by adding further redundant
items. From a measurement perspective, a higher separa-
tion value is better than a lower one because students are
being divided into meaningful groups after measurement
error has been accounted for. Separation can be thought of
as the number of units on a ruler where the more units the
ruler has, the larger the range of performance levels that can
be measured among students. For example, a separation of
4.0 suggests 4 graduations such that a grade of A is dis-
tinctly different from a grade of B, which in turn is different
from a grade of C or of F. In measuring performances,
a separation of 9.0 is better than 5.5, just as a separation
American Journal of Pharmaceutical Education 2010; 74 (9) Article 171.
2
American Journal of Pharmaceutical Education 2010; 74 (9) Article 171.
3
Figure 1. Rubric used to evaluate student presentations given in a 2008-2009 capstone PharmD course.
American
Journal
of
Pharmaceutical
Education
2010;
74
(9)
Article
171.
4
of 7.0 is better than a 6.5; a higher separation coefficient
suggests that student performance potentially could be di-
videdintoalargernumberofmeaningfullyseparategroups.
The rating scale can have substantial effects on re-
liability,8
while description of how a rating scale func-
tions is a unique aspect of the MFRM. With analysis
iterations of the 2007-2008 data, the number of rating
scale categories were collapsed consecutively until im-
provements in reliability and/or separation were no longer
found. The last positive iteration that led to positive im-
provements in reliability or separation was deemed an
optimal rating scale for this evaluation rubric.
In the 2007-2008 analysis, iterations of the data where
runthroughtheMFRM.Whileonly4ratingscalecategories
hadbeenincludedontherubric,becausesomefacultymem-
bers inserted 3 in-between categories, 7 categories had to be
included in the analysis. This initial analysis based on a 7-
category rubric provided a reliability coefficient (similar to
Cronbach’s alpha) of 0.98, while the separation coefficient
was 6.31. The separation coefficient denoted 6 distinctly
separate groups of students based on the items. Rating scale
categories were collapsed, with ‘‘in-between’’ categories
included in adjacent full-point categories. Table 1 shows
the reliability and separation for the iterations as the rating
scalewascollapsed.Asshown,theoptimalevaluationrubric
maintained a reliability of 0.98, but separation improved the
reliability to 7.10 or 7 distinctly separate groups of students
based on the items. Another distinctly separate group was
added through a reduction in the rating scale while no
change was seen to Cronbach’salpha, even though thenum-
ber of rating scale categories was reduced. Table 1 describes
thestepwise,sequentialpatternacrossthefinal4ratingscale
categories analyzed. Informed by the 2007-2008 results, the
2008-2009 evaluation rubric (Figure 1) used 4 rating scale
categories and reliability remained high.
Evaluator Leniency
Described by Fleming and colleagues over half a cen-
tury ago,6
harsh raters (ie, hawks) or lenient raters (ie,
doves) have also been demonstrated in more recent studies
as an issue as well.12-14
Shortly after 2008-2009 data were
collected, those evaluations by multiple faculty evaluators
were collated and analyzed in the MFRM to identify pos-
sible inconsistent scoring. While traditional interrater re-
liability does not deal with this issue, the MFRM had been
usedpreviouslytoillustrateevaluatorleniencyonlicensing
examinations formedical students and medical residents in
the United Kingdom.13
Thus, accounting for evaluator le-
niency may prove important to grading consistency (and
reliability) in a course using multiple evaluators. Along
with identifying evaluator leniency, the MFRM also cor-
rected for this variability. For comparison, course grades
were calculated by summing the evaluators’ actual ratings
(as discussed in the Design section) and compared with the
MFRM-adjusted grades to quantify the degree of evaluator
leniency occurring in this evaluation.
Measurescreated fromthedata analysis in theMFRM
were converted to percentages using a common linear
test-equating procedure involving the mean and standard
deviation of the dataset.15
To these percentages, student
letter grades were assigned using the same traditional
method used in 2007-2008 (ie, 90% 5 A, 80% - 89% 5
B, 70% - 79% 5 C, ,70% 5 F). Letter grades calculated
using the revised rubric and the MFRM then were com-
pared to letter grades calculated using the previous rubric
and course grading method.
In the analysis of the 2008-2009 data, the interrater
reliability for the letter grades when comparing the 2 in-
dependent faculty evaluations for each presentation was
0.98 by Cohen’s kappa. However, using the 3-facet
MRFM revealed significant variation in grading. The in-
teraction of evaluator leniency on student ability and item
difficulty was significant, with a chi-square of p , 0.01.
As well, the MFRM showed a reliability of 0.77, with
a separation of 1.85 (ie, almost 2 groups of evaluators).
The MFRM student ability measures were scaled to letter
gradesandcomparedwithcourselettergrades.Asaresult,
2 B’s became A’s and so evaluator leniency accounted for
a 2% change in letter grades (ie, 2 of 98 grades).
Validity and Grading
Explicit criterion-referenced standards for grading are
recommended for higher evaluation validity.3,16-18
The
course coordinator completed 3 additional evaluations of
a hypothetical student presentation rating the minimal cri-
teria expected to describe each of an A, B, or C letter
grade performance. These evaluations were placed with
the other196evaluations(2evaluators 3 98students)from
Table 1. Evaluation Rubric Reliability and Separation with
Iterations While Collapsing Rating Scale Categories.
Number of
Rating Scale
Categories
for Each Item
Rubric
Reliabilitya
Rubric
Separationb
Standard
Error of
Measurement
7 0.98 6.31 0.20
6 0.98 6.43 0.15
5 0.98 6.78 0.14
4c
0.98 7.10 0.12
3 0.97 6.85 0.17
a
Reliability coefficient of variance in rater response that is repro-
ducible (ie, Cronbach’s alpha).
b
Separation is a coefficient of item standard deviation divided by
average measurement error and is an additional reliability coefficient.
c
Optimal number of rating scale categories based on the highest
reliability (0.98) and separation (7.1) values.
American Journal of Pharmaceutical Education 2010; 74 (9) Article 171.
5
2008-2009 into the MFRM, with the resulting analysis re-
port giving specific cutoff percentage scores for each letter
grade. Unlike the traditional scoring method of assigning
all items an equal weight, the MFRM ordered evaluation
items from those more difficult for students (given more
weight) to those less difficult for students (given less
weight). These criterion-referenced letter grades were
compared with the grades generated using the traditional
grading process.
When the MFRM data were rerun with the criterion-
referencedevaluationsaddedintothedataset,a10%change
was seen with letter grades (ie, 10 of 98 grades). When the
10 letter grades were lowered, 1 was below a C, the mini-
mum standard, and suggested a failing performance. Qual-
itative feedback from faculty evaluators agreed with this
suggested criterion-referenced performance failure.
Measurement Model
Within modern test theory, the Rasch Measurement
Model maps examinee ability with evaluation item diffi-
culty. Items are not arbitrarily given the same value (ie, 1
point) but vary based on how difficult or easy the items
were for examinees. The Rasch measurement model has
been used frequently in educational research,19
by numer-
ous high-stakes testing professional bodies such as the
National Board of Medical Examiners,20
and also by var-
ious state-level departments of education for standardized
secondary education examinations.21
The Rasch mea-
surement model itself has rigorous construct validity
and reliability.22
A 3-facet MFRM model allows an eval-
uator variable to be added to the student ability and item
difficulty variables that are routine in other Rasch mea-
surement analyses. Just as multiple regression accounts
for additional variables in analysis compared to a simple
bivariate regression, the MFRM is a multiple variable
variant of the Rasch measurement model and was ap-
plied in this study using the Facets software (Linacre,
Chicago, IL). The MFRM is ideal for performance-based
evaluations with the addition of independent evaluator/
judges.8,23
From both yearly cohorts in this investigation,
evaluation rubric data were collated and placed into the
MFRM for separate though subsequent analyses. Within
the MFRM output report, a chi-square for a difference in
evaluator leniency was reported with an alpha of 0.05.
DISCUSSION
The presentation rubric was reliable. Results from the
2007-2008 analysis illustrated that the number of rating
scale categories impacted the reliability of this rubric and
that use of only 4 rating scale categories appeared best for
measurement. While a 10-point Likert-like scale may com-
monly be used in patient care settings, such as in quantify-
ing pain, most people cannot process more then 7 points
or categories reliably.24
Presumably, when more than 7 cat-
egories are used, the categories beyond 7 either are not used
or are collapsed by respondents into fewer than 7 categories.
Five-point scales commonly are encountered, but use of an
odd number of categories can be problematic to interpreta-
tion and is not recommended.25
Responses using the middle
category could denote a true perceived average or neutral
response or responder indecisiveness or even confusion
over the question. Therefore, removing the middle category
appears advantageous and is supported by our results.
With 2008-2009 data, the MFRM identified evaluator
leniency with some evaluators grading more harshly while
others were lenient. Evaluator leniency was indeed found
in the dataset but only a couple of changes were suggested
based on the MFRM-corrected evaluator leniency and did
not appear to play a substantial role in the evaluation of this
course at this time.
Performance evaluation instruments are either holistic
oranalyticrubrics.26
The evaluationinstrument used inthis
investigation exemplified an analytic rubric, which elicits
specific observations and often demonstrates high reli-
ability. However, Norman and colleagues point out a
conundrum where drastically increasing the number of
evaluation rubric items (creating something similar to a
checklist) could augment a reliability coefficient though
it appears to dissociate from that evaluation rubric’s
validity.27
Validity may be more than the sum of behav-
iors on evaluation rubric items.28
Having numerous,
highly specific evaluation items appears to undermine
the rubric’s function. With this investigation’s evalua-
tion rubric and its numerous items for both presentation
style and presentation content, equal numeric weighting
of items can in fact allow student presentations to re-
ceive a passing score while falling short of the course
objectives, as was shown in the present investigation. As
opposed to analytic rubrics, holistic rubrics often dem-
onstrate lower yet acceptable reliability, while offering
a higher degree of explicit connection to course objec-
tives. A summative, holistic evaluation of presentations
may improve validity by allowing expert evaluators to
provide their ‘‘gut feeling’’ as experts on whether a per-
formance is ‘‘outstanding,’’ ‘‘sufficient,’’ ‘‘borderline,’’
or ‘‘subpar’’ for dimensions of presentation delivery and
content. A holistic rubric that integrates with criteria of
the analytic rubric (Figure 1) for evaluators to reflect on
but maintains a summary, overall evaluation for each
dimension (delivery/content) of the performance, may
allow for benefits of each type of rubric to be used ad-
vantageously. This finding has been demonstrated with
OSCEs in medical education where checklists for com-
pleted items (ie, yes/no) at an OSCE station have been
American Journal of Pharmaceutical Education 2010; 74 (9) Article 171.
6
successfully replaced with a few reliable global impres-
sion rating scales.29-31
Alternatively,and becausethe MFRMmodel was used
in the current study, an items-weighting approach could be
used with the analytic rubric. That is, item weighting
based on the difficulty of each rubric item could suggest
how many points should be given for that rubric items,
eg, some items would be worth 0.25 points, while others
would be worth 0.5 points or 1 point (Table 2). As could
be expected, the more complex the rubric scoring be-
comes, the less feasible the rubric is to use. This was the
mainreason whythisrevision approachwasnot chosenby
the course coordinator following this study. As well, it
doesnot address theconundrumthat the performance may
be more than the summation of behavior items in the
Figure 1 rubric. This current study cannot suggest which
approach would be better as each would have its merits
and pitfalls.
Regardless of which approach is used, alignment of
the evaluation rubric with the course objectives is imper-
ative. Objectivity has been described as a general striving
for value-free measurement (ie, free of the evaluator’s
interests, opinions, preferences, sentiments).27
This is
a laudable goal pursued through educational research.
Strategies to reduce measurement error, termed objectifi-
cation, may not necessarily lead to increased objectiv-
ity.27
The current investigation suggested that a rubric
could become too explicit if all the possible areas of an
oral presentation that could be assessed (ie, objectifica-
tion) were included. This appeared to dilute the effect of
important items and lose validity. A holistic rubric that is
more straightforward and easier to score quickly may be
less likely to lose validity (ie, ‘‘lose the forest for the
trees’’), though operationalizing a revised rubric would
need to be investigated further. Similarly, weighting
items in an analytic rubric based on their importance
and difficulty for students may alleviate this issue; how-
ever, adding up individual items might prove arduous.
While the rubric in Figure 1, which has evolved over
the years, is the subject of ongoing revisions, it appears
a reliable rubric on which to build.
The major limitation of this study involves the obser-
vationalmethod thatwas employed.Although the2 cohorts
were from a single institution, investigators did use a com-
pletely separate class of PharmD students to verify initial
instrument revisions. Optimizing the rubric’s rating scale
involved collapsing data from misuse of a 4-category
rating scale (expanded by evaluators to 7 categories) by
a few of the evaluators into 4 independent categories
without middle ratings. As a result of the study findings,
no actual grading adjustments were made for students in
the 2008-2009 presentation course; however, adjustment
using the MFRM have been suggested by Roberts and
colleagues.13
Since 2008-2009, the course coordinator
has made further small revisions to the rubric based on
feedback from evaluators, but these have not yet been re-
analyzed with the MFRM.
SUMMARY
The evaluation rubric used in this study for student
performance evaluations showed high reliability and the
data analysis agreed with using 4 rating scale categories
to optimize the rubric’s reliability. While lenient and harsh
faculty evaluators were found, variability in evaluator scor-
ing affected grading in this course only minimally. Aside
from reliability, issues of validity were raised using crite-
rion-referenced grading. Future revisions to this evaluation
rubric should reflect these criterion-referenced concerns.
The rubric analyzed herein appears a suitable starting point
for reliable evaluation of PharmD oral presentations,
Table 2. Rubric Item Weightings Suggested in the 2008-2009
Data Many-Facet Rasch Measurement Analysis
Item Categories Rubric Item Weighting (Points)
Delivery- Nonverbal skills
Eye contact 0.5
Notes 0.5
Facial Expressions 1
Composure 1
Gestures 0.5
Posture 0.5
Delivery- Verbal Skills
Enthusiasm 1
Articulation 1
Rate of speech 0.25
Volume of speech 0.25
Delivery- Visual Aids
Slide effectiveness 1
Slide spelling 0.5
Handout effectiveness 1
Handout spelling 0.5
References 0.5
Content/organization
Objectives 1
Relevance 1
Balanced representation 1
Literature selection 1
Methodology/statistics 1
Critique 1
Transitions 1
Organization 1
Application 1
Questions 1
Total 20
American Journal of Pharmaceutical Education 2010; 74 (9) Article 171.
7
though it has limitations that could be addressed with
further attention and revisions.
ACKNOWLEDGEMENT
Author contributions— MJP and EGS conceptualized
the study, while MJP and GES designed it. MJP, EGS, and
GES gave educational content foci for the rubric. As the
study statistician, MJP analyzed and interpreted the study
data. MJP reviewed the literature and drafted a manuscript.
EGS and GES critically reviewed this manuscript and ap-
proved the final version for submission. MJP accepts over-
all responsibility for the accuracy of the data, its analysis,
and this report.
REFERENCES
1. Swanson DB, Norman GR, Linn RL. Performance-based
assessment: lessons from the health professions. Educ Res.
1995;24(5):5-11.
2. Harden RM, Stevenson M, Downie WW, Wilson GM. Assessment
of clinical competence using objective structured examination. BMJ.
1975;1(5955):447-451.
3. Miller GE. The assessment of clinical skills/competence/
performance. Acad Med. 1990;65(9):S63-S67.
4. Howley LD. Performance assessment in medical education: where
we’ve been and where we’re going. Eval Health Prof.
2004;27(3):285-303.
5. Romanelli F. Pharmacist licensure: time to step it up? Am J Pharm
Educ. 2010;74(5):Article 91.
6. Fleming PR, Manderson WG, Matthews MB, Sanderson PH,
Stokes JF. Evolution of an examination: M.R.C.P. (U.K.). BMJ.
1974;2(5910):99-107.
7. American Educational Research Association, American
Psychological Association, and National Council on Measurement in
Education. Standards for educational and psychological testing.
Washington DC: American Psychological Association, 1999.
8. Stone MH. Substantive scale construction. J Appl Meas.
2003;4(3):282-297.
9. Lunz ME, Schumacker RE. Scoring and analysis of performance
examinations: a comparison of methods and
interpretations. J Outcome Meas. 1997;1(3):219-238.
10. Cortina JM. What is coefficient alpha? An examination of theory
and applications. J Appl Psychol. 1993;78(1):98-104.
11. Streiner DL. Starting at the beginning: an introduction to
coefficient alpha and internal consistency. J Pers Assess.
2003;80(1):99-103.
12. Iramaneerat C, Yudkowsky R. Rate errors in a clinical skills
assessment of medical students. Eval Health Prof. 2007;30(3):
266-283.
13. McManus IC, Thompson M, Mollon J. Assessment of examiner
leniency and stringency (‘hawk-dove effect’) in the MRCP(UK)
clinical examination (PACES) using multi-facet Rasch
modelling. BMC Med Educ. 2006;6:Article 42.
14. Roberts C, Rothnie I, Zoanetti N, Crossley J. Should candidate
scores be adjusted for interviewer stringency or leniency in the
multiple mini-interview? Med Educ. 2010;44:690-698.
15. Kolen MJ, Brennan RL. Test Equating. New York NY: Springer-
Verlag, 2004.
16. Zlatic TD. Using assessment to structure learning: putting it all
together. In: Re-visioning Professional Education: An Orientation to
Teaching. Kansas City, MO: American College of Clinical
Pharmacy, 2005:81-105.
17. Norcini J. Approaches to standard-setting for performance-
based examinations. In: Harden RM, Hart IR, Mulholland H, eds.
Approaches to the Assessment of Clinical Competence Part 1.
Dundee, Scotland: Centre for Medical Education, 1992: 32-37.
18. Stone GE. Objective standard setting (or truth in
advertising). J Appl Meas. 2001;2(2):187-201.
19. Chang C, Reeve B. Item response theory and its applications to
patient-reported outcome measures. Eval Health Prof. 2005;28:
264-282.
20. Downing S. Item-response theory: applications of modern test
theory in medical education. Med Educ. 2003;37:739-745.
21. Boone W. Explaining Rasch measurement in different
ways. Rasch Measurement Transactions. 2009;23:1198.
22. Smith EV Jr. Evidence for the reliability of measures and validity
of measure interpretation: a Rasch measurement perspective. J Appl
Meas. 2001;2(3):281-311.
23. Linacre JM. Many-Facet Rasch Measurement. Chicago, IL:
MESA Press; 1994.
24. Miller GA. The magical number seven, plus or minus two: some
limits on our capacity for processing information. Psychol Rev.
1956;63(2):81-97.
25. Weems GH, Onwuegbuzie AJ. The impact of midpoint responses
and reverse coding on survey data. Measure Eval Couns Develop.
2001;34(3):166-176.
26. Johnson RL, Penny JA, Gordon B. Assessing Performance:
Designing, Scoring, and Validating Performance Tasks. New York,
NY: The Guilford Press; 2009.
27. Norman GR, Van der Vleuten CPM, De Graaff E. Pitfalls in the
pursuit of objectivity: issues of validity, efficiency and
acceptability. Med Educ. 1991;25:119-126.
28. Streiner DL, Norman GR. Health Measurement Scales: A
Practical Guide to Their Development and Use. 4th
ed. New York
NY: Oxford University Press; 2008.
29. Regehr G, MacRae H, Reznick RK, Szalay D. Comparing the
psychometric properties of checklists and global rating scales for
assessing performance on an OSCE-format examination. Acad Med.
1998;73(9):993-997.
30. Hodges B, Regehr G, McNaughton N, Tiberius R, Hanson M.
OSCE checklists do not capture increasing levels of expertise. Acad
Med. 1999;74(10):1129-1134.
31. Hodges B, McIlroy JH. Analytic global OSCE ratings are
sensitive to levels of training. Med Educ. 2003;37(11):1012-1016.
American Journal of Pharmaceutical Education 2010; 74 (9) Article 171.
8

More Related Content

Similar to A Standardized Rubric To Evaluate Student Presentations

LESSON 6 JBF 361.pptx
LESSON 6 JBF 361.pptxLESSON 6 JBF 361.pptx
LESSON 6 JBF 361.pptxAdnanIssah
 
Evaluation and measurement nursing education
Evaluation and measurement nursing educationEvaluation and measurement nursing education
Evaluation and measurement nursing educationparvathysree
 
Osce objective-structured-clinical-examination-revised-gupta-dewan-singh
Osce objective-structured-clinical-examination-revised-gupta-dewan-singhOsce objective-structured-clinical-examination-revised-gupta-dewan-singh
Osce objective-structured-clinical-examination-revised-gupta-dewan-singhPROIDDBahiana
 
Assessment Methods In Medical Education
Assessment Methods In Medical EducationAssessment Methods In Medical Education
Assessment Methods In Medical EducationNathan Mathis
 
Assessmentof Nursing Students’ Attitude toward Learning Communication Skills ...
Assessmentof Nursing Students’ Attitude toward Learning Communication Skills ...Assessmentof Nursing Students’ Attitude toward Learning Communication Skills ...
Assessmentof Nursing Students’ Attitude toward Learning Communication Skills ...iosrjce
 
Evaluation of the facilitating skills of clinical instructors in the supervis...
Evaluation of the facilitating skills of clinical instructors in the supervis...Evaluation of the facilitating skills of clinical instructors in the supervis...
Evaluation of the facilitating skills of clinical instructors in the supervis...pharmaindexing
 
Assessing Oral Presentation Performance
Assessing Oral Presentation PerformanceAssessing Oral Presentation Performance
Assessing Oral Presentation PerformanceSheila Sinclair
 
Assessment in ME
Assessment in MEAssessment in ME
Assessment in MES A Tabish
 
Concept and nature of measurment and evaluation (1)
Concept and nature of measurment and evaluation (1)Concept and nature of measurment and evaluation (1)
Concept and nature of measurment and evaluation (1)dheerajvyas5
 
Language assessment tsl3123 notes
Language assessment tsl3123 notesLanguage assessment tsl3123 notes
Language assessment tsl3123 notesPeterus Balan
 
Languageassessmenttsl3123notes 141203115756-conversion-gate01 (1)
Languageassessmenttsl3123notes 141203115756-conversion-gate01 (1)Languageassessmenttsl3123notes 141203115756-conversion-gate01 (1)
Languageassessmenttsl3123notes 141203115756-conversion-gate01 (1)hakim azman
 
University of toronto transcription background paper
University of toronto transcription background paperUniversity of toronto transcription background paper
University of toronto transcription background paperAndrew Brown
 
A Successful Faculty Development Program For Implementing A Sociocultural EPo...
A Successful Faculty Development Program For Implementing A Sociocultural EPo...A Successful Faculty Development Program For Implementing A Sociocultural EPo...
A Successful Faculty Development Program For Implementing A Sociocultural EPo...Angel Evans
 
Influence of Table of Specification on the Construction of Ordinary Level Phy...
Influence of Table of Specification on the Construction of Ordinary Level Phy...Influence of Table of Specification on the Construction of Ordinary Level Phy...
Influence of Table of Specification on the Construction of Ordinary Level Phy...ijtsrd
 
ARTICLE ANALYSIS .docx
ARTICLE ANALYSIS                                                  .docxARTICLE ANALYSIS                                                  .docx
ARTICLE ANALYSIS .docxfestockton
 

Similar to A Standardized Rubric To Evaluate Student Presentations (20)

LESSON 6 JBF 361.pptx
LESSON 6 JBF 361.pptxLESSON 6 JBF 361.pptx
LESSON 6 JBF 361.pptx
 
Evaluation and measurement nursing education
Evaluation and measurement nursing educationEvaluation and measurement nursing education
Evaluation and measurement nursing education
 
OSCE Poster_Final
OSCE Poster_FinalOSCE Poster_Final
OSCE Poster_Final
 
Presentation2 with norbert boruett
Presentation2 with norbert boruettPresentation2 with norbert boruett
Presentation2 with norbert boruett
 
Presentation2
Presentation2Presentation2
Presentation2
 
Osce objective-structured-clinical-examination-revised-gupta-dewan-singh
Osce objective-structured-clinical-examination-revised-gupta-dewan-singhOsce objective-structured-clinical-examination-revised-gupta-dewan-singh
Osce objective-structured-clinical-examination-revised-gupta-dewan-singh
 
Assessment Methods In Medical Education
Assessment Methods In Medical EducationAssessment Methods In Medical Education
Assessment Methods In Medical Education
 
Assessmentof Nursing Students’ Attitude toward Learning Communication Skills ...
Assessmentof Nursing Students’ Attitude toward Learning Communication Skills ...Assessmentof Nursing Students’ Attitude toward Learning Communication Skills ...
Assessmentof Nursing Students’ Attitude toward Learning Communication Skills ...
 
Evaluation of the facilitating skills of clinical instructors in the supervis...
Evaluation of the facilitating skills of clinical instructors in the supervis...Evaluation of the facilitating skills of clinical instructors in the supervis...
Evaluation of the facilitating skills of clinical instructors in the supervis...
 
Brown Myford NCME presentation
Brown Myford NCME presentationBrown Myford NCME presentation
Brown Myford NCME presentation
 
Assessing Oral Presentation Performance
Assessing Oral Presentation PerformanceAssessing Oral Presentation Performance
Assessing Oral Presentation Performance
 
Assessment in ME
Assessment in MEAssessment in ME
Assessment in ME
 
Concept and nature of measurment and evaluation (1)
Concept and nature of measurment and evaluation (1)Concept and nature of measurment and evaluation (1)
Concept and nature of measurment and evaluation (1)
 
Language assessment tsl3123 notes
Language assessment tsl3123 notesLanguage assessment tsl3123 notes
Language assessment tsl3123 notes
 
Languageassessmenttsl3123notes 141203115756-conversion-gate01 (1)
Languageassessmenttsl3123notes 141203115756-conversion-gate01 (1)Languageassessmenttsl3123notes 141203115756-conversion-gate01 (1)
Languageassessmenttsl3123notes 141203115756-conversion-gate01 (1)
 
University of toronto transcription background paper
University of toronto transcription background paperUniversity of toronto transcription background paper
University of toronto transcription background paper
 
A Successful Faculty Development Program For Implementing A Sociocultural EPo...
A Successful Faculty Development Program For Implementing A Sociocultural EPo...A Successful Faculty Development Program For Implementing A Sociocultural EPo...
A Successful Faculty Development Program For Implementing A Sociocultural EPo...
 
Evaluation of healthcare science student learning styles based VARK analysis ...
Evaluation of healthcare science student learning styles based VARK analysis ...Evaluation of healthcare science student learning styles based VARK analysis ...
Evaluation of healthcare science student learning styles based VARK analysis ...
 
Influence of Table of Specification on the Construction of Ordinary Level Phy...
Influence of Table of Specification on the Construction of Ordinary Level Phy...Influence of Table of Specification on the Construction of Ordinary Level Phy...
Influence of Table of Specification on the Construction of Ordinary Level Phy...
 
ARTICLE ANALYSIS .docx
ARTICLE ANALYSIS                                                  .docxARTICLE ANALYSIS                                                  .docx
ARTICLE ANALYSIS .docx
 

More from Monica Waters

020 Buy Custom Essay Sample Office Absent Lett
020 Buy Custom Essay Sample Office Absent Lett020 Buy Custom Essay Sample Office Absent Lett
020 Buy Custom Essay Sample Office Absent LettMonica Waters
 
How To Write An Opinion Essay Essay Tigers
How To Write An Opinion Essay Essay TigersHow To Write An Opinion Essay Essay Tigers
How To Write An Opinion Essay Essay TigersMonica Waters
 
Essay Contest Opens For High School Students NIH Record
Essay Contest Opens For High School Students  NIH RecordEssay Contest Opens For High School Students  NIH Record
Essay Contest Opens For High School Students NIH RecordMonica Waters
 
Edit My College Essay. 10 Most Common College Es
Edit My College Essay. 10 Most Common College EsEdit My College Essay. 10 Most Common College Es
Edit My College Essay. 10 Most Common College EsMonica Waters
 
Crown Mill Luxury Letter Writing Pa
Crown Mill Luxury Letter Writing PaCrown Mill Luxury Letter Writing Pa
Crown Mill Luxury Letter Writing PaMonica Waters
 
Persuasive Writing Paragraph. How To Write A
Persuasive Writing Paragraph. How To Write APersuasive Writing Paragraph. How To Write A
Persuasive Writing Paragraph. How To Write AMonica Waters
 
How Does Nurture Influence Development. How Does N
How Does Nurture Influence Development. How Does NHow Does Nurture Influence Development. How Does N
How Does Nurture Influence Development. How Does NMonica Waters
 
View Formal Essay Examples For High Schoo
View Formal Essay Examples For High SchooView Formal Essay Examples For High Schoo
View Formal Essay Examples For High SchooMonica Waters
 
Evaluation Argument Essay Telegraph
Evaluation Argument Essay  TelegraphEvaluation Argument Essay  Telegraph
Evaluation Argument Essay TelegraphMonica Waters
 
Introduction In An Essay. What Shoul
Introduction In An Essay. What ShoulIntroduction In An Essay. What Shoul
Introduction In An Essay. What ShoulMonica Waters
 
Argumentative Essay Best A
Argumentative Essay  Best AArgumentative Essay  Best A
Argumentative Essay Best AMonica Waters
 
Writing Cause And Effect Essay Examples - Definitiv
Writing Cause And Effect Essay Examples - DefinitivWriting Cause And Effect Essay Examples - Definitiv
Writing Cause And Effect Essay Examples - DefinitivMonica Waters
 
How To Write A Compare And Contrast Essay Example. C
How To Write A Compare And Contrast Essay Example. CHow To Write A Compare And Contrast Essay Example. C
How To Write A Compare And Contrast Essay Example. CMonica Waters
 
Custom Writing Pros Cheap Custom Ess
Custom Writing Pros Cheap Custom EssCustom Writing Pros Cheap Custom Ess
Custom Writing Pros Cheap Custom EssMonica Waters
 
How Serious Is Essay Plagiarism Students The Guardian
How Serious Is Essay Plagiarism  Students  The GuardianHow Serious Is Essay Plagiarism  Students  The Guardian
How Serious Is Essay Plagiarism Students The GuardianMonica Waters
 
Website That Writes An Essay For You
Website That Writes An Essay For YouWebsite That Writes An Essay For You
Website That Writes An Essay For YouMonica Waters
 
Essay Websites Examples Of Satire Essays
Essay Websites Examples Of Satire EssaysEssay Websites Examples Of Satire Essays
Essay Websites Examples Of Satire EssaysMonica Waters
 
Essay Essaytips Essay University Ex
Essay Essaytips Essay University ExEssay Essaytips Essay University Ex
Essay Essaytips Essay University ExMonica Waters
 
Writing An Abstract For Your Research Paper The Writing Center UW ...
Writing An Abstract For Your Research Paper  The Writing Center  UW ...Writing An Abstract For Your Research Paper  The Writing Center  UW ...
Writing An Abstract For Your Research Paper The Writing Center UW ...Monica Waters
 
Analytical Essay My First Day At School Short Essay
Analytical Essay My First Day At School Short EssayAnalytical Essay My First Day At School Short Essay
Analytical Essay My First Day At School Short EssayMonica Waters
 

More from Monica Waters (20)

020 Buy Custom Essay Sample Office Absent Lett
020 Buy Custom Essay Sample Office Absent Lett020 Buy Custom Essay Sample Office Absent Lett
020 Buy Custom Essay Sample Office Absent Lett
 
How To Write An Opinion Essay Essay Tigers
How To Write An Opinion Essay Essay TigersHow To Write An Opinion Essay Essay Tigers
How To Write An Opinion Essay Essay Tigers
 
Essay Contest Opens For High School Students NIH Record
Essay Contest Opens For High School Students  NIH RecordEssay Contest Opens For High School Students  NIH Record
Essay Contest Opens For High School Students NIH Record
 
Edit My College Essay. 10 Most Common College Es
Edit My College Essay. 10 Most Common College EsEdit My College Essay. 10 Most Common College Es
Edit My College Essay. 10 Most Common College Es
 
Crown Mill Luxury Letter Writing Pa
Crown Mill Luxury Letter Writing PaCrown Mill Luxury Letter Writing Pa
Crown Mill Luxury Letter Writing Pa
 
Persuasive Writing Paragraph. How To Write A
Persuasive Writing Paragraph. How To Write APersuasive Writing Paragraph. How To Write A
Persuasive Writing Paragraph. How To Write A
 
How Does Nurture Influence Development. How Does N
How Does Nurture Influence Development. How Does NHow Does Nurture Influence Development. How Does N
How Does Nurture Influence Development. How Does N
 
View Formal Essay Examples For High Schoo
View Formal Essay Examples For High SchooView Formal Essay Examples For High Schoo
View Formal Essay Examples For High Schoo
 
Evaluation Argument Essay Telegraph
Evaluation Argument Essay  TelegraphEvaluation Argument Essay  Telegraph
Evaluation Argument Essay Telegraph
 
Introduction In An Essay. What Shoul
Introduction In An Essay. What ShoulIntroduction In An Essay. What Shoul
Introduction In An Essay. What Shoul
 
Argumentative Essay Best A
Argumentative Essay  Best AArgumentative Essay  Best A
Argumentative Essay Best A
 
Writing Cause And Effect Essay Examples - Definitiv
Writing Cause And Effect Essay Examples - DefinitivWriting Cause And Effect Essay Examples - Definitiv
Writing Cause And Effect Essay Examples - Definitiv
 
How To Write A Compare And Contrast Essay Example. C
How To Write A Compare And Contrast Essay Example. CHow To Write A Compare And Contrast Essay Example. C
How To Write A Compare And Contrast Essay Example. C
 
Custom Writing Pros Cheap Custom Ess
Custom Writing Pros Cheap Custom EssCustom Writing Pros Cheap Custom Ess
Custom Writing Pros Cheap Custom Ess
 
How Serious Is Essay Plagiarism Students The Guardian
How Serious Is Essay Plagiarism  Students  The GuardianHow Serious Is Essay Plagiarism  Students  The Guardian
How Serious Is Essay Plagiarism Students The Guardian
 
Website That Writes An Essay For You
Website That Writes An Essay For YouWebsite That Writes An Essay For You
Website That Writes An Essay For You
 
Essay Websites Examples Of Satire Essays
Essay Websites Examples Of Satire EssaysEssay Websites Examples Of Satire Essays
Essay Websites Examples Of Satire Essays
 
Essay Essaytips Essay University Ex
Essay Essaytips Essay University ExEssay Essaytips Essay University Ex
Essay Essaytips Essay University Ex
 
Writing An Abstract For Your Research Paper The Writing Center UW ...
Writing An Abstract For Your Research Paper  The Writing Center  UW ...Writing An Abstract For Your Research Paper  The Writing Center  UW ...
Writing An Abstract For Your Research Paper The Writing Center UW ...
 
Analytical Essay My First Day At School Short Essay
Analytical Essay My First Day At School Short EssayAnalytical Essay My First Day At School Short Essay
Analytical Essay My First Day At School Short Essay
 

Recently uploaded

DATA STRUCTURE AND ALGORITHM for beginners
DATA STRUCTURE AND ALGORITHM for beginnersDATA STRUCTURE AND ALGORITHM for beginners
DATA STRUCTURE AND ALGORITHM for beginnersSabitha Banu
 
CELL CYCLE Division Science 8 quarter IV.pptx
CELL CYCLE Division Science 8 quarter IV.pptxCELL CYCLE Division Science 8 quarter IV.pptx
CELL CYCLE Division Science 8 quarter IV.pptxJiesonDelaCerna
 
ESSENTIAL of (CS/IT/IS) class 06 (database)
ESSENTIAL of (CS/IT/IS) class 06 (database)ESSENTIAL of (CS/IT/IS) class 06 (database)
ESSENTIAL of (CS/IT/IS) class 06 (database)Dr. Mazin Mohamed alkathiri
 
à€­à€Ÿà€°à€€-à€°à„‹à€ź à€”à„à€Żà€Ÿà€Șà€Ÿà€°.pptx, Indo-Roman Trade,
à€­à€Ÿà€°à€€-à€°à„‹à€ź à€”à„à€Żà€Ÿà€Șà€Ÿà€°.pptx, Indo-Roman Trade,à€­à€Ÿà€°à€€-à€°à„‹à€ź à€”à„à€Żà€Ÿà€Șà€Ÿà€°.pptx, Indo-Roman Trade,
à€­à€Ÿà€°à€€-à€°à„‹à€ź à€”à„à€Żà€Ÿà€Șà€Ÿà€°.pptx, Indo-Roman Trade,Virag Sontakke
 
Historical philosophical, theoretical, and legal foundations of special and i...
Historical philosophical, theoretical, and legal foundations of special and i...Historical philosophical, theoretical, and legal foundations of special and i...
Historical philosophical, theoretical, and legal foundations of special and i...jaredbarbolino94
 
“Oh GOSH! Reflecting on Hackteria's Collaborative Practices in a Global Do-It...
“Oh GOSH! Reflecting on Hackteria's Collaborative Practices in a Global Do-It...“Oh GOSH! Reflecting on Hackteria's Collaborative Practices in a Global Do-It...
“Oh GOSH! Reflecting on Hackteria's Collaborative Practices in a Global Do-It...Marc Dusseiller Dusjagr
 
Framing an Appropriate Research Question 6b9b26d93da94caf993c038d9efcdedb.pdf
Framing an Appropriate Research Question 6b9b26d93da94caf993c038d9efcdedb.pdfFraming an Appropriate Research Question 6b9b26d93da94caf993c038d9efcdedb.pdf
Framing an Appropriate Research Question 6b9b26d93da94caf993c038d9efcdedb.pdfUjwalaBharambe
 
Computed Fields and api Depends in the Odoo 17
Computed Fields and api Depends in the Odoo 17Computed Fields and api Depends in the Odoo 17
Computed Fields and api Depends in the Odoo 17Celine George
 
Pharmacognosy Flower 3. Compositae 2023.pdf
Pharmacognosy Flower 3. Compositae 2023.pdfPharmacognosy Flower 3. Compositae 2023.pdf
Pharmacognosy Flower 3. Compositae 2023.pdfMahmoud M. Sallam
 
Earth Day Presentation wow hello nice great
Earth Day Presentation wow hello nice greatEarth Day Presentation wow hello nice great
Earth Day Presentation wow hello nice greatYousafMalik24
 
Proudly South Africa powerpoint Thorisha.pptx
Proudly South Africa powerpoint Thorisha.pptxProudly South Africa powerpoint Thorisha.pptx
Proudly South Africa powerpoint Thorisha.pptxthorishapillay1
 
Enzyme, Pharmaceutical Aids, Miscellaneous Last Part of Chapter no 5th.pdf
Enzyme, Pharmaceutical Aids, Miscellaneous Last Part of Chapter no 5th.pdfEnzyme, Pharmaceutical Aids, Miscellaneous Last Part of Chapter no 5th.pdf
Enzyme, Pharmaceutical Aids, Miscellaneous Last Part of Chapter no 5th.pdfSumit Tiwari
 
Software Engineering Methodologies (overview)
Software Engineering Methodologies (overview)Software Engineering Methodologies (overview)
Software Engineering Methodologies (overview)eniolaolutunde
 
Final demo Grade 9 for demo Plan dessert.pptx
Final demo Grade 9 for demo Plan dessert.pptxFinal demo Grade 9 for demo Plan dessert.pptx
Final demo Grade 9 for demo Plan dessert.pptxAvyJaneVismanos
 
Crayon Activity Handout For the Crayon A
Crayon Activity Handout For the Crayon ACrayon Activity Handout For the Crayon A
Crayon Activity Handout For the Crayon AUnboundStockton
 
Types of Journalistic Writing Grade 8.pptx
Types of Journalistic Writing Grade 8.pptxTypes of Journalistic Writing Grade 8.pptx
Types of Journalistic Writing Grade 8.pptxEyham Joco
 
MARGINALIZATION (Different learners in Marginalized Group
MARGINALIZATION (Different learners in Marginalized GroupMARGINALIZATION (Different learners in Marginalized Group
MARGINALIZATION (Different learners in Marginalized GroupJonathanParaisoCruz
 
CARE OF CHILD IN INCUBATOR..........pptx
CARE OF CHILD IN INCUBATOR..........pptxCARE OF CHILD IN INCUBATOR..........pptx
CARE OF CHILD IN INCUBATOR..........pptxGaneshChakor2
 

Recently uploaded (20)

DATA STRUCTURE AND ALGORITHM for beginners
DATA STRUCTURE AND ALGORITHM for beginnersDATA STRUCTURE AND ALGORITHM for beginners
DATA STRUCTURE AND ALGORITHM for beginners
 
CELL CYCLE Division Science 8 quarter IV.pptx
CELL CYCLE Division Science 8 quarter IV.pptxCELL CYCLE Division Science 8 quarter IV.pptx
CELL CYCLE Division Science 8 quarter IV.pptx
 
ESSENTIAL of (CS/IT/IS) class 06 (database)
ESSENTIAL of (CS/IT/IS) class 06 (database)ESSENTIAL of (CS/IT/IS) class 06 (database)
ESSENTIAL of (CS/IT/IS) class 06 (database)
 
Model Call Girl in Bikash Puri Delhi reach out to us at 🔝9953056974🔝
Model Call Girl in Bikash Puri  Delhi reach out to us at 🔝9953056974🔝Model Call Girl in Bikash Puri  Delhi reach out to us at 🔝9953056974🔝
Model Call Girl in Bikash Puri Delhi reach out to us at 🔝9953056974🔝
 
à€­à€Ÿà€°à€€-à€°à„‹à€ź à€”à„à€Żà€Ÿà€Șà€Ÿà€°.pptx, Indo-Roman Trade,
à€­à€Ÿà€°à€€-à€°à„‹à€ź à€”à„à€Żà€Ÿà€Șà€Ÿà€°.pptx, Indo-Roman Trade,à€­à€Ÿà€°à€€-à€°à„‹à€ź à€”à„à€Żà€Ÿà€Șà€Ÿà€°.pptx, Indo-Roman Trade,
à€­à€Ÿà€°à€€-à€°à„‹à€ź à€”à„à€Żà€Ÿà€Șà€Ÿà€°.pptx, Indo-Roman Trade,
 
Historical philosophical, theoretical, and legal foundations of special and i...
Historical philosophical, theoretical, and legal foundations of special and i...Historical philosophical, theoretical, and legal foundations of special and i...
Historical philosophical, theoretical, and legal foundations of special and i...
 
“Oh GOSH! Reflecting on Hackteria's Collaborative Practices in a Global Do-It...
“Oh GOSH! Reflecting on Hackteria's Collaborative Practices in a Global Do-It...“Oh GOSH! Reflecting on Hackteria's Collaborative Practices in a Global Do-It...
“Oh GOSH! Reflecting on Hackteria's Collaborative Practices in a Global Do-It...
 
OS-operating systems- ch04 (Threads) ...
OS-operating systems- ch04 (Threads) ...OS-operating systems- ch04 (Threads) ...
OS-operating systems- ch04 (Threads) ...
 
Framing an Appropriate Research Question 6b9b26d93da94caf993c038d9efcdedb.pdf
Framing an Appropriate Research Question 6b9b26d93da94caf993c038d9efcdedb.pdfFraming an Appropriate Research Question 6b9b26d93da94caf993c038d9efcdedb.pdf
Framing an Appropriate Research Question 6b9b26d93da94caf993c038d9efcdedb.pdf
 
Computed Fields and api Depends in the Odoo 17
Computed Fields and api Depends in the Odoo 17Computed Fields and api Depends in the Odoo 17
Computed Fields and api Depends in the Odoo 17
 
Pharmacognosy Flower 3. Compositae 2023.pdf
Pharmacognosy Flower 3. Compositae 2023.pdfPharmacognosy Flower 3. Compositae 2023.pdf
Pharmacognosy Flower 3. Compositae 2023.pdf
 
Earth Day Presentation wow hello nice great
Earth Day Presentation wow hello nice greatEarth Day Presentation wow hello nice great
Earth Day Presentation wow hello nice great
 
Proudly South Africa powerpoint Thorisha.pptx
Proudly South Africa powerpoint Thorisha.pptxProudly South Africa powerpoint Thorisha.pptx
Proudly South Africa powerpoint Thorisha.pptx
 
Enzyme, Pharmaceutical Aids, Miscellaneous Last Part of Chapter no 5th.pdf
Enzyme, Pharmaceutical Aids, Miscellaneous Last Part of Chapter no 5th.pdfEnzyme, Pharmaceutical Aids, Miscellaneous Last Part of Chapter no 5th.pdf
Enzyme, Pharmaceutical Aids, Miscellaneous Last Part of Chapter no 5th.pdf
 
Software Engineering Methodologies (overview)
Software Engineering Methodologies (overview)Software Engineering Methodologies (overview)
Software Engineering Methodologies (overview)
 
Final demo Grade 9 for demo Plan dessert.pptx
Final demo Grade 9 for demo Plan dessert.pptxFinal demo Grade 9 for demo Plan dessert.pptx
Final demo Grade 9 for demo Plan dessert.pptx
 
Crayon Activity Handout For the Crayon A
Crayon Activity Handout For the Crayon ACrayon Activity Handout For the Crayon A
Crayon Activity Handout For the Crayon A
 
Types of Journalistic Writing Grade 8.pptx
Types of Journalistic Writing Grade 8.pptxTypes of Journalistic Writing Grade 8.pptx
Types of Journalistic Writing Grade 8.pptx
 
MARGINALIZATION (Different learners in Marginalized Group
MARGINALIZATION (Different learners in Marginalized GroupMARGINALIZATION (Different learners in Marginalized Group
MARGINALIZATION (Different learners in Marginalized Group
 
CARE OF CHILD IN INCUBATOR..........pptx
CARE OF CHILD IN INCUBATOR..........pptxCARE OF CHILD IN INCUBATOR..........pptx
CARE OF CHILD IN INCUBATOR..........pptx
 

A Standardized Rubric To Evaluate Student Presentations

  • 1. INSTRUCTIONAL DESIGN AND ASSESSMENT A Standardized Rubric to Evaluate Student Presentations Michael J. Peeters, PharmD, MEd,a Eric G. Sahloff, PharmD,a and Gregory E. Stone, PhDb a University of Toledo College of Pharmacy b University of Toledo College of Education Submitted April 18, 2010; accepted August 2, 2010; published November 10, 2010. Objective. To design, implement, and assess a rubric to evaluate student presentations in a capstone doctor of pharmacy (PharmD) course. Design. A 20-item rubric was designed and used to evaluate student presentations in a capstone fourth- year course in 2007-2008, and then revised and expanded to 25 items and used to evaluate student presentations for the same course in 2008-2009. Two faculty members evaluated each presentation. Assessment. The Many-Facets Rasch Model (MFRM) was used to determine the rubric’s reliability, quantify the contribution of evaluator harshness/leniency in scoring, and assess grading validity by comparing the current grading method with a criterion-referenced grading scheme. In 2007-2008, rubric reliability was 0.98, with a separation of 7.1 and 4 rating scale categories. In 2008-2009, MFRM analysis suggested 2 of 98 grades be adjusted to eliminate evaluator leniency, while a further criterion- referenced MFRM analysis suggested 10 of 98 grades should be adjusted. Conclusion. The evaluation rubric was reliable and evaluator leniency appeared minimal. However, a criterion-referenced re-analysis suggested a need for further revisions to the rubric and evaluation process. Keywords: assessment, evaluation, reliability, rating scale, criterion-referenced grading, rubric INTRODUCTION Evaluations are important in the process of teaching andlearning.Inhealthprofessionseducation,performance- based evaluations are identified as having ‘‘an emphasis on testing complex, ‘higher-order’ knowledge and skills in the real-world context in which they are actually used.’’1 Objective structured clinical examinations (OSCEs) are a common, notable example.2 On Miller’s pyramid, a frame- work used in medical education for measuring learner out- comes, ‘‘knows’’ is placed at the base of the pyramid, followed by ‘‘knows how,’’ then ‘‘shows how,’’ and fi- nally, ‘‘does’’ is placed at the top.3 Based on Miller’s pyramid, evaluation formats that use multiple-choice test- ing focus on ‘‘knows’’ while an OSCE focuses on ‘‘shows how.’’ Just as performance evaluations remain highly val- ued in medical education,4 authentic task evaluations in pharmacy education may be better indicators of future pharmacist performance.5 Much attention in medical ed- ucation has been focused on reducing the unreliability of high-stakes evaluations.6 Regardless of educational disci- pline, high-stakes performance-based evaluations should meet educational standards for reliability and validity.7 PharmD students at University of Toledo College of Pharmacy (UTCP) were required to complete a course on presentations during their final year of pharmacy school and then give a presentation that served as both a capstone experience and a performance-based evaluation for the course. Pharmacists attending the presentations were given Accreditation Council for Pharmacy Education (ACPE)-approved continuing education credits. An eval- uation rubric for grading the presentations was designed to allow multiple faculty evaluators to objectively score student performances in the domains of presentation de- livery and content. Given the pass/fail grading procedure used in advanced pharmacy practice experiences, passing this presentation-based course and subsequently graduat- ing from pharmacy school were contingent upon this high-stakes evaluation. As a result, the reliability and validity of the rubric used and the evaluation process needed to be closely scrutinized. Each year, about 100 students completed presentations and at least 40 faculty members served as evaluators. With the use of multiple evaluators, a question of evaluator le- niency often arose (ie, whether evaluators used the same criteria for evaluating performances or whether some eval- uators graded easier or more harshly than others). At UTCP, opinions among some faculty evaluators and many PharmD students implied that evaluator leniency in judging the stu- dents’ presentations significantly affected specific students’ Corresponding Author: Michael J. Peeters, PharmD, MEd, University of Toledo College of Pharmacy, 3000 Arlington Ave, MS 1013, Toledo, OH 43614, Phone: 419-383-1946, E-mail: michael.peeters@utoledo.edu American Journal of Pharmaceutical Education 2010; 74 (9) Article 171. 1
  • 2. grades and ultimately their graduation from pharmacy school.Whileitwasplausiblethatevaluatorleniencywasoc- curring, the magnitude of the effect was unknown. Thus, this study was initiated partly to address this concern over grad- ing consistency and scoring variability among evaluators. Because both students’ presentation style and content were deemed important, each item of the rubric was weighted the same across delivery and content. However, because there were more categories related to delivery than content, an additional faculty concern was that stu- dents feasibly could present poor content but have an effective presentation delivery and pass the course. The objectives for this investigation were: (1) to de- scribe and optimize the reliability of the evaluation rubric used in this high-stakes evaluation; (2) to identify the con- tribution and significance of evaluator leniency to evalua- tion reliability; and (3) to assess the validity of this evaluation rubricwithinacriterion-referencedgradingpar- adigm focused on both presentation delivery and content. DESIGN The University of Toledo’s Institutional Review Board approved this investigation. This study investigated perfor- mance evaluation data for an oral presentation course for final-year PharmD students from 2 consecutive academic years (2007-2008 and 2008-2009). The course was taken during the fourth year (P4) of the PharmD program and was a high-stakes, performance-based evaluation. The goal of the course was to serve as a capstone experience, enabling studentstodemonstrateadvanceddrugliteratureevaluation and verbal presentations skills through the development and delivery of a 1-hour presentation. These presentations were to be on a current pharmacy practice topic and of sufficient quality for ACPE-approved continuing educa- tion. This experience allowed students to demonstrate their competencies in literature searching, literature evaluation, andapplicationofevidence-basedmedicine,aswellastheir oral presentation skills. Students worked closely with a faculty advisor to develop their presentation. Each class (2007-2008 and 2008-2009) was randomly divided, with half of the students taking the course and completing their presentation and evaluation in the fall semester and the other half in the spring semester. To accommodate such a large number of students presenting for 1 hour each, it was necessary to use multiple rooms with presentations taking place concurrently over 2.5 days for both the fall and spring sessions of the course. Two faculty members indepen- dently evaluated each student presentation using the pro- vided evaluation rubric. The 2007-2008 presentations involved 104 PharmD students and 40 faculty evaluators, while the 2008-2009 presentations involved 98 students and 46 faculty evaluators. After vetting through the pharmacy practice faculty, the initial rubric used in 2007-2008 focused on describing explicit, specific evaluation criteria such as amounts of eye contact, voice pitch/volume, and descriptions of study methods. The evaluation rubric used in 2008-2009 was similar to the initial rubric, but with 5 items added (Figure 1). The evaluators rated each item (eg, eye contact) based on their perception of the student’s performance. The 25 rubric items had equal weight (ie, 4 points each), but each item received a rating from the evaluator of 1 to 4 points. Thus, only 4 rating categories were included as has been recommended in the literature.8 However, some evaluators created an additional 3 rating categories by marking lines in between the 4 ratings to signify half points ie, 1.5, 2.5, and 3.5. For example, for the ‘‘notecards/notes’’ item in Figure 1, a student looked at her notes sporadically during herpresentation,butnotdistractinglynorenoughtowarrant a score of 3 in the faculty evaluator’s opinion, so a 3.5 was given. Thus, a 7-category rating scale (1, 1.5, 2, 2.5. 3, 3.5, and 4) was analyzed. Each independent evaluator’s ratings for the 25 items were summed to form a score (0-100%). The 2 evaluators’ scores then were averaged and a letter grade was assigned based on the following scale: .90% 5 A, 80%-89% 5 B, 70%-79% 5 C, ,70% 5 F. EVALUATION AND ASSESSMENT Rubric Reliability To measure rubric reliability, iterative analyses were performed on the evaluations using the Many-Facets Rasch Model (MFRM) following the 2007-2008 data collection period. While Cronbach’s alpha is the most commonly reported coefficient of reliability, its single number report- ing without supplementary information can provide incom- plete information about reliability.9-11 Due to its formula, Cronbach’s alpha can be increased by simply adding more repetitive rubric items or having more rating scale cate- gories, even when no further useful information has been added. The MFRM reports separation, which is calculated differently than Cronbach’s alpha, is another source of re- liability information. Unlike Cronbach’s alpha, separation does not appear enhanced by adding further redundant items. From a measurement perspective, a higher separa- tion value is better than a lower one because students are being divided into meaningful groups after measurement error has been accounted for. Separation can be thought of as the number of units on a ruler where the more units the ruler has, the larger the range of performance levels that can be measured among students. For example, a separation of 4.0 suggests 4 graduations such that a grade of A is dis- tinctly different from a grade of B, which in turn is different from a grade of C or of F. In measuring performances, a separation of 9.0 is better than 5.5, just as a separation American Journal of Pharmaceutical Education 2010; 74 (9) Article 171. 2
  • 3. American Journal of Pharmaceutical Education 2010; 74 (9) Article 171. 3
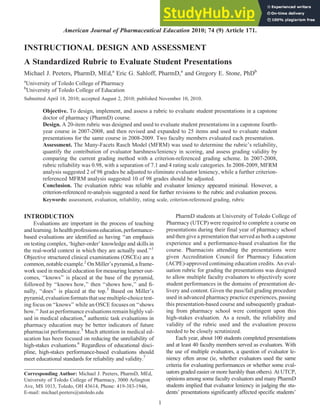
  • 4. Figure 1. Rubric used to evaluate student presentations given in a 2008-2009 capstone PharmD course. American Journal of Pharmaceutical Education 2010; 74 (9) Article 171. 4
  • 5. of 7.0 is better than a 6.5; a higher separation coefficient suggests that student performance potentially could be di- videdintoalargernumberofmeaningfullyseparategroups. The rating scale can have substantial effects on re- liability,8 while description of how a rating scale func- tions is a unique aspect of the MFRM. With analysis iterations of the 2007-2008 data, the number of rating scale categories were collapsed consecutively until im- provements in reliability and/or separation were no longer found. The last positive iteration that led to positive im- provements in reliability or separation was deemed an optimal rating scale for this evaluation rubric. In the 2007-2008 analysis, iterations of the data where runthroughtheMFRM.Whileonly4ratingscalecategories hadbeenincludedontherubric,becausesomefacultymem- bers inserted 3 in-between categories, 7 categories had to be included in the analysis. This initial analysis based on a 7- category rubric provided a reliability coefficient (similar to Cronbach’s alpha) of 0.98, while the separation coefficient was 6.31. The separation coefficient denoted 6 distinctly separate groups of students based on the items. Rating scale categories were collapsed, with ‘‘in-between’’ categories included in adjacent full-point categories. Table 1 shows the reliability and separation for the iterations as the rating scalewascollapsed.Asshown,theoptimalevaluationrubric maintained a reliability of 0.98, but separation improved the reliability to 7.10 or 7 distinctly separate groups of students based on the items. Another distinctly separate group was added through a reduction in the rating scale while no change was seen to Cronbach’salpha, even though thenum- ber of rating scale categories was reduced. Table 1 describes thestepwise,sequentialpatternacrossthefinal4ratingscale categories analyzed. Informed by the 2007-2008 results, the 2008-2009 evaluation rubric (Figure 1) used 4 rating scale categories and reliability remained high. Evaluator Leniency Described by Fleming and colleagues over half a cen- tury ago,6 harsh raters (ie, hawks) or lenient raters (ie, doves) have also been demonstrated in more recent studies as an issue as well.12-14 Shortly after 2008-2009 data were collected, those evaluations by multiple faculty evaluators were collated and analyzed in the MFRM to identify pos- sible inconsistent scoring. While traditional interrater re- liability does not deal with this issue, the MFRM had been usedpreviouslytoillustrateevaluatorleniencyonlicensing examinations formedical students and medical residents in the United Kingdom.13 Thus, accounting for evaluator le- niency may prove important to grading consistency (and reliability) in a course using multiple evaluators. Along with identifying evaluator leniency, the MFRM also cor- rected for this variability. For comparison, course grades were calculated by summing the evaluators’ actual ratings (as discussed in the Design section) and compared with the MFRM-adjusted grades to quantify the degree of evaluator leniency occurring in this evaluation. Measurescreated fromthedata analysis in theMFRM were converted to percentages using a common linear test-equating procedure involving the mean and standard deviation of the dataset.15 To these percentages, student letter grades were assigned using the same traditional method used in 2007-2008 (ie, 90% 5 A, 80% - 89% 5 B, 70% - 79% 5 C, ,70% 5 F). Letter grades calculated using the revised rubric and the MFRM then were com- pared to letter grades calculated using the previous rubric and course grading method. In the analysis of the 2008-2009 data, the interrater reliability for the letter grades when comparing the 2 in- dependent faculty evaluations for each presentation was 0.98 by Cohen’s kappa. However, using the 3-facet MRFM revealed significant variation in grading. The in- teraction of evaluator leniency on student ability and item difficulty was significant, with a chi-square of p , 0.01. As well, the MFRM showed a reliability of 0.77, with a separation of 1.85 (ie, almost 2 groups of evaluators). The MFRM student ability measures were scaled to letter gradesandcomparedwithcourselettergrades.Asaresult, 2 B’s became A’s and so evaluator leniency accounted for a 2% change in letter grades (ie, 2 of 98 grades). Validity and Grading Explicit criterion-referenced standards for grading are recommended for higher evaluation validity.3,16-18 The course coordinator completed 3 additional evaluations of a hypothetical student presentation rating the minimal cri- teria expected to describe each of an A, B, or C letter grade performance. These evaluations were placed with the other196evaluations(2evaluators 3 98students)from Table 1. Evaluation Rubric Reliability and Separation with Iterations While Collapsing Rating Scale Categories. Number of Rating Scale Categories for Each Item Rubric Reliabilitya Rubric Separationb Standard Error of Measurement 7 0.98 6.31 0.20 6 0.98 6.43 0.15 5 0.98 6.78 0.14 4c 0.98 7.10 0.12 3 0.97 6.85 0.17 a Reliability coefficient of variance in rater response that is repro- ducible (ie, Cronbach’s alpha). b Separation is a coefficient of item standard deviation divided by average measurement error and is an additional reliability coefficient. c Optimal number of rating scale categories based on the highest reliability (0.98) and separation (7.1) values. American Journal of Pharmaceutical Education 2010; 74 (9) Article 171. 5
  • 6. 2008-2009 into the MFRM, with the resulting analysis re- port giving specific cutoff percentage scores for each letter grade. Unlike the traditional scoring method of assigning all items an equal weight, the MFRM ordered evaluation items from those more difficult for students (given more weight) to those less difficult for students (given less weight). These criterion-referenced letter grades were compared with the grades generated using the traditional grading process. When the MFRM data were rerun with the criterion- referencedevaluationsaddedintothedataset,a10%change was seen with letter grades (ie, 10 of 98 grades). When the 10 letter grades were lowered, 1 was below a C, the mini- mum standard, and suggested a failing performance. Qual- itative feedback from faculty evaluators agreed with this suggested criterion-referenced performance failure. Measurement Model Within modern test theory, the Rasch Measurement Model maps examinee ability with evaluation item diffi- culty. Items are not arbitrarily given the same value (ie, 1 point) but vary based on how difficult or easy the items were for examinees. The Rasch measurement model has been used frequently in educational research,19 by numer- ous high-stakes testing professional bodies such as the National Board of Medical Examiners,20 and also by var- ious state-level departments of education for standardized secondary education examinations.21 The Rasch mea- surement model itself has rigorous construct validity and reliability.22 A 3-facet MFRM model allows an eval- uator variable to be added to the student ability and item difficulty variables that are routine in other Rasch mea- surement analyses. Just as multiple regression accounts for additional variables in analysis compared to a simple bivariate regression, the MFRM is a multiple variable variant of the Rasch measurement model and was ap- plied in this study using the Facets software (Linacre, Chicago, IL). The MFRM is ideal for performance-based evaluations with the addition of independent evaluator/ judges.8,23 From both yearly cohorts in this investigation, evaluation rubric data were collated and placed into the MFRM for separate though subsequent analyses. Within the MFRM output report, a chi-square for a difference in evaluator leniency was reported with an alpha of 0.05. DISCUSSION The presentation rubric was reliable. Results from the 2007-2008 analysis illustrated that the number of rating scale categories impacted the reliability of this rubric and that use of only 4 rating scale categories appeared best for measurement. While a 10-point Likert-like scale may com- monly be used in patient care settings, such as in quantify- ing pain, most people cannot process more then 7 points or categories reliably.24 Presumably, when more than 7 cat- egories are used, the categories beyond 7 either are not used or are collapsed by respondents into fewer than 7 categories. Five-point scales commonly are encountered, but use of an odd number of categories can be problematic to interpreta- tion and is not recommended.25 Responses using the middle category could denote a true perceived average or neutral response or responder indecisiveness or even confusion over the question. Therefore, removing the middle category appears advantageous and is supported by our results. With 2008-2009 data, the MFRM identified evaluator leniency with some evaluators grading more harshly while others were lenient. Evaluator leniency was indeed found in the dataset but only a couple of changes were suggested based on the MFRM-corrected evaluator leniency and did not appear to play a substantial role in the evaluation of this course at this time. Performance evaluation instruments are either holistic oranalyticrubrics.26 The evaluationinstrument used inthis investigation exemplified an analytic rubric, which elicits specific observations and often demonstrates high reli- ability. However, Norman and colleagues point out a conundrum where drastically increasing the number of evaluation rubric items (creating something similar to a checklist) could augment a reliability coefficient though it appears to dissociate from that evaluation rubric’s validity.27 Validity may be more than the sum of behav- iors on evaluation rubric items.28 Having numerous, highly specific evaluation items appears to undermine the rubric’s function. With this investigation’s evalua- tion rubric and its numerous items for both presentation style and presentation content, equal numeric weighting of items can in fact allow student presentations to re- ceive a passing score while falling short of the course objectives, as was shown in the present investigation. As opposed to analytic rubrics, holistic rubrics often dem- onstrate lower yet acceptable reliability, while offering a higher degree of explicit connection to course objec- tives. A summative, holistic evaluation of presentations may improve validity by allowing expert evaluators to provide their ‘‘gut feeling’’ as experts on whether a per- formance is ‘‘outstanding,’’ ‘‘sufficient,’’ ‘‘borderline,’’ or ‘‘subpar’’ for dimensions of presentation delivery and content. A holistic rubric that integrates with criteria of the analytic rubric (Figure 1) for evaluators to reflect on but maintains a summary, overall evaluation for each dimension (delivery/content) of the performance, may allow for benefits of each type of rubric to be used ad- vantageously. This finding has been demonstrated with OSCEs in medical education where checklists for com- pleted items (ie, yes/no) at an OSCE station have been American Journal of Pharmaceutical Education 2010; 74 (9) Article 171. 6
  • 7. successfully replaced with a few reliable global impres- sion rating scales.29-31 Alternatively,and becausethe MFRMmodel was used in the current study, an items-weighting approach could be used with the analytic rubric. That is, item weighting based on the difficulty of each rubric item could suggest how many points should be given for that rubric items, eg, some items would be worth 0.25 points, while others would be worth 0.5 points or 1 point (Table 2). As could be expected, the more complex the rubric scoring be- comes, the less feasible the rubric is to use. This was the mainreason whythisrevision approachwasnot chosenby the course coordinator following this study. As well, it doesnot address theconundrumthat the performance may be more than the summation of behavior items in the Figure 1 rubric. This current study cannot suggest which approach would be better as each would have its merits and pitfalls. Regardless of which approach is used, alignment of the evaluation rubric with the course objectives is imper- ative. Objectivity has been described as a general striving for value-free measurement (ie, free of the evaluator’s interests, opinions, preferences, sentiments).27 This is a laudable goal pursued through educational research. Strategies to reduce measurement error, termed objectifi- cation, may not necessarily lead to increased objectiv- ity.27 The current investigation suggested that a rubric could become too explicit if all the possible areas of an oral presentation that could be assessed (ie, objectifica- tion) were included. This appeared to dilute the effect of important items and lose validity. A holistic rubric that is more straightforward and easier to score quickly may be less likely to lose validity (ie, ‘‘lose the forest for the trees’’), though operationalizing a revised rubric would need to be investigated further. Similarly, weighting items in an analytic rubric based on their importance and difficulty for students may alleviate this issue; how- ever, adding up individual items might prove arduous. While the rubric in Figure 1, which has evolved over the years, is the subject of ongoing revisions, it appears a reliable rubric on which to build. The major limitation of this study involves the obser- vationalmethod thatwas employed.Although the2 cohorts were from a single institution, investigators did use a com- pletely separate class of PharmD students to verify initial instrument revisions. Optimizing the rubric’s rating scale involved collapsing data from misuse of a 4-category rating scale (expanded by evaluators to 7 categories) by a few of the evaluators into 4 independent categories without middle ratings. As a result of the study findings, no actual grading adjustments were made for students in the 2008-2009 presentation course; however, adjustment using the MFRM have been suggested by Roberts and colleagues.13 Since 2008-2009, the course coordinator has made further small revisions to the rubric based on feedback from evaluators, but these have not yet been re- analyzed with the MFRM. SUMMARY The evaluation rubric used in this study for student performance evaluations showed high reliability and the data analysis agreed with using 4 rating scale categories to optimize the rubric’s reliability. While lenient and harsh faculty evaluators were found, variability in evaluator scor- ing affected grading in this course only minimally. Aside from reliability, issues of validity were raised using crite- rion-referenced grading. Future revisions to this evaluation rubric should reflect these criterion-referenced concerns. The rubric analyzed herein appears a suitable starting point for reliable evaluation of PharmD oral presentations, Table 2. Rubric Item Weightings Suggested in the 2008-2009 Data Many-Facet Rasch Measurement Analysis Item Categories Rubric Item Weighting (Points) Delivery- Nonverbal skills Eye contact 0.5 Notes 0.5 Facial Expressions 1 Composure 1 Gestures 0.5 Posture 0.5 Delivery- Verbal Skills Enthusiasm 1 Articulation 1 Rate of speech 0.25 Volume of speech 0.25 Delivery- Visual Aids Slide effectiveness 1 Slide spelling 0.5 Handout effectiveness 1 Handout spelling 0.5 References 0.5 Content/organization Objectives 1 Relevance 1 Balanced representation 1 Literature selection 1 Methodology/statistics 1 Critique 1 Transitions 1 Organization 1 Application 1 Questions 1 Total 20 American Journal of Pharmaceutical Education 2010; 74 (9) Article 171. 7
  • 8. though it has limitations that could be addressed with further attention and revisions. ACKNOWLEDGEMENT Author contributions— MJP and EGS conceptualized the study, while MJP and GES designed it. MJP, EGS, and GES gave educational content foci for the rubric. As the study statistician, MJP analyzed and interpreted the study data. MJP reviewed the literature and drafted a manuscript. EGS and GES critically reviewed this manuscript and ap- proved the final version for submission. MJP accepts over- all responsibility for the accuracy of the data, its analysis, and this report. REFERENCES 1. Swanson DB, Norman GR, Linn RL. Performance-based assessment: lessons from the health professions. Educ Res. 1995;24(5):5-11. 2. Harden RM, Stevenson M, Downie WW, Wilson GM. Assessment of clinical competence using objective structured examination. BMJ. 1975;1(5955):447-451. 3. Miller GE. The assessment of clinical skills/competence/ performance. Acad Med. 1990;65(9):S63-S67. 4. Howley LD. Performance assessment in medical education: where we’ve been and where we’re going. Eval Health Prof. 2004;27(3):285-303. 5. Romanelli F. Pharmacist licensure: time to step it up? Am J Pharm Educ. 2010;74(5):Article 91. 6. Fleming PR, Manderson WG, Matthews MB, Sanderson PH, Stokes JF. Evolution of an examination: M.R.C.P. (U.K.). BMJ. 1974;2(5910):99-107. 7. American Educational Research Association, American Psychological Association, and National Council on Measurement in Education. Standards for educational and psychological testing. Washington DC: American Psychological Association, 1999. 8. Stone MH. Substantive scale construction. J Appl Meas. 2003;4(3):282-297. 9. Lunz ME, Schumacker RE. Scoring and analysis of performance examinations: a comparison of methods and interpretations. J Outcome Meas. 1997;1(3):219-238. 10. Cortina JM. What is coefficient alpha? An examination of theory and applications. J Appl Psychol. 1993;78(1):98-104. 11. Streiner DL. Starting at the beginning: an introduction to coefficient alpha and internal consistency. J Pers Assess. 2003;80(1):99-103. 12. Iramaneerat C, Yudkowsky R. Rate errors in a clinical skills assessment of medical students. Eval Health Prof. 2007;30(3): 266-283. 13. McManus IC, Thompson M, Mollon J. Assessment of examiner leniency and stringency (‘hawk-dove effect’) in the MRCP(UK) clinical examination (PACES) using multi-facet Rasch modelling. BMC Med Educ. 2006;6:Article 42. 14. Roberts C, Rothnie I, Zoanetti N, Crossley J. Should candidate scores be adjusted for interviewer stringency or leniency in the multiple mini-interview? Med Educ. 2010;44:690-698. 15. Kolen MJ, Brennan RL. Test Equating. New York NY: Springer- Verlag, 2004. 16. Zlatic TD. Using assessment to structure learning: putting it all together. In: Re-visioning Professional Education: An Orientation to Teaching. Kansas City, MO: American College of Clinical Pharmacy, 2005:81-105. 17. Norcini J. Approaches to standard-setting for performance- based examinations. In: Harden RM, Hart IR, Mulholland H, eds. Approaches to the Assessment of Clinical Competence Part 1. Dundee, Scotland: Centre for Medical Education, 1992: 32-37. 18. Stone GE. Objective standard setting (or truth in advertising). J Appl Meas. 2001;2(2):187-201. 19. Chang C, Reeve B. Item response theory and its applications to patient-reported outcome measures. Eval Health Prof. 2005;28: 264-282. 20. Downing S. Item-response theory: applications of modern test theory in medical education. Med Educ. 2003;37:739-745. 21. Boone W. Explaining Rasch measurement in different ways. Rasch Measurement Transactions. 2009;23:1198. 22. Smith EV Jr. Evidence for the reliability of measures and validity of measure interpretation: a Rasch measurement perspective. J Appl Meas. 2001;2(3):281-311. 23. Linacre JM. Many-Facet Rasch Measurement. Chicago, IL: MESA Press; 1994. 24. Miller GA. The magical number seven, plus or minus two: some limits on our capacity for processing information. Psychol Rev. 1956;63(2):81-97. 25. Weems GH, Onwuegbuzie AJ. The impact of midpoint responses and reverse coding on survey data. Measure Eval Couns Develop. 2001;34(3):166-176. 26. Johnson RL, Penny JA, Gordon B. Assessing Performance: Designing, Scoring, and Validating Performance Tasks. New York, NY: The Guilford Press; 2009. 27. Norman GR, Van der Vleuten CPM, De Graaff E. Pitfalls in the pursuit of objectivity: issues of validity, efficiency and acceptability. Med Educ. 1991;25:119-126. 28. Streiner DL, Norman GR. Health Measurement Scales: A Practical Guide to Their Development and Use. 4th ed. New York NY: Oxford University Press; 2008. 29. Regehr G, MacRae H, Reznick RK, Szalay D. Comparing the psychometric properties of checklists and global rating scales for assessing performance on an OSCE-format examination. Acad Med. 1998;73(9):993-997. 30. Hodges B, Regehr G, McNaughton N, Tiberius R, Hanson M. OSCE checklists do not capture increasing levels of expertise. Acad Med. 1999;74(10):1129-1134. 31. Hodges B, McIlroy JH. Analytic global OSCE ratings are sensitive to levels of training. Med Educ. 2003;37(11):1012-1016. American Journal of Pharmaceutical Education 2010; 74 (9) Article 171. 8