
Recommended
More Related Content
What's hot
What's hot (20)
Similar to Understanding P-Values in Statistics and Research
Similar to Understanding P-Values in Statistics and Research (20)
Recently uploaded
Recently uploaded (20)
Understanding P-Values in Statistics and Research
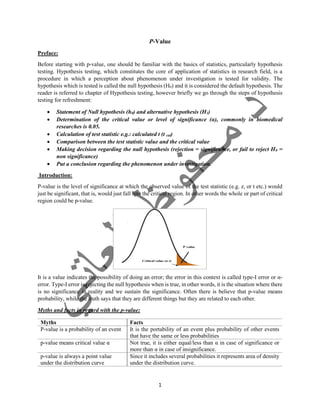
- 1. 1 P-Value Preface: Before starting with p-value, one should be familiar with the basics of statistics, particularly hypothesis testing. Hypothesis testing, which constitutes the core of application of statistics in research field, is a procedure in which a perception about phenomenon under investigation is tested for validity. The hypothesis which is tested is called the null hypothesis (H0) and it is considered the default hypothesis. The reader is referred to chapter of Hypothesis testing, however briefly we go through the steps of hypothesis testing for refreshment: Statement of Null hypothesis (h0) and alternative hypothesis (H1) Determination of the critical value or level of significance (α), commonly in biomedical researches is 0.05. Calculation of test statistic e.g.: calculated t (t cal) Comparison between the test statistic value and the critical value Making decision regarding the null hypothesis (rejection = significance, or fail to reject H0 = non significance) Put a conclusion regarding the phenomenon under investigation. Introduction: P-value is the level of significance at which the observed value of the test statistic (e.g. z, or t etc.) would just be significant, that is, would just fall into the critical region. In other words the whole or part of critical region could be p-value. It is a value indicates the possibility of doing an error; the error in this context is called type-I error or α- error. Type-I error is rejecting the null hypothesis when is true, in other words, it is the situation where there is no significance in reality and we sustain the significance. Often there is believe that p-value means probability, while the truth says that they are different things but they are related to each other. Myths and facts in regard with the p-value: Myths Facts P-value is a probability of an event It is the portability of an event plus probability of other events that have the same or less probabilities p-value means critical value α Not true, it is either equal/less than α in case of significance or more than α in case of insignificance. p-value is always a point value under the distribution curve Since it includes several probabilities it represents area of density under the distribution curve.
- 2. 2 Explanation: Say we flip a fair coin (mind that we claim a null hypothesis considering the coin is fair. Fair coin means that it has one face with head and the other face with tail, which means each two flips should result in 50% to 50% probability of getting heads and tails. If you get some think else such as to successive repetition of heads in several flips, that would mean something is not OK or an error… keep this in your mind! Back to the example, we were saying that if we flip a fair coin two times, in the first flip there will be 50% probability to get heads and 50% for tails. Again in the second flip there will be 50% probability for heads and 50% for tails. Figure shows that the probability of getting heads in both successive flips equals ¼= 25% and the probability of getting two tails is also 25%. On the other hand, the probability of getting heads and tails together (no matter the order) in the two successive flips equals 2/4 = 50%. What if we flip the coin 6 times, what would be the probability of getting heads in all 6 tosses? The probability would be 0.56 = 0.015625 and we will rethink about fairness of the coin, we would say that the coin is mostly unfair (the two face are heads) and we reject the null hypothesis with a confidence equals 1- 0.015625= 98.4375%. Compare this with the situation getting two heads or two tails from two flips where the confidence is 75% that is not enough to reject the null hypothesis! Instead of H meaning head assume it is one allele for a gene and T is the other allele for a gene. Consider a Mather is heterozygote for this gene possessing H and T (half by half) and dad also is heterozygote as well. So the outcomes of offspring after two pregnancies is the same as the example of flipping a coin two times.
- 3. 3 If the Mather is homozygote (HH) and the father is heterozygote (HT) so the probability for getting offspring with HH genotype is 50%, and the other 50% will go to HT while no probability for TT. Now, let us go back to the original situation where both parents are heterozygote, by now we learned the probability of HH. Lest define the p-value for HH. Definition of P-value: It is the probability that random chance generated the data (HH) or something else which is equal or rarer. So from this definition we can understand that P-value for a data is not only the probability of occurring that data only, it rather includes the probabilities of any data that have the same probability of occurrence or less. That is why p-value is an area under the curve not a point and it is written in text as P ≤ 0.05 in case of significance. P-value = probability of event (data) + any other equal probability in the data- set + any lesser probability in the data-set. In the example of the genotypes the P-value of HH consists of three parts: the probability of getting HH offspring genotype, the probability of getting TT offspring genotype, which is equal to the probability of HH, and the probability of any genotype which is rarer than HH. So p-value of HH = 0.25 + 0.25 + 0.0 = 0.5. Now, we can make out the P-value of HH that equals 50% is not the probability of HH which equals 25%. If we flip fair coin 6 time (26 = 64), there will be 64 outcomes as shown in the figure. Let us calculate the P-value of getting 6 head. As we know for the definition, P-value = probability of the event (6 heads) + probability of the events that equal or less than the probability of the event.
- 4. 4 Probability of 6 heads (HHHHHH) =1/64 or 0.56 = 0.015625 Probability of equal event 6 tails (TTTTTT) = 1/64 or 0.56 = 0.01562 Probability of events that are less = 0.0 (nothing less than 1 in this circumstance) So P-value of 6 heads = 0.01562 + 0.01562 = 0.03125 Statistically this finding means that the result is significance i.e. if we consider 0.05 is the critical point α, and we would reject the null hypothesis that says the coin is fair! Home work: Calculate: a) the p-value of getting 5 heads if you toss coin five times. b) Calculate the p- value of getting 4 heads and 1 tails. The answer will show that there is no statistical significance and you will fail to reject the null hypothesis in both (a) and (b)!