Download to read offline
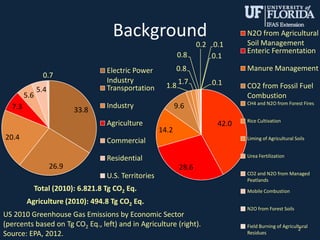
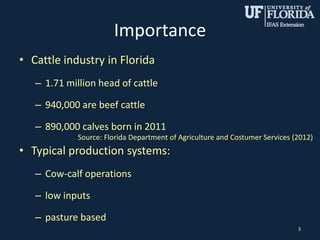
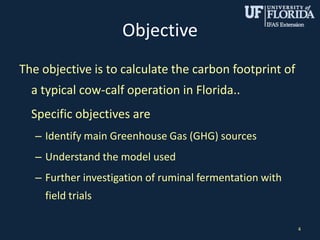
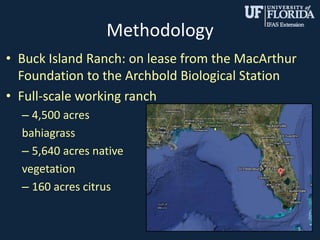
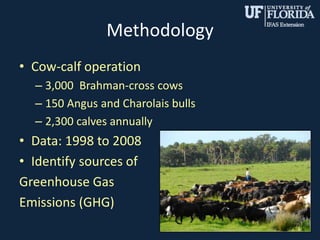
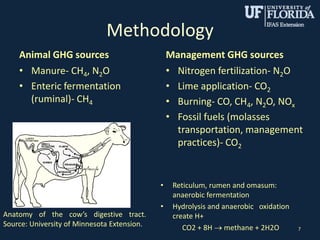
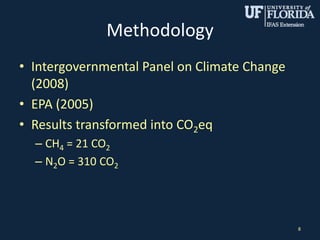
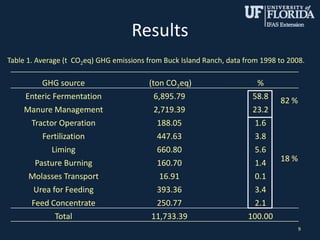
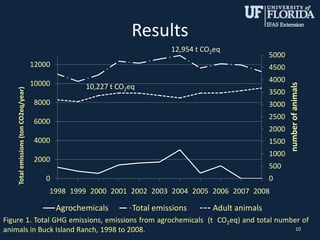

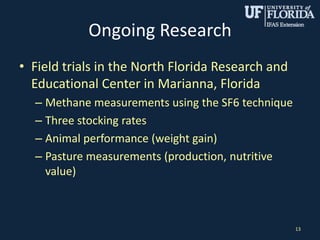
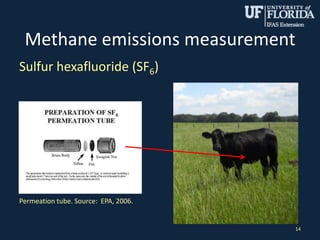
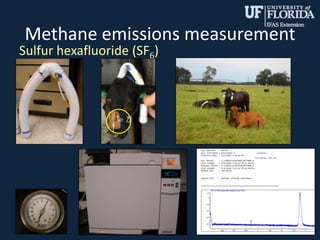
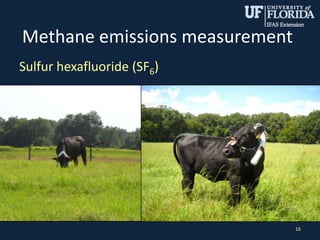
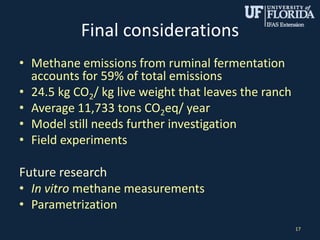

This study measured the greenhouse gas emissions from a typical cow-calf cattle operation in Florida over 10 years. The largest sources of emissions were enteric fermentation from digestion (59%) and manure management (23%). Total average annual emissions were 11,733 tons of CO2 equivalents. Ongoing research is further investigating methane emissions from cattle using sulfur hexafluoride tracer gas techniques under different grazing conditions.


![Livestock & greenhouse gas emission [autosaved]](https://cdn.slidesharecdn.com/ss_thumbnails/livestockgreenhousegasemissionautosaved-140520002100-phpapp02-thumbnail.jpg?width=640&height=640&fit=bounds)


