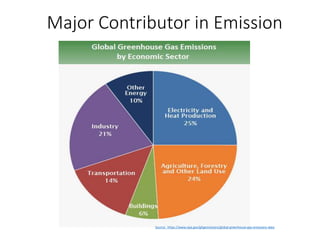
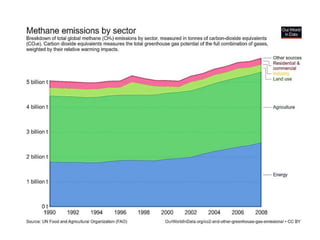
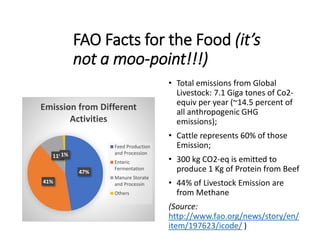
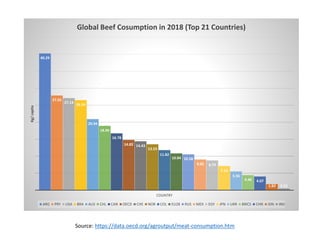
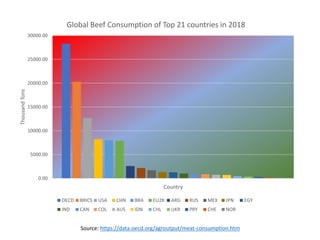
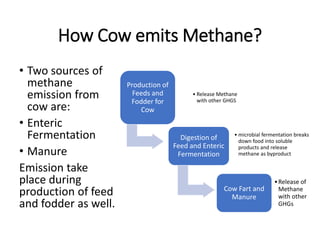
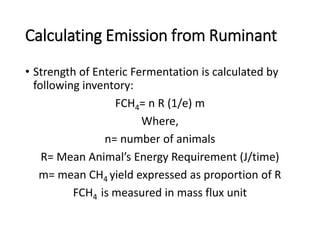
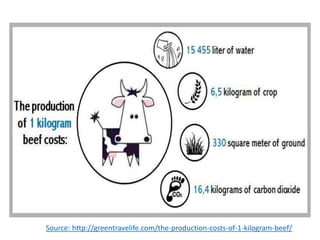
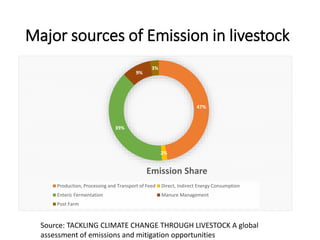
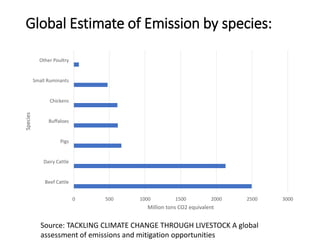
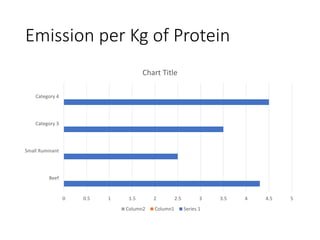
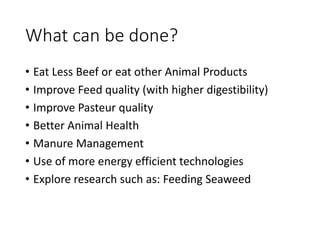
Beef: An
Inconvenient Truth
of Climate Change
By
Rahul Acharya
University of The District of Columbia
Climate
Change?
Climate change is a change in
usual weather of globe or region
for long time
Common phenomenon
includes:
• Increase temperature by Global
Warming
• Sea Level Rises
• Extreme Weather
• Shift in blooming of floral plants or
breeding patterns of Animals
• Loss of Ice Mass in Poles and
Mountains
Green
House
Gases
Traps Sun’s Heat
Create Green House Effect
Makes Earth Warmer or livable for us
Common Examples:
• Water Vapors
• Methane(CH4)
• Carbon dioxide (CO2)
• Chlorofluorocarbons
• Nitrous oxide (N2O)
Green House Gases are what made Earth
suitable for living organism.
They shouldn’t be considered evil gases!!!
IF GHGs occur naturally to
warm planet, what is this all
about ‘Climate Change’ and
‘Global Warming’.
Shouldn’t be our focus on
more ‘Real Issues’.
Human Induced
Climate Change
• Earth warmed by 1.5 °F since 1900
• 1 °F in since 1970
• All the warming since 1970 is
Human Induced
WHY? HOW?
• All this is because we emit GHGs
from our various activities
Who are the emitters? I don’t
want shortened winter.
Apparently YES
Major Contributor in Emission
Source: https://www.epa.gov/ghgemissions/global-greenhouse-gas-emissions-data
FAO Facts for the Food (it’s
not a moo-point!!!)
• Total emissions from Global
Livestock: 7.1 Giga tones of Co2-
equiv per year (~14.5 percent of
all anthropogenic GHG
emissions);
• Cattle represents 60% of those
Emission;
• 300 kg CO2-eq is emitted to
produce 1 Kg of Protein from Beef
• 44% of Livestock Emission are
from Methane
(Source:
http://www.fao.org/news/story/en/
item/197623/icode/ )
47%
41%
11%1%
Emission from Different
Activities
Feed Production
and Procession
Enteric
Fermentation
Manure Storate
and Processin
Others
Why I chose Beef?
Inspired by the Documentary
‘Cowspiracy’;
A Key Factor Many Climate Change
‘Activists’ miss out;
We do not talk enough of Beef;
Confess this, many did not even
know Beef was liable for Emission…
Global Beef
Production:
• In 2017, Global Beef Production was
66250349 tones and 304414858 heads of
Cattle;
• United States, Brazil, China and Argentina
are top four largest beef producing
countries with Beef production of 11.9,
9.55, 6.89 and 2.84 million tones
respectively.
(Fun Fact: Cow is National Animal of Nepal
and Beef is banned in the constitution. You
may end up in jail for years if found guilty of
slaughtering cows for meat.)
Sources:
http://www.fao.org/faostat/en/#data/QL
40.29
27.92
27.14
26.54
20.94
18.96
16.78
14.82 14.43
13.53
11.82
10.84 10.58
9.05 8.79
7.14
5.56
4.46 4.07
1.83 0.52
COUNTRY
Kg/capita
Global Beef Cosumption in 2018 (Top 21 Countries)
ARG PRY USA BRA AUS CHL CAN OECD CHE NOR COL EU28 RUS MEX EGY JPN UKR BRICS CHN IDN IND
Source: https://data.oecd.org/agroutput/meat-consumption.htm
Wassup Bruh!
What you doing? Just
warming
the globe!
0.00
5000.00
10000.00
15000.00
20000.00
25000.00
30000.00
ThousandTons
Country
Global Beef Consumption of Top 21 countries in 2018
OECD BRICS USA CHN BRA EU28 ARG RUS MEX JPN EGY
IND CAN COL AUS IDN CHL UKR PRY CHE NOR
Source: https://data.oecd.org/agroutput/meat-consumption.htm
How Cow emits Methane?
• Two sources of
methane
emission from
cow are:
• Enteric
Fermentation
• Manure
Emission take
place during
production of feed
and fodder as well.
Production of
Feeds and
Fodder for
Cow
• Release Methane
with other GHGS
Digestion of
Feed and Enteric
Fermentation
• microbial fermentation breaks
down food into soluble
products and release
methane as byproduct
Cow Fart and
Manure
•Release of
Methane
with other
GHGs
Calculating Emission from Ruminant
• Strength of Enteric Fermentation is calculated by
following inventory:
FCH4= n R (1/e) m
Where,
n= number of animals
R= Mean Animal’s Energy Requirement (J/time)
m= mean CH4 yield expressed as proportion of R
FCH4 is measured in mass flux unit
Source: http://greentravelife.com/the-production-costs-of-1-kilogram-beef/
Major sources of Emission in livestock
47%
2%
39%
9%
3%
Emission Share
Production, Processing and Transport of Feed Direct, Indirect Energy Consumption
Enteric Fermentation Manure Management
Post Farm
Source: TACKLING CLIMATE CHANGE THROUGH LIVESTOCK A global
assessment of emissions and mitigation opportunities
Global Estimate of Emission by species:
0 500 1000 1500 2000 2500 3000
Beef Cattle
Dairy Cattle
Pigs
Buffaloes
Chickens
Small Ruminants
Other Poultry
Million tons CO2 equivalent
Species
Source: TACKLING CLIMATE CHANGE THROUGH LIVESTOCK A global
assessment of emissions and mitigation opportunities
Emission per Kg of Protein
0 0.5 1 1.5 2 2.5 3 3.5 4 4.5 5
Beef
Small Ruminant
Category 3
Category 4
Chart Title
Column2 Column1 Series 1
What can be done?
• Eat Less Beef or eat other Animal Products
• Improve Feed quality (with higher digestibility)
• Improve Pasteur quality
• Better Animal Health
• Manure Management
• Use of more energy efficient technologies
• Explore research such as: Feeding Seaweed
THANK YOU

Climate change and beef/cattle Production

  • 1.
    Beef: An Inconvenient Truth ofClimate Change By Rahul Acharya University of The District of Columbia
  • 2.
    Climate Change? Climate change isa change in usual weather of globe or region for long time Common phenomenon includes: • Increase temperature by Global Warming • Sea Level Rises • Extreme Weather • Shift in blooming of floral plants or breeding patterns of Animals • Loss of Ice Mass in Poles and Mountains
  • 3.
    Green House Gases Traps Sun’s Heat CreateGreen House Effect Makes Earth Warmer or livable for us Common Examples: • Water Vapors • Methane(CH4) • Carbon dioxide (CO2) • Chlorofluorocarbons • Nitrous oxide (N2O)
  • 4.
    Green House Gasesare what made Earth suitable for living organism. They shouldn’t be considered evil gases!!!
  • 5.
    IF GHGs occurnaturally to warm planet, what is this all about ‘Climate Change’ and ‘Global Warming’. Shouldn’t be our focus on more ‘Real Issues’.
  • 6.
    Human Induced Climate Change •Earth warmed by 1.5 °F since 1900 • 1 °F in since 1970 • All the warming since 1970 is Human Induced WHY? HOW? • All this is because we emit GHGs from our various activities Who are the emitters? I don’t want shortened winter.
  • 7.
  • 8.
    Major Contributor inEmission Source: https://www.epa.gov/ghgemissions/global-greenhouse-gas-emissions-data
  • 10.
    FAO Facts forthe Food (it’s not a moo-point!!!) • Total emissions from Global Livestock: 7.1 Giga tones of Co2- equiv per year (~14.5 percent of all anthropogenic GHG emissions); • Cattle represents 60% of those Emission; • 300 kg CO2-eq is emitted to produce 1 Kg of Protein from Beef • 44% of Livestock Emission are from Methane (Source: http://www.fao.org/news/story/en/ item/197623/icode/ ) 47% 41% 11%1% Emission from Different Activities Feed Production and Procession Enteric Fermentation Manure Storate and Processin Others
  • 11.
    Why I choseBeef? Inspired by the Documentary ‘Cowspiracy’; A Key Factor Many Climate Change ‘Activists’ miss out; We do not talk enough of Beef; Confess this, many did not even know Beef was liable for Emission…
  • 13.
    Global Beef Production: • In2017, Global Beef Production was 66250349 tones and 304414858 heads of Cattle; • United States, Brazil, China and Argentina are top four largest beef producing countries with Beef production of 11.9, 9.55, 6.89 and 2.84 million tones respectively. (Fun Fact: Cow is National Animal of Nepal and Beef is banned in the constitution. You may end up in jail for years if found guilty of slaughtering cows for meat.) Sources: http://www.fao.org/faostat/en/#data/QL
  • 14.
    40.29 27.92 27.14 26.54 20.94 18.96 16.78 14.82 14.43 13.53 11.82 10.84 10.58 9.058.79 7.14 5.56 4.46 4.07 1.83 0.52 COUNTRY Kg/capita Global Beef Cosumption in 2018 (Top 21 Countries) ARG PRY USA BRA AUS CHL CAN OECD CHE NOR COL EU28 RUS MEX EGY JPN UKR BRICS CHN IDN IND Source: https://data.oecd.org/agroutput/meat-consumption.htm
  • 15.
    Wassup Bruh! What youdoing? Just warming the globe!
  • 16.
    0.00 5000.00 10000.00 15000.00 20000.00 25000.00 30000.00 ThousandTons Country Global Beef Consumptionof Top 21 countries in 2018 OECD BRICS USA CHN BRA EU28 ARG RUS MEX JPN EGY IND CAN COL AUS IDN CHL UKR PRY CHE NOR Source: https://data.oecd.org/agroutput/meat-consumption.htm
  • 17.
    How Cow emitsMethane? • Two sources of methane emission from cow are: • Enteric Fermentation • Manure Emission take place during production of feed and fodder as well. Production of Feeds and Fodder for Cow • Release Methane with other GHGS Digestion of Feed and Enteric Fermentation • microbial fermentation breaks down food into soluble products and release methane as byproduct Cow Fart and Manure •Release of Methane with other GHGs
  • 18.
    Calculating Emission fromRuminant • Strength of Enteric Fermentation is calculated by following inventory: FCH4= n R (1/e) m Where, n= number of animals R= Mean Animal’s Energy Requirement (J/time) m= mean CH4 yield expressed as proportion of R FCH4 is measured in mass flux unit
  • 19.
  • 20.
    Major sources ofEmission in livestock 47% 2% 39% 9% 3% Emission Share Production, Processing and Transport of Feed Direct, Indirect Energy Consumption Enteric Fermentation Manure Management Post Farm Source: TACKLING CLIMATE CHANGE THROUGH LIVESTOCK A global assessment of emissions and mitigation opportunities
  • 21.
    Global Estimate ofEmission by species: 0 500 1000 1500 2000 2500 3000 Beef Cattle Dairy Cattle Pigs Buffaloes Chickens Small Ruminants Other Poultry Million tons CO2 equivalent Species Source: TACKLING CLIMATE CHANGE THROUGH LIVESTOCK A global assessment of emissions and mitigation opportunities
  • 22.
    Emission per Kgof Protein 0 0.5 1 1.5 2 2.5 3 3.5 4 4.5 5 Beef Small Ruminant Category 3 Category 4 Chart Title Column2 Column1 Series 1
  • 30.
    What can bedone? • Eat Less Beef or eat other Animal Products • Improve Feed quality (with higher digestibility) • Improve Pasteur quality • Better Animal Health • Manure Management • Use of more energy efficient technologies • Explore research such as: Feeding Seaweed
  • 31.