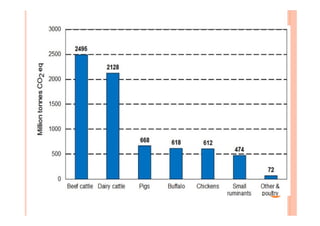
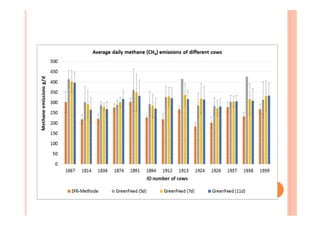
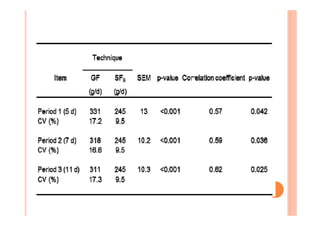
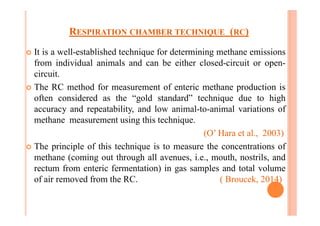
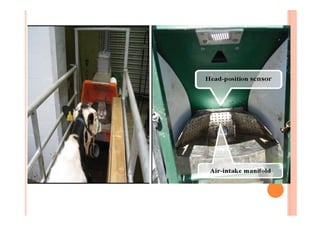
This document provides an overview of enteric methane production in ruminants and techniques for measuring methane emissions. It discusses how methane is produced in the rumen and hindgut of ruminants as a byproduct of microbial fermentation. The document summarizes several techniques used to measure methane emissions, including respiration chambers, sulfur hexafluoride tracer, and the GreenFeed system. It provides details on how the GreenFeed system works and factors that can influence methane measurements using this technique, such as animal visitation patterns and head movement during measurements.


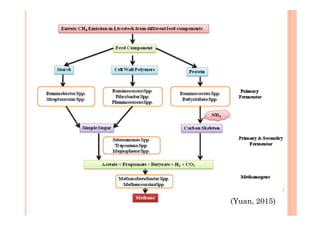
![METHANOGENESIS
¢ The primary source of methane is digestive fermentation in the
rumen, which is released by eructation and exhalation.
(Murray et al., 1976)
¢ Bacterial conversion of methanogenic substrates [acetate,
formate, H2, CO2] into methane and carbon dioxide.
(Leverenz , 2002)
¢ Rumen is the predominant site of methane production (87-94%
of total production) and 6-13% derived from hindgut
fermentation.
(Torrent and Johnson, 1994)
¢ Routes of total methane release were eructation (83%),
exhalation (16%) and flatulence (1%).
(Murray et al., 1976)](https://image.slidesharecdn.com/greenfeedinmethanemitigation-200701065315/85/Green-feed-in-methane-mitigation-muneendra-kumar-4-320.jpg)


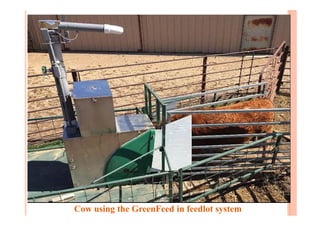


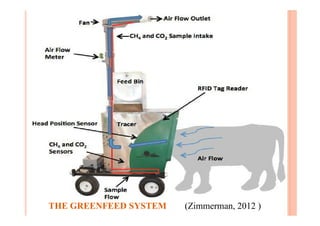
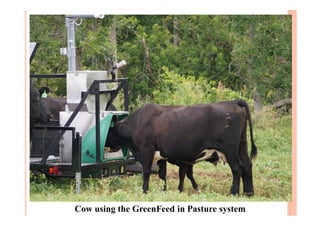
![How the GreenFeed System Works
¢ Cows visit GreenFeed for controlled pellet release
¢ Pellets dropped at intervals so cows head is in hood for 3-7 min
¢ Air is drawn past the cow in the hood; flow is measured and
[CH4] and [CO2] with O2 and H2 also options
¢ Analysis of gas flux includes adjustments for background
concentrations, head position, etc.
¢ The system is calibrated and drift checked
¢ The operator can (remotely) control the system
¢ Data includes g CH4/d estimated for each 3-7 min, records time
of visits, etc.](https://image.slidesharecdn.com/greenfeedinmethanemitigation-200701065315/85/Green-feed-in-methane-mitigation-muneendra-kumar-28-320.jpg)