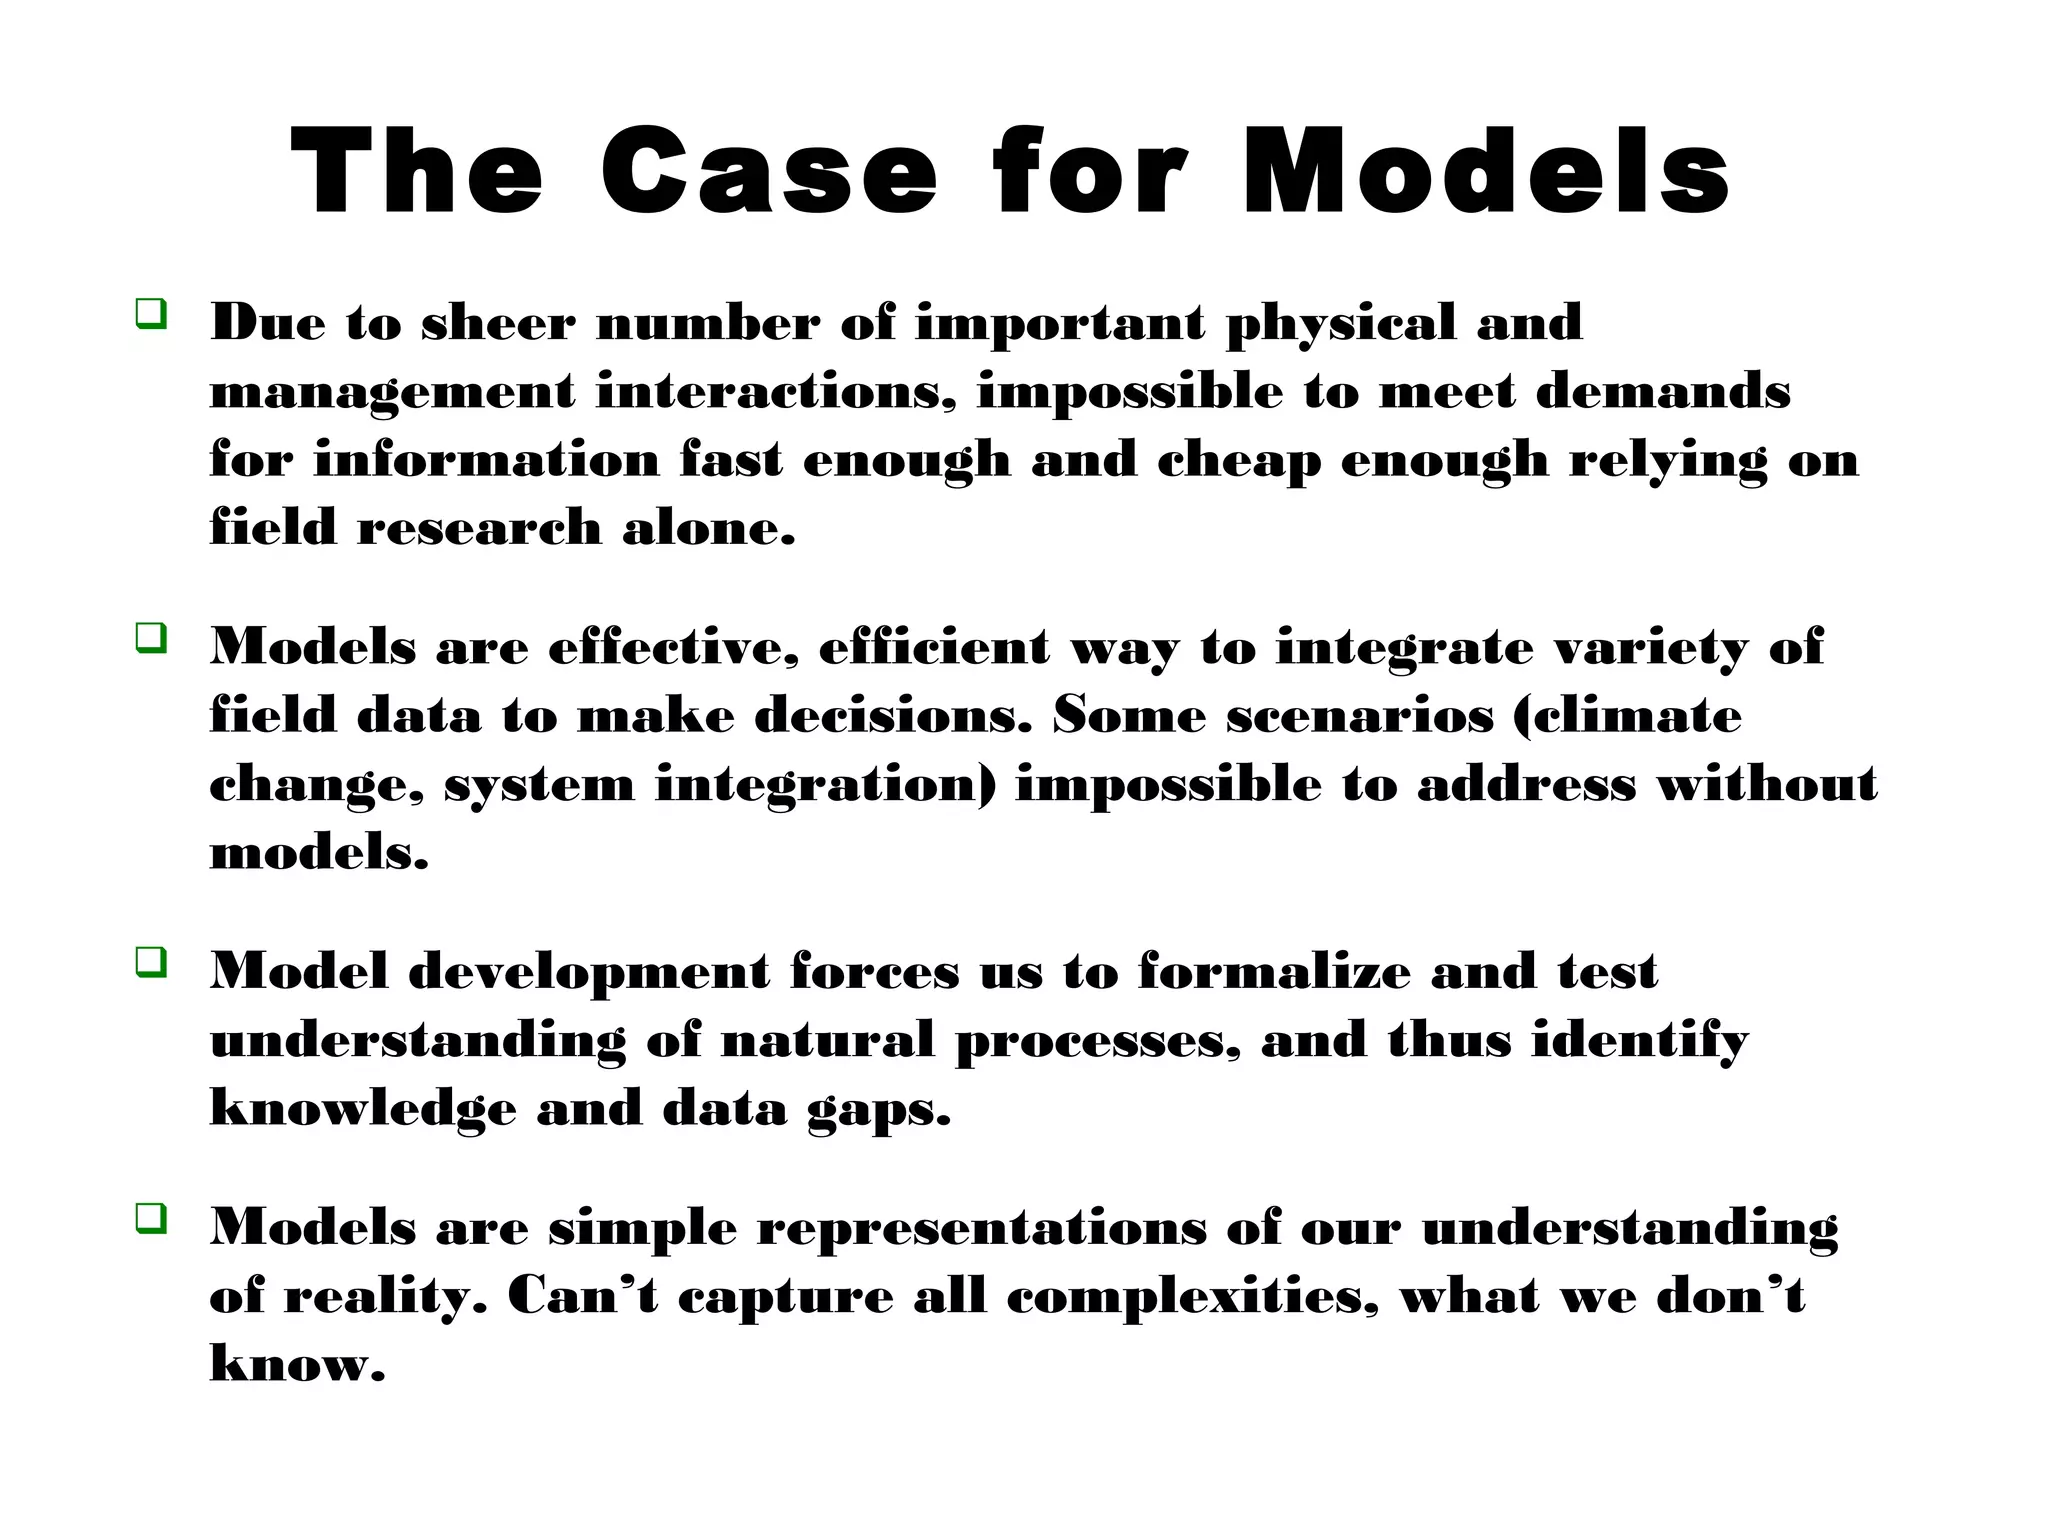
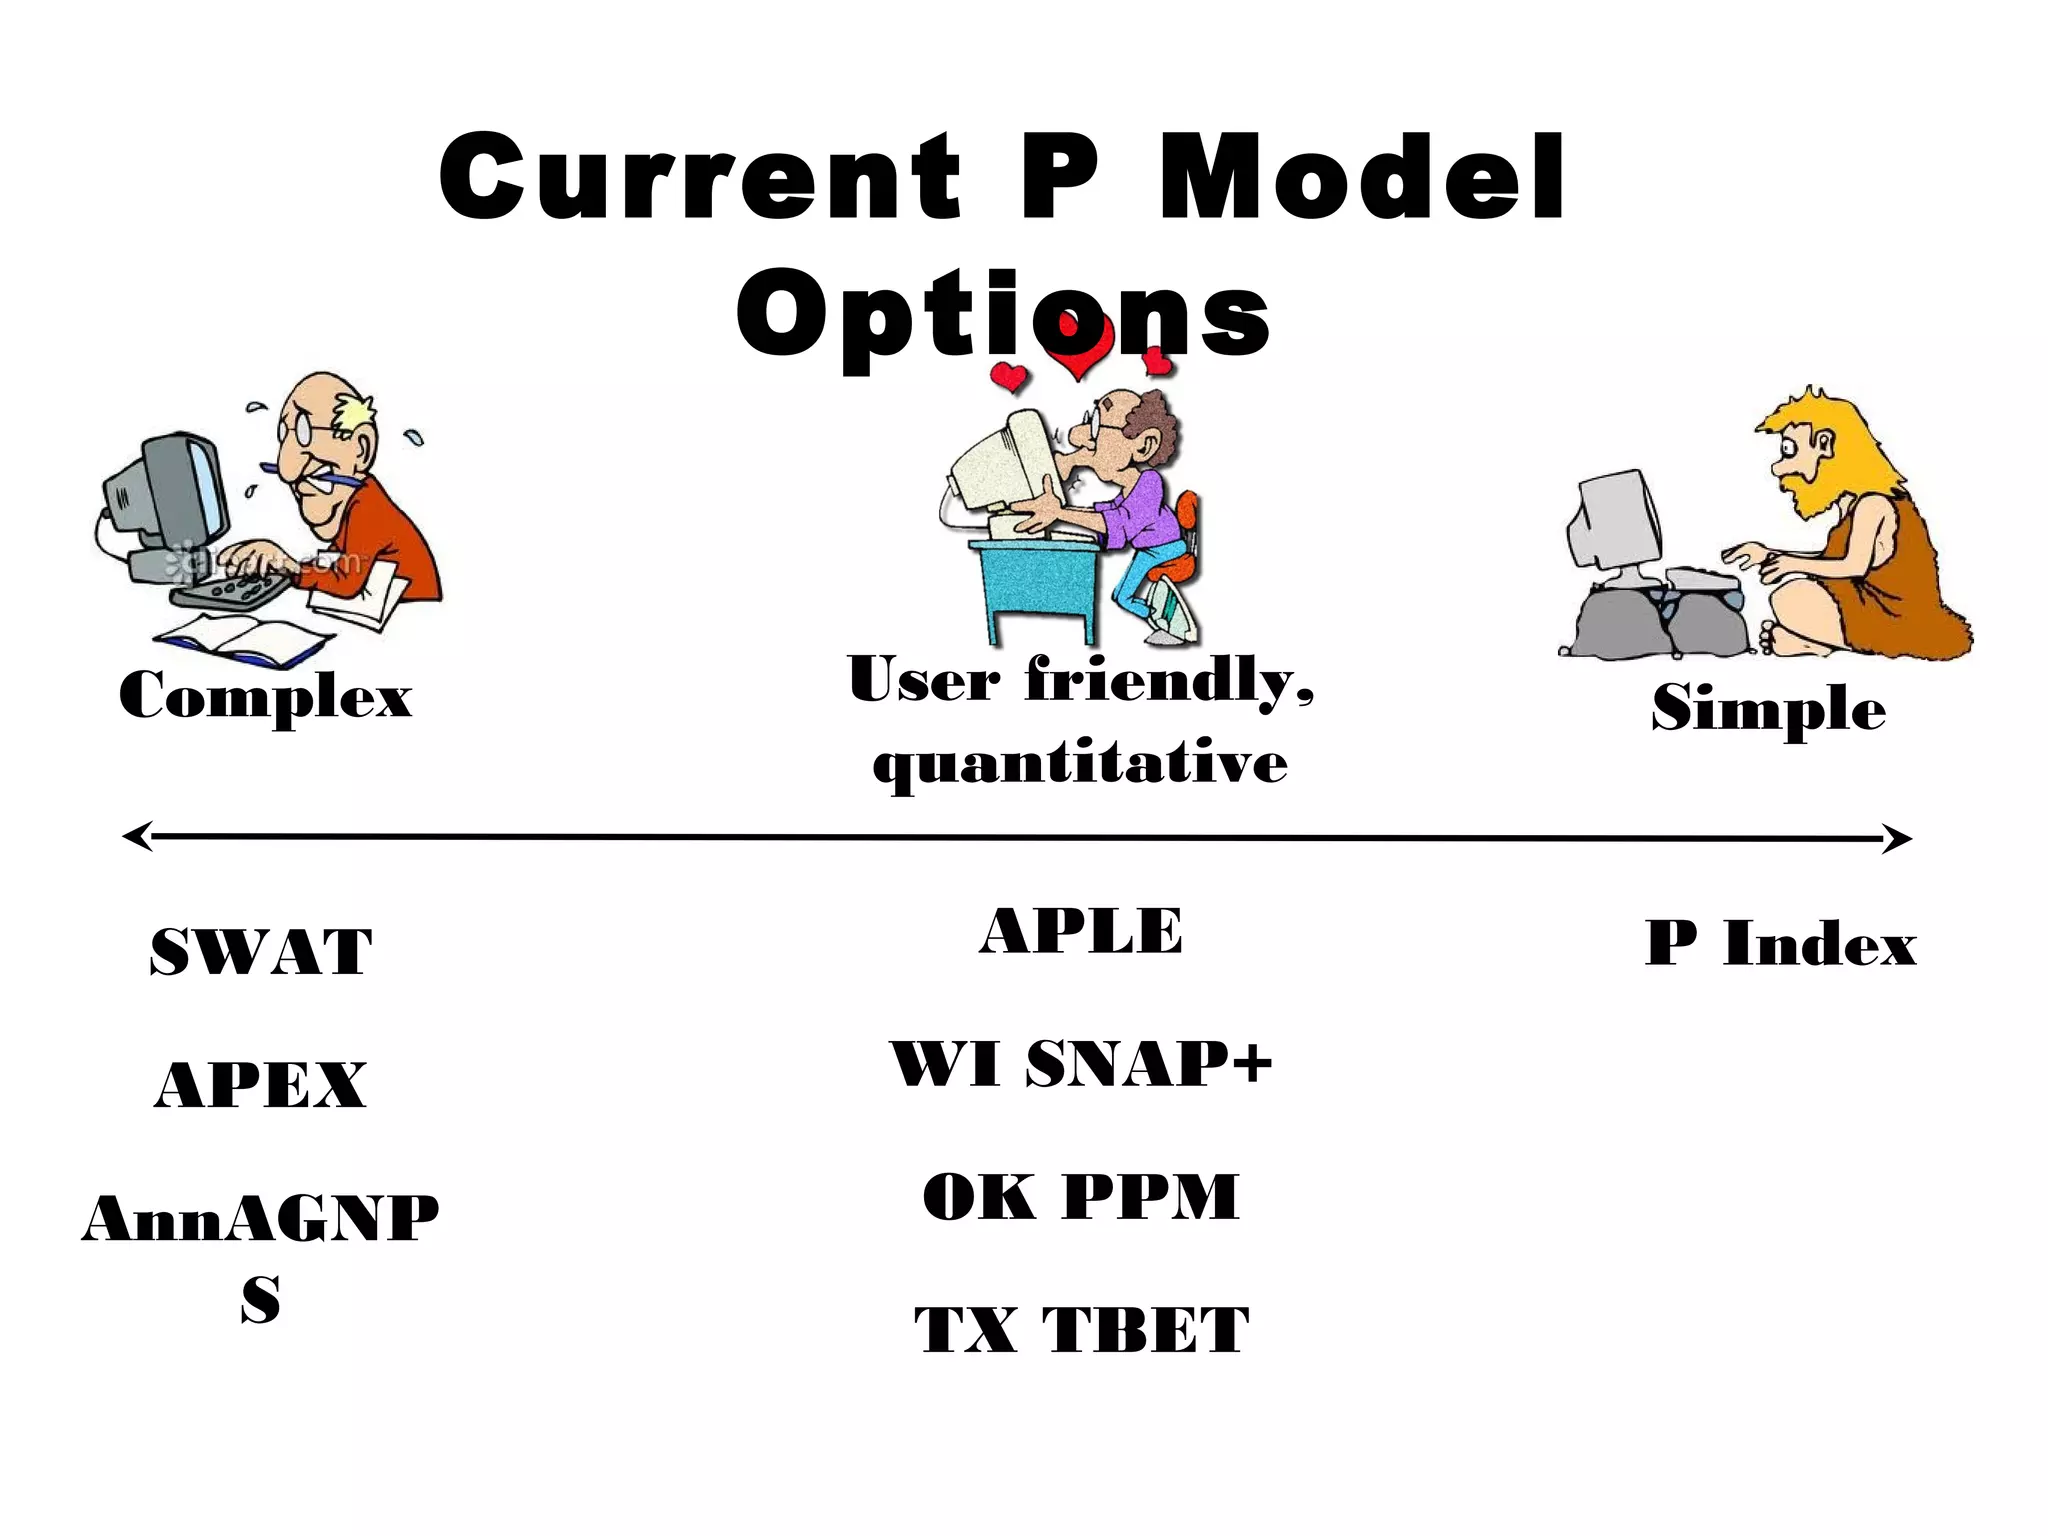
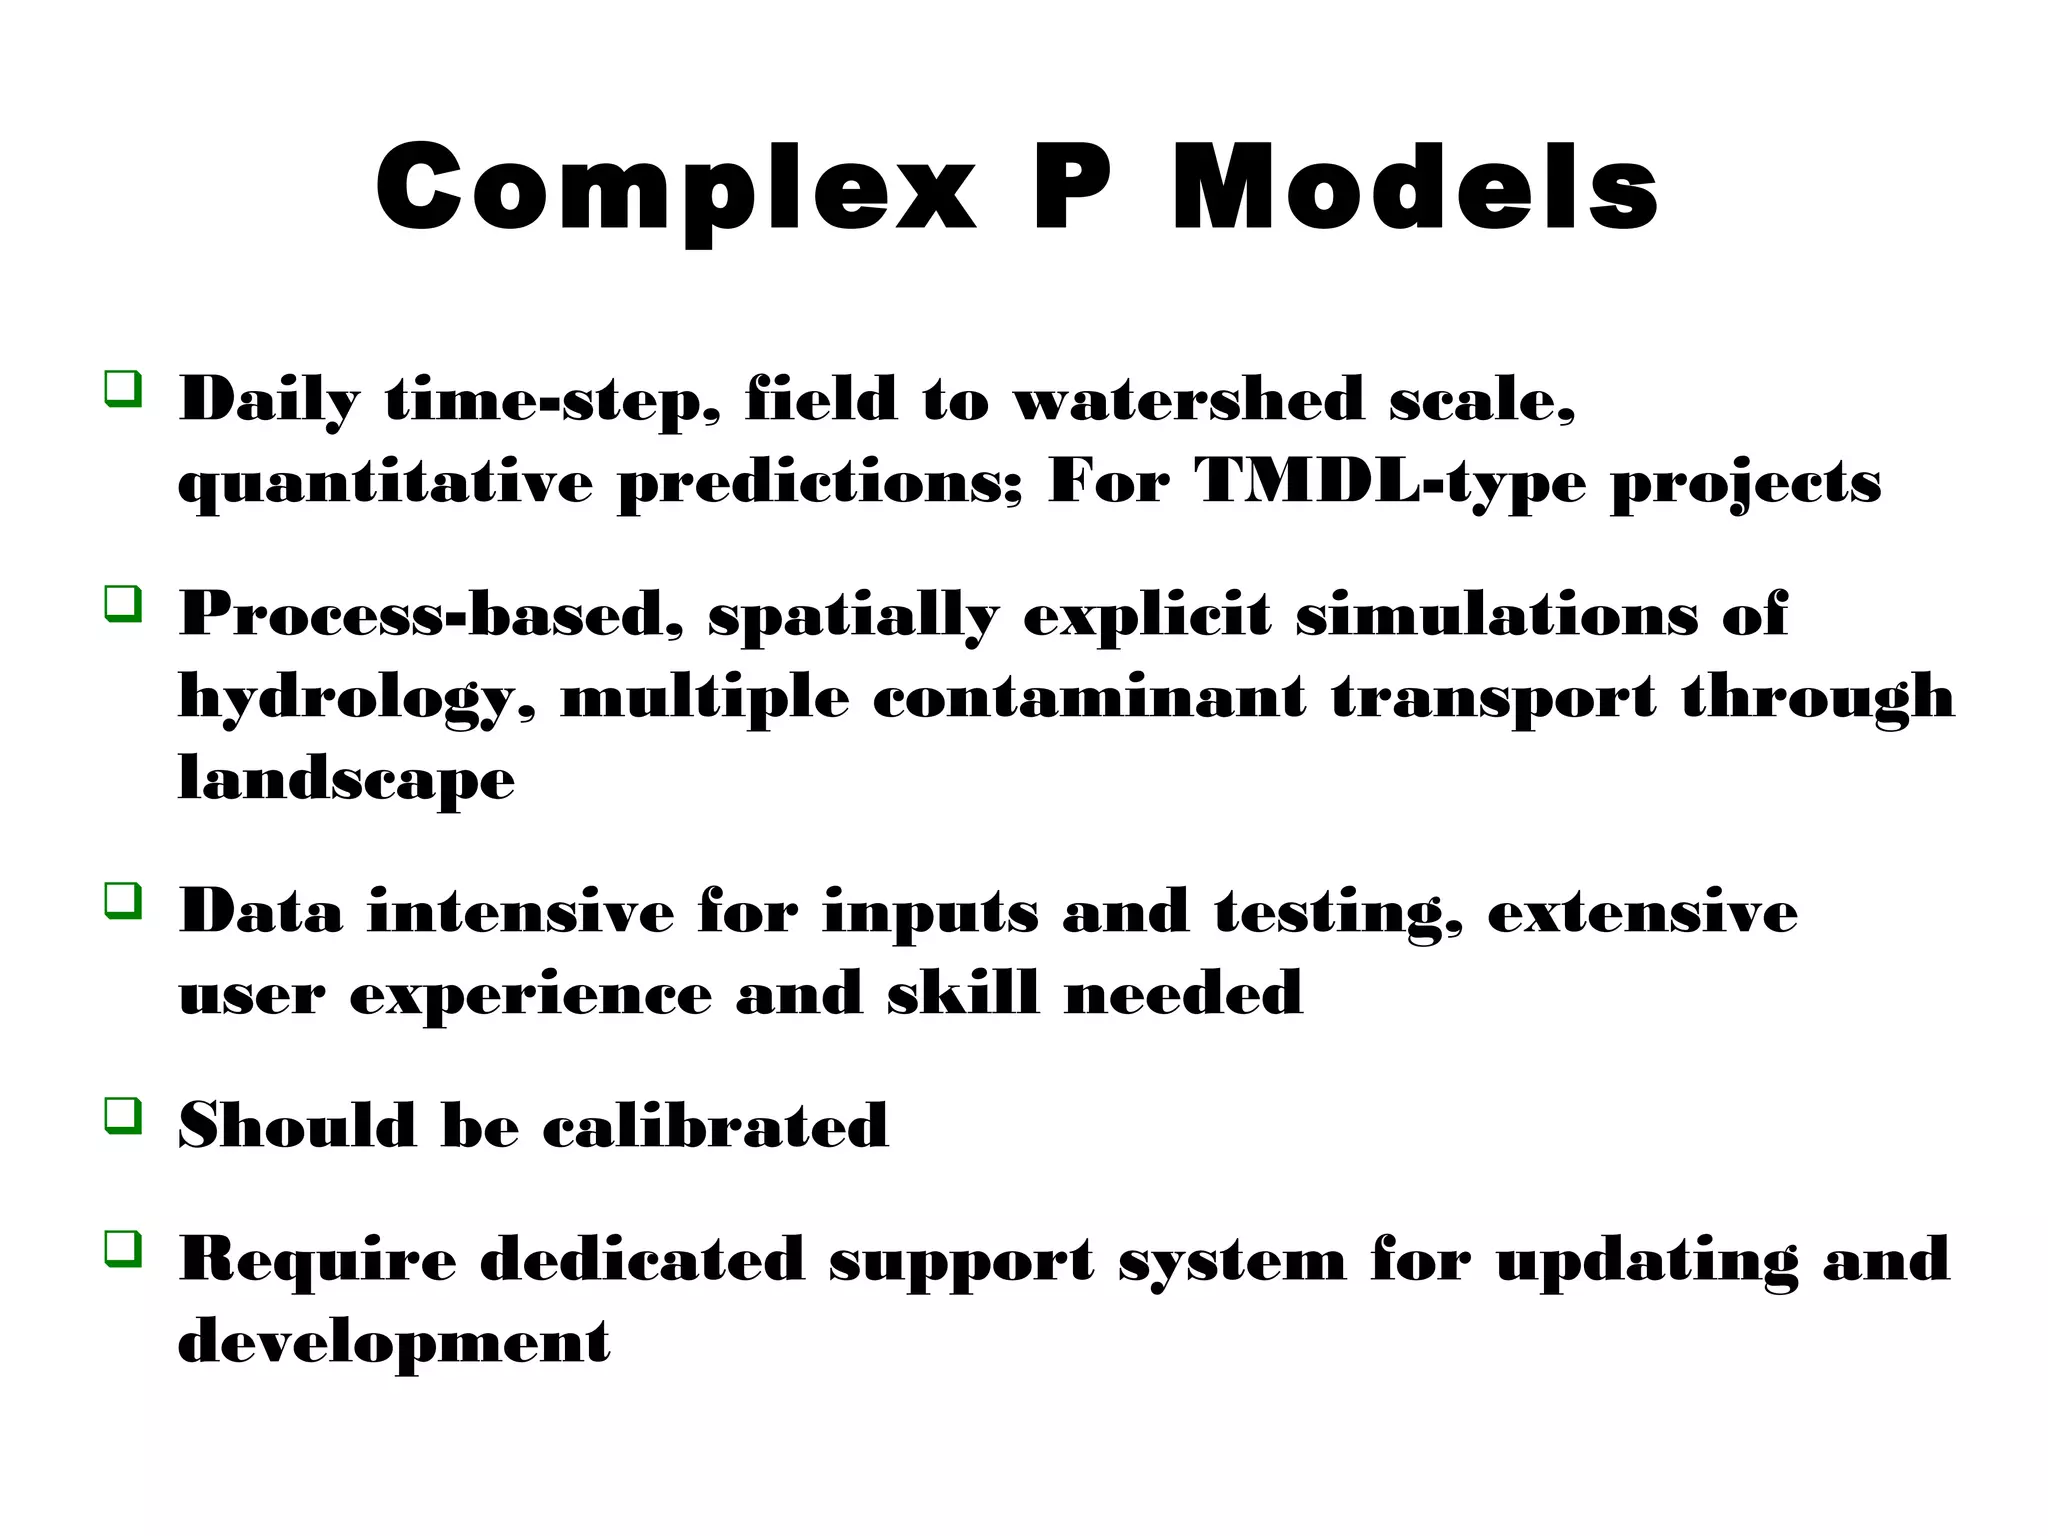
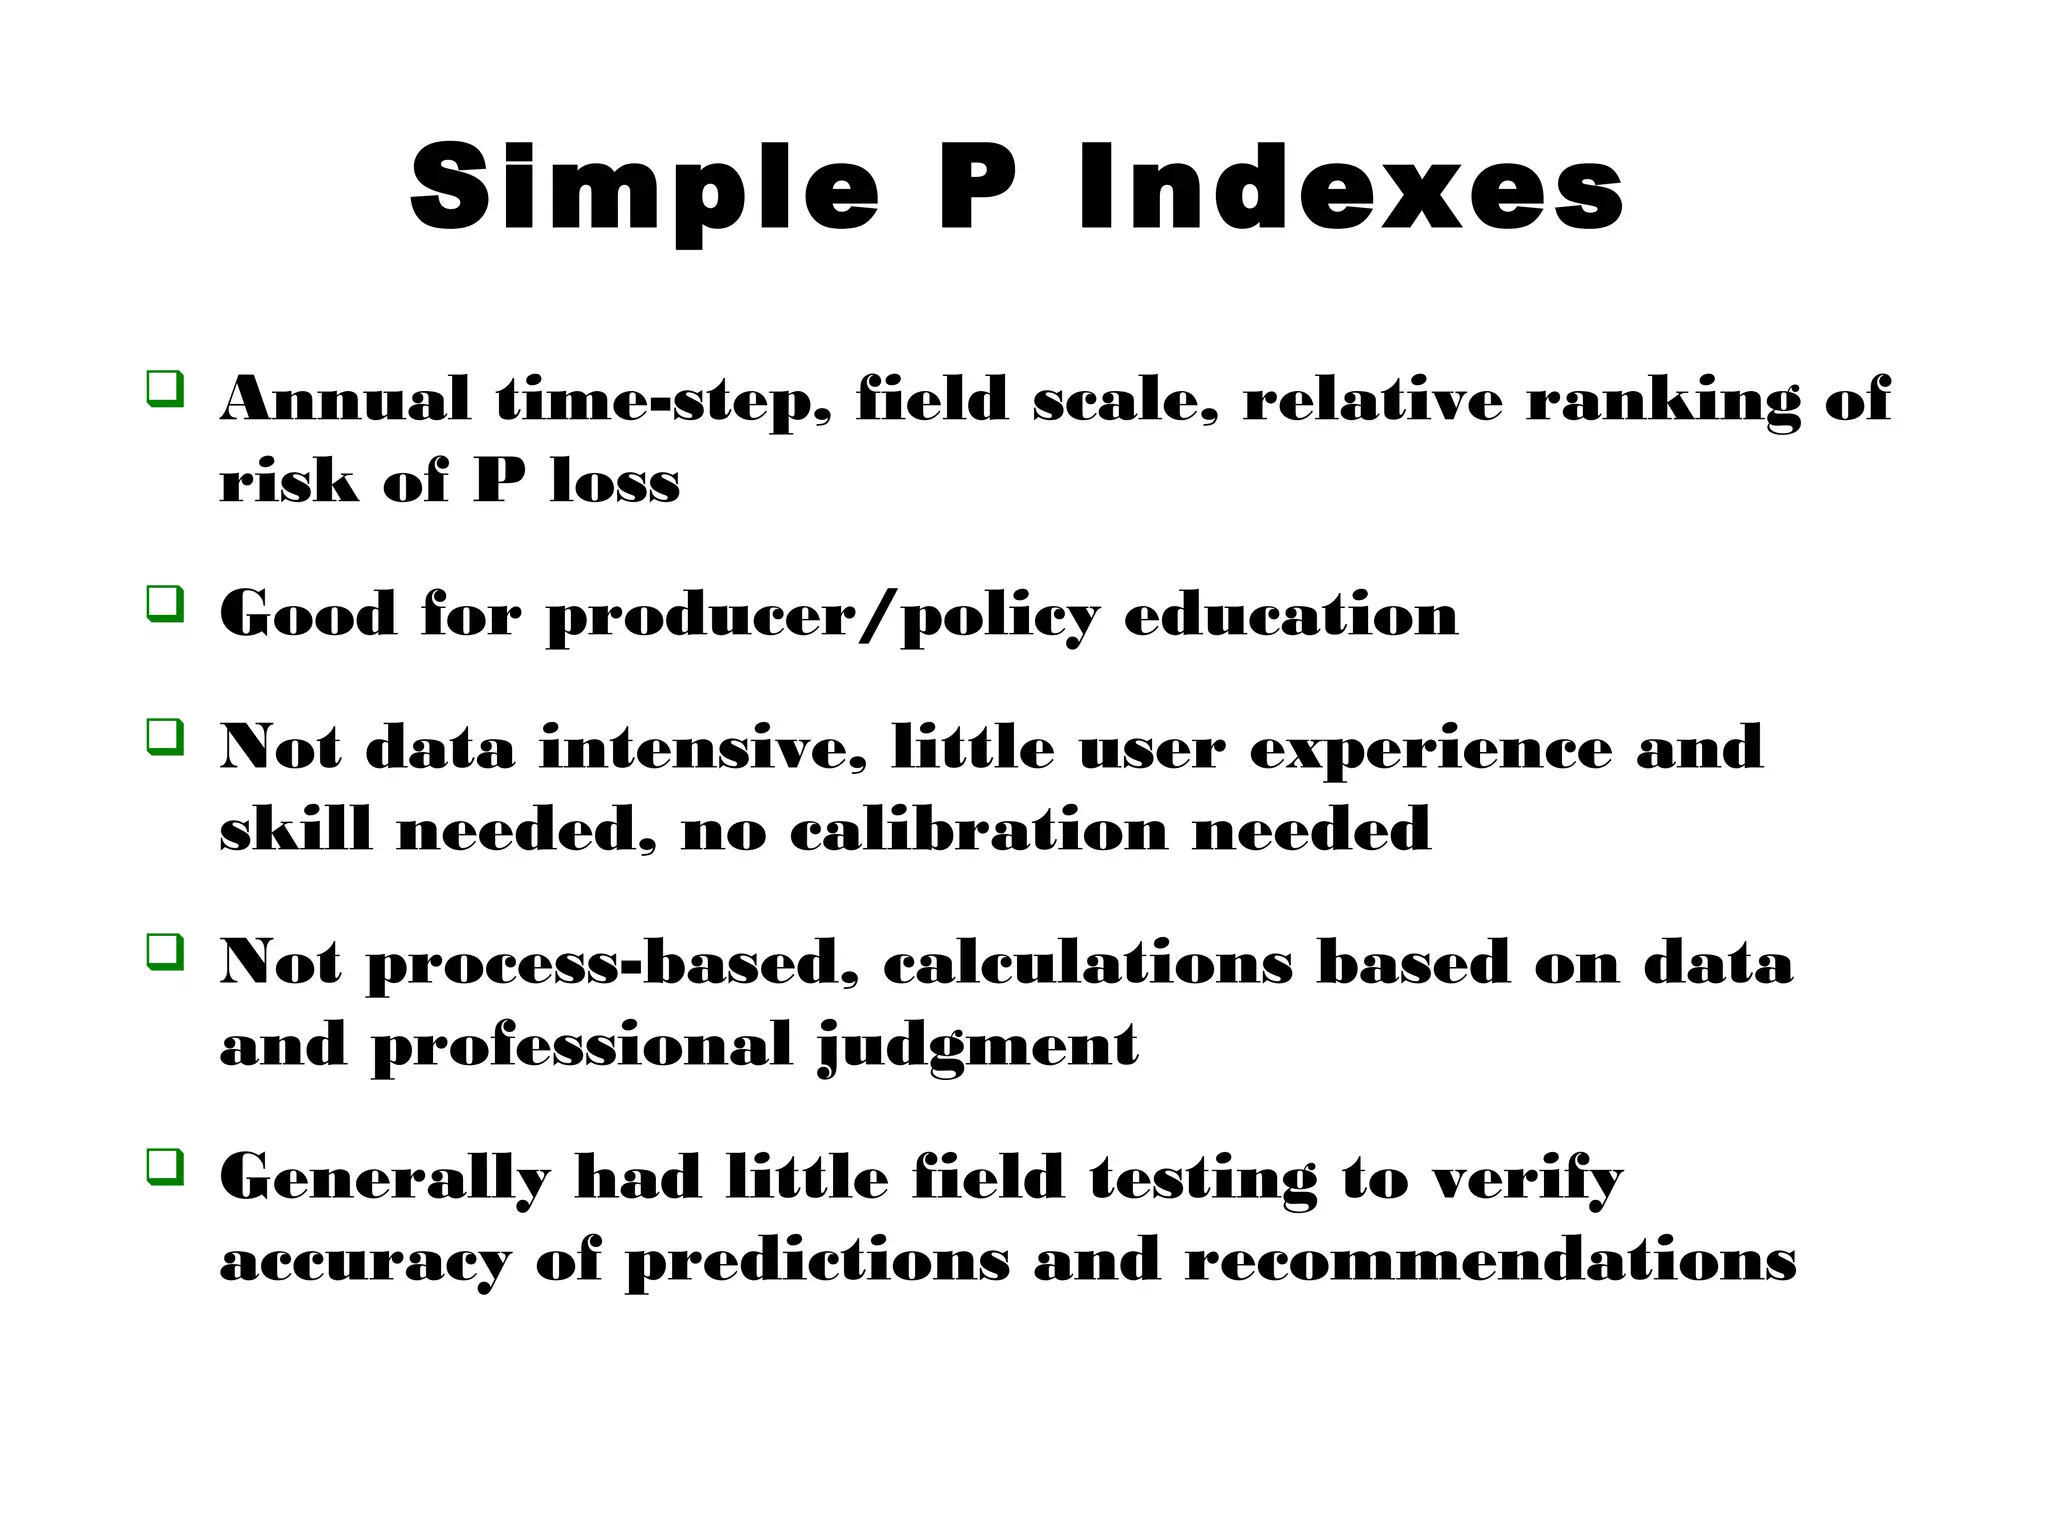
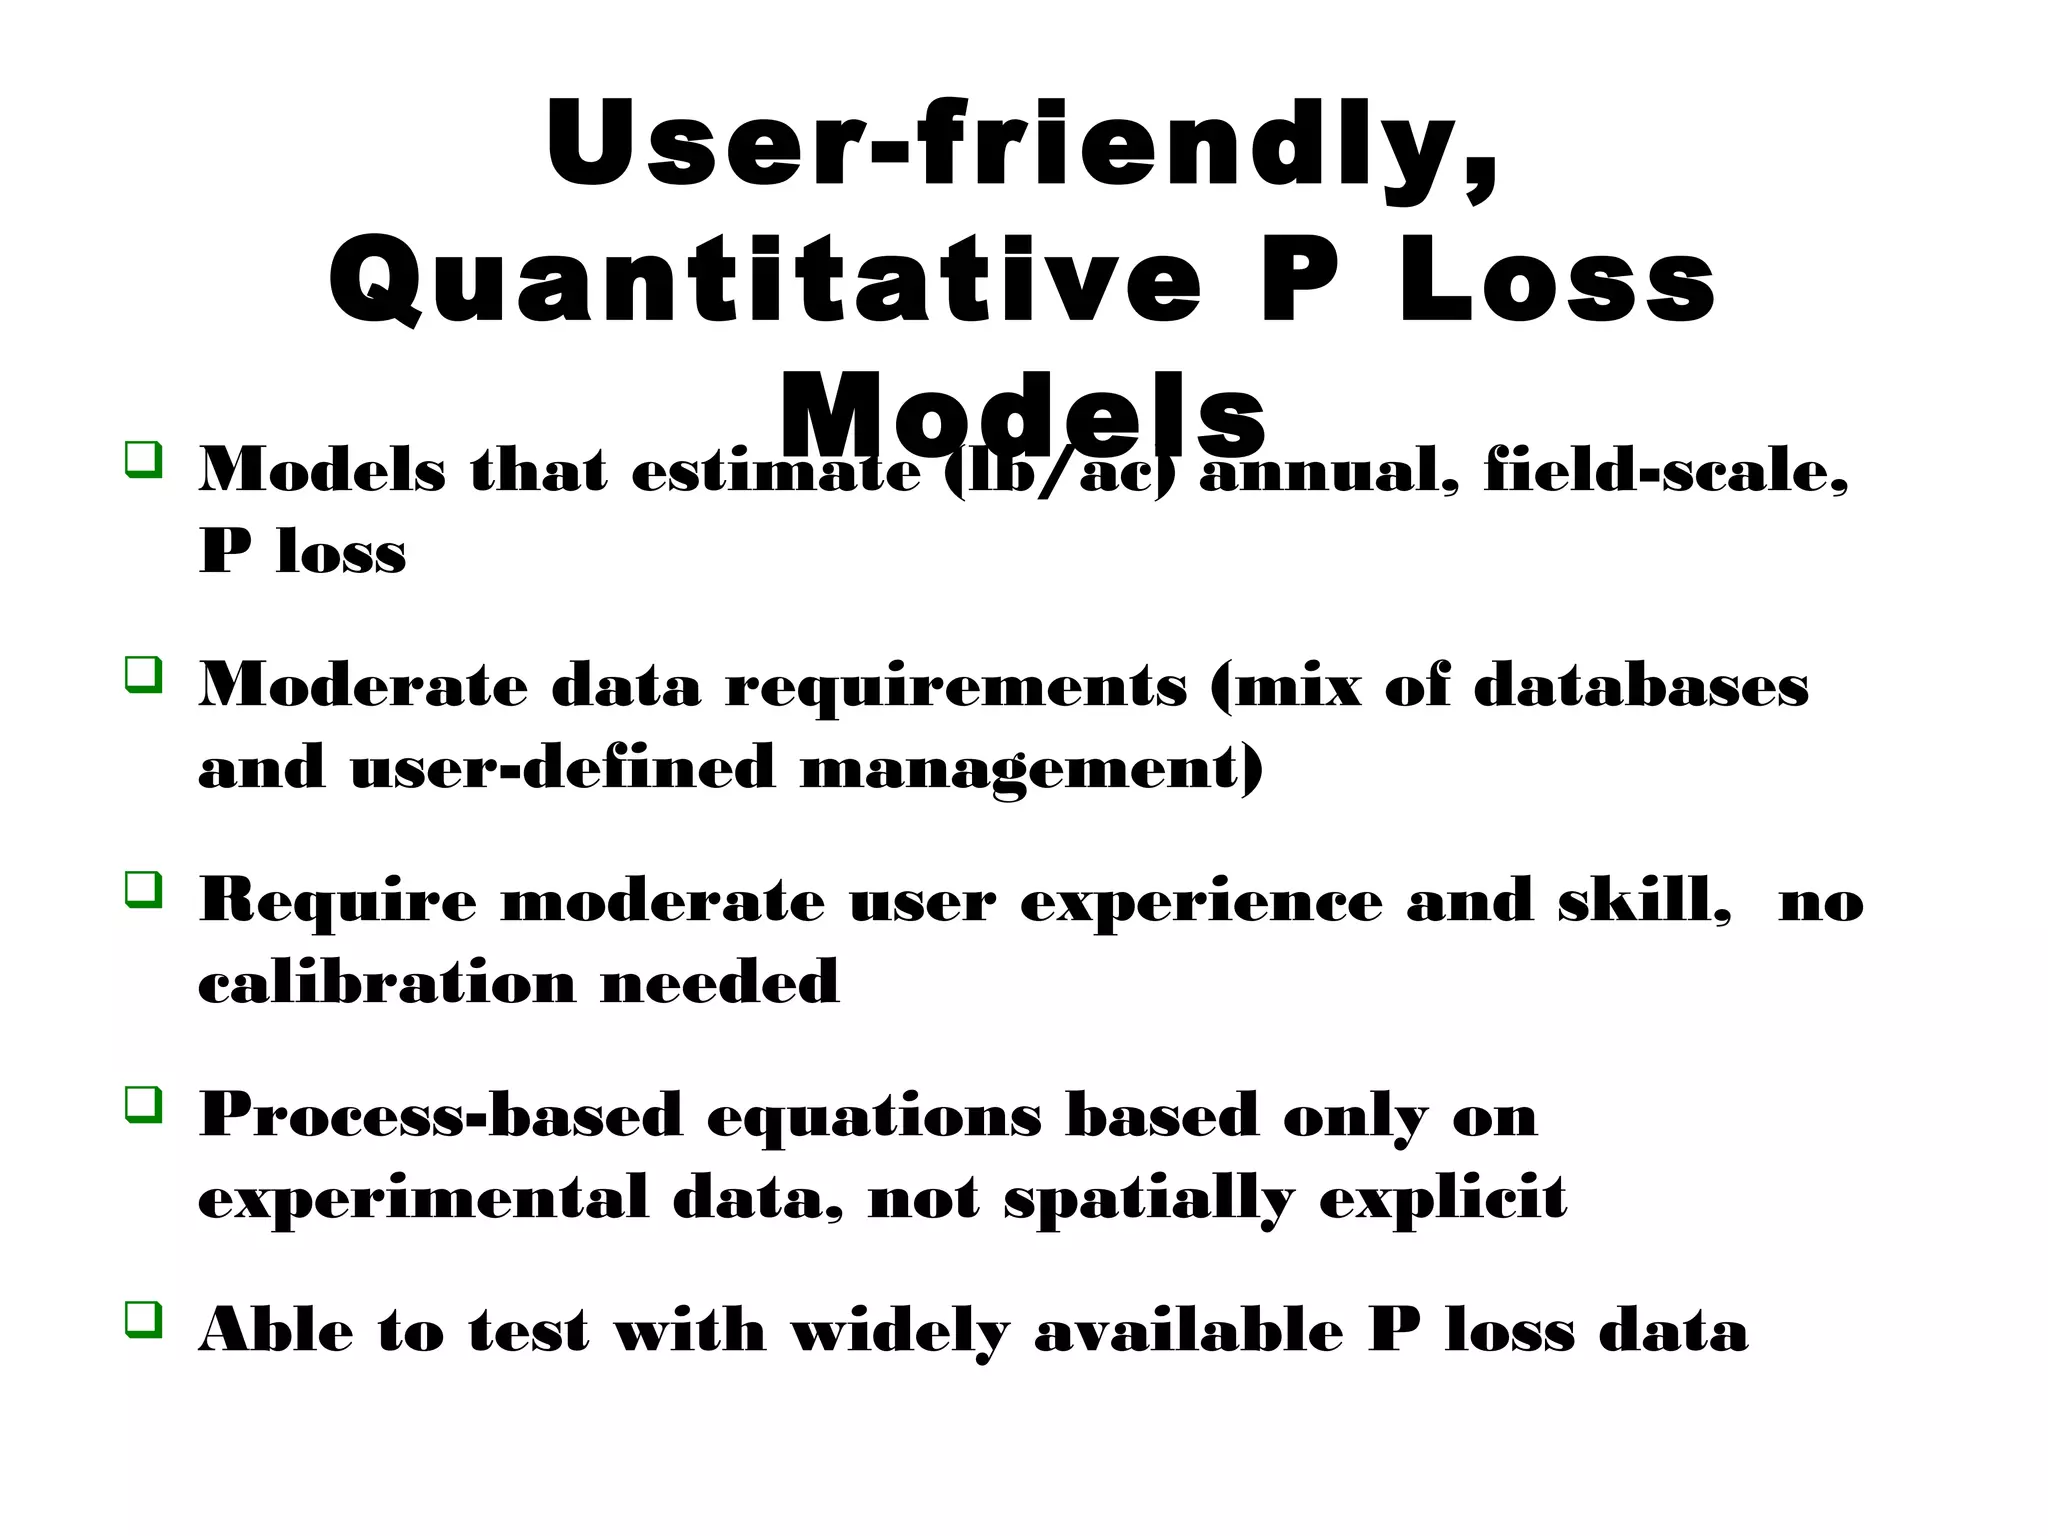
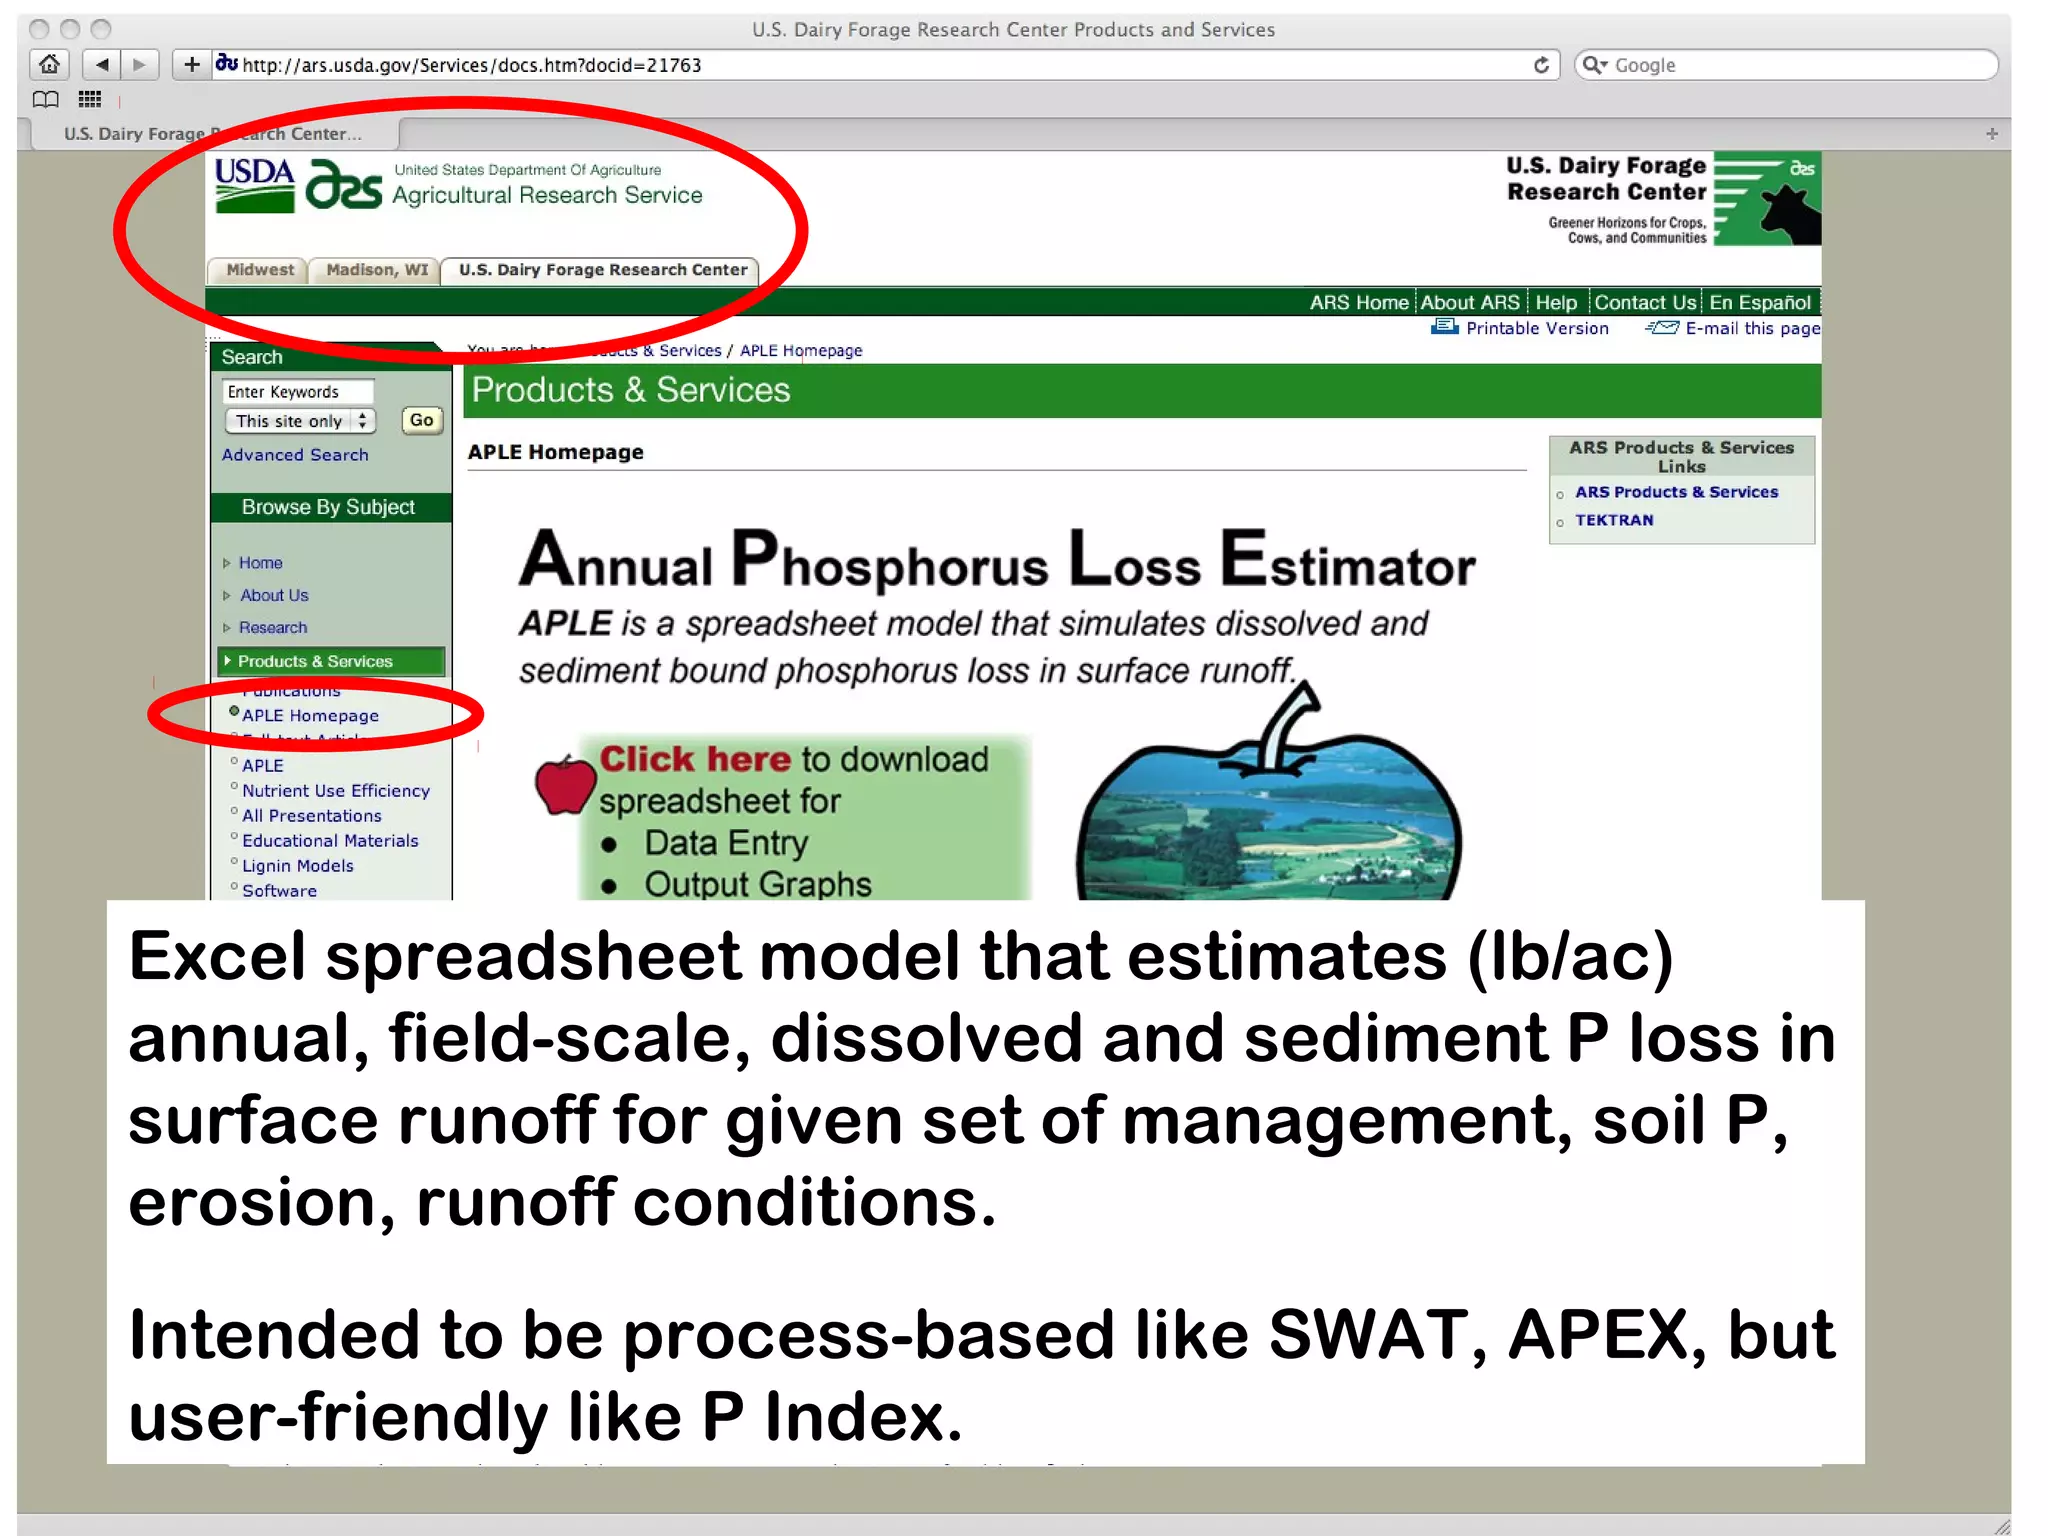
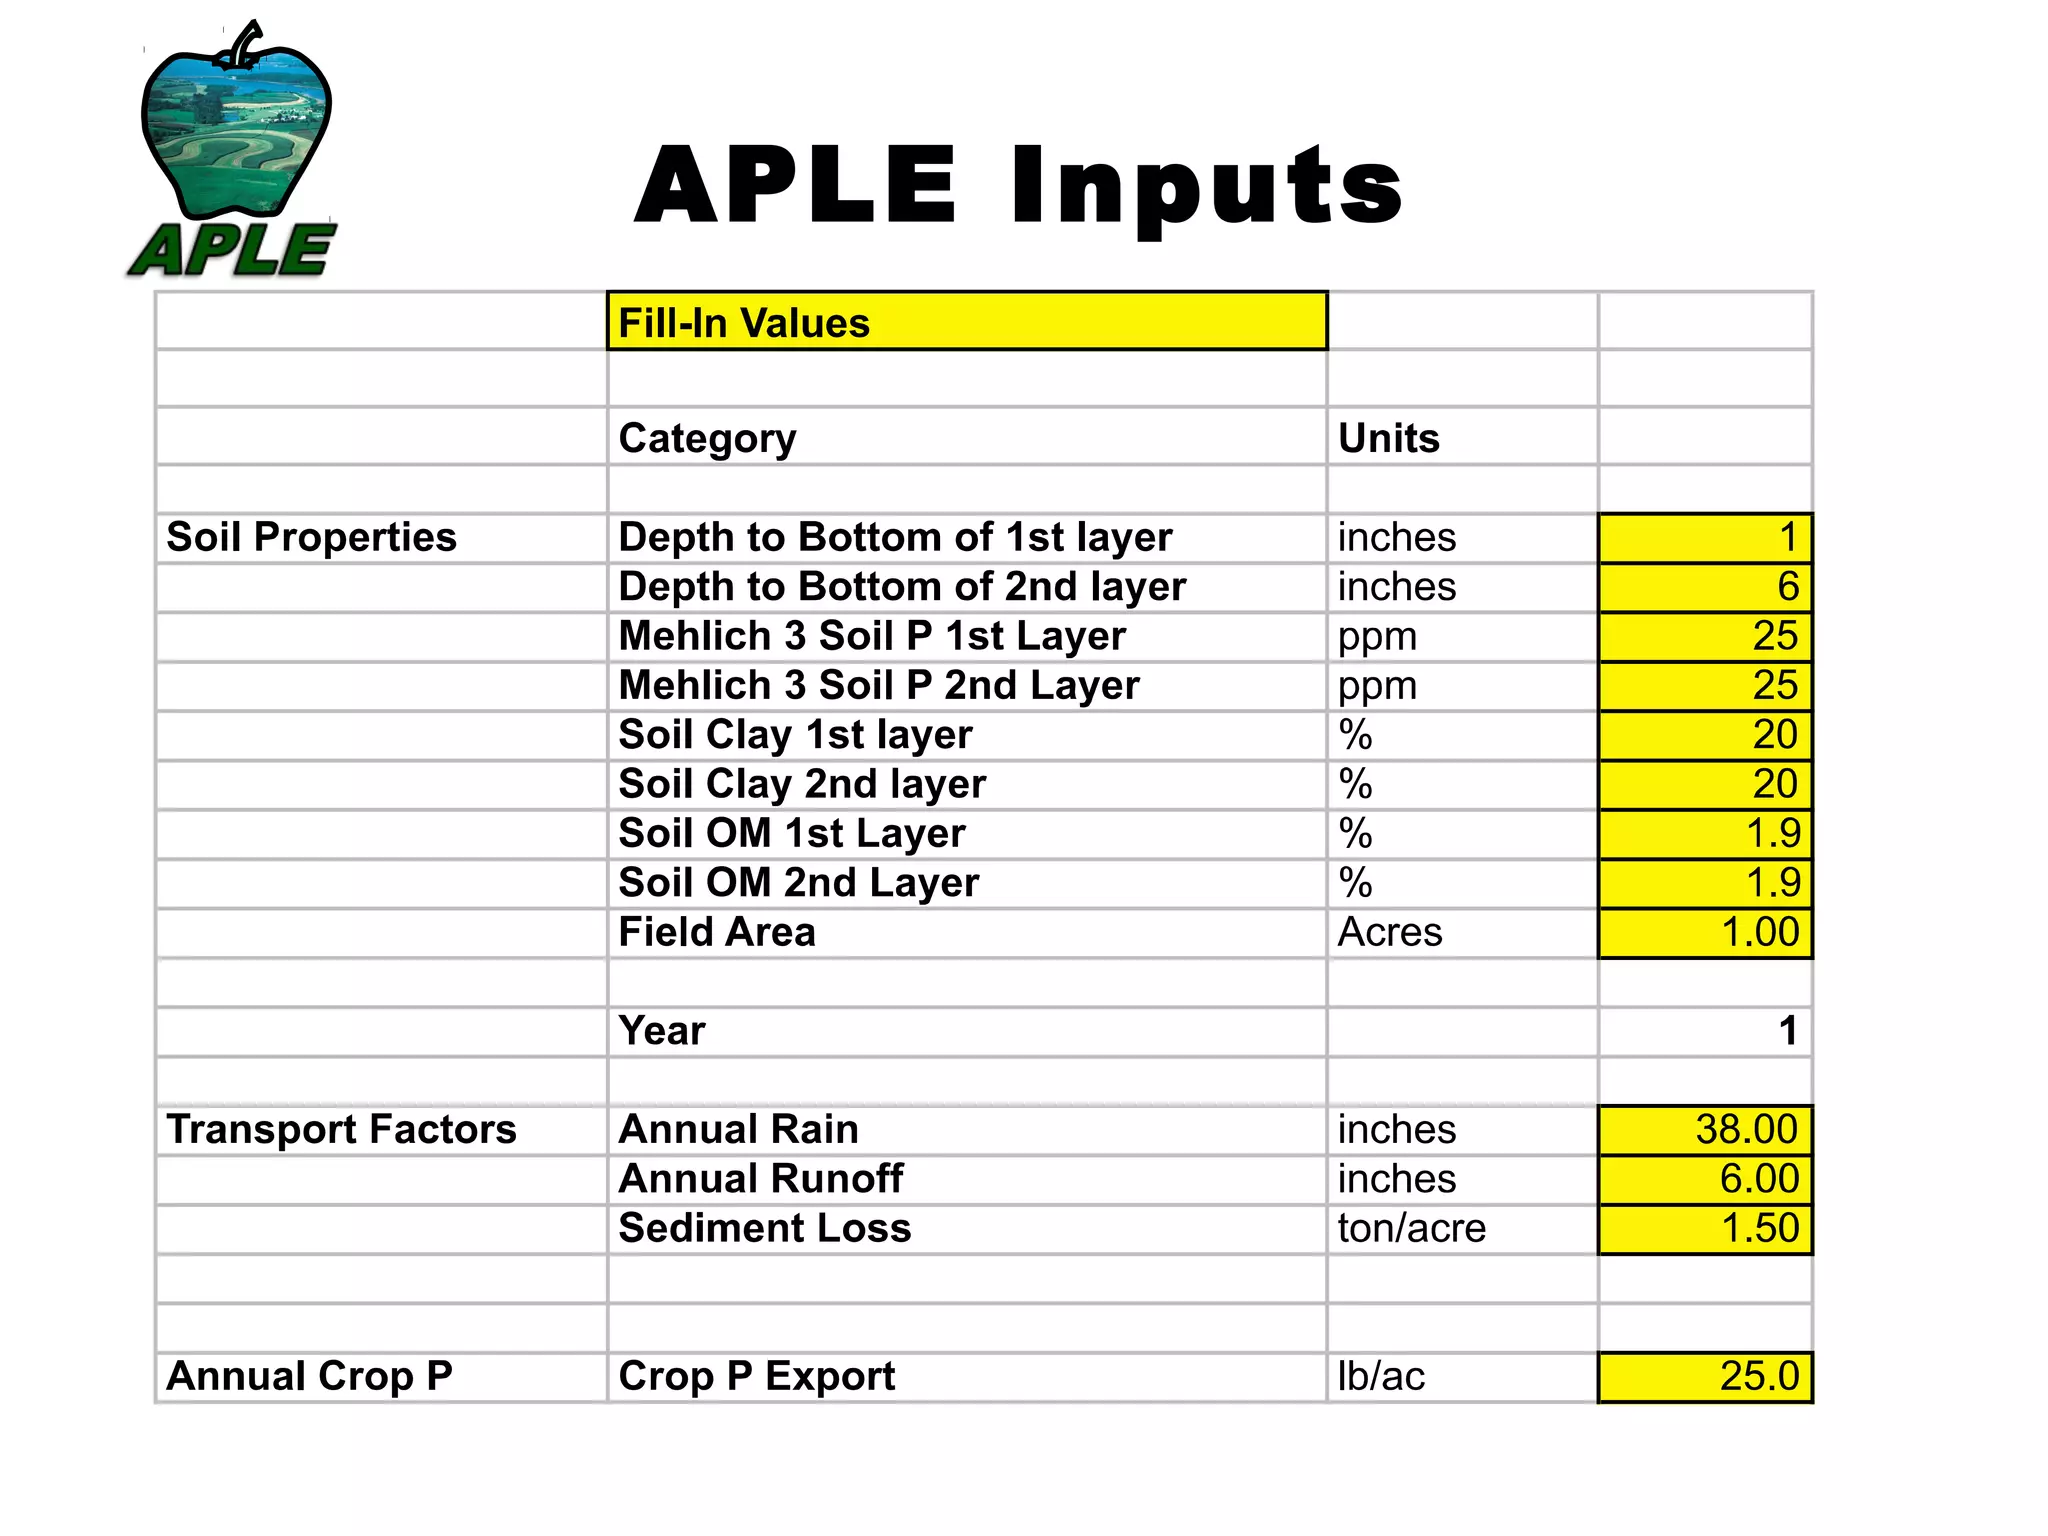
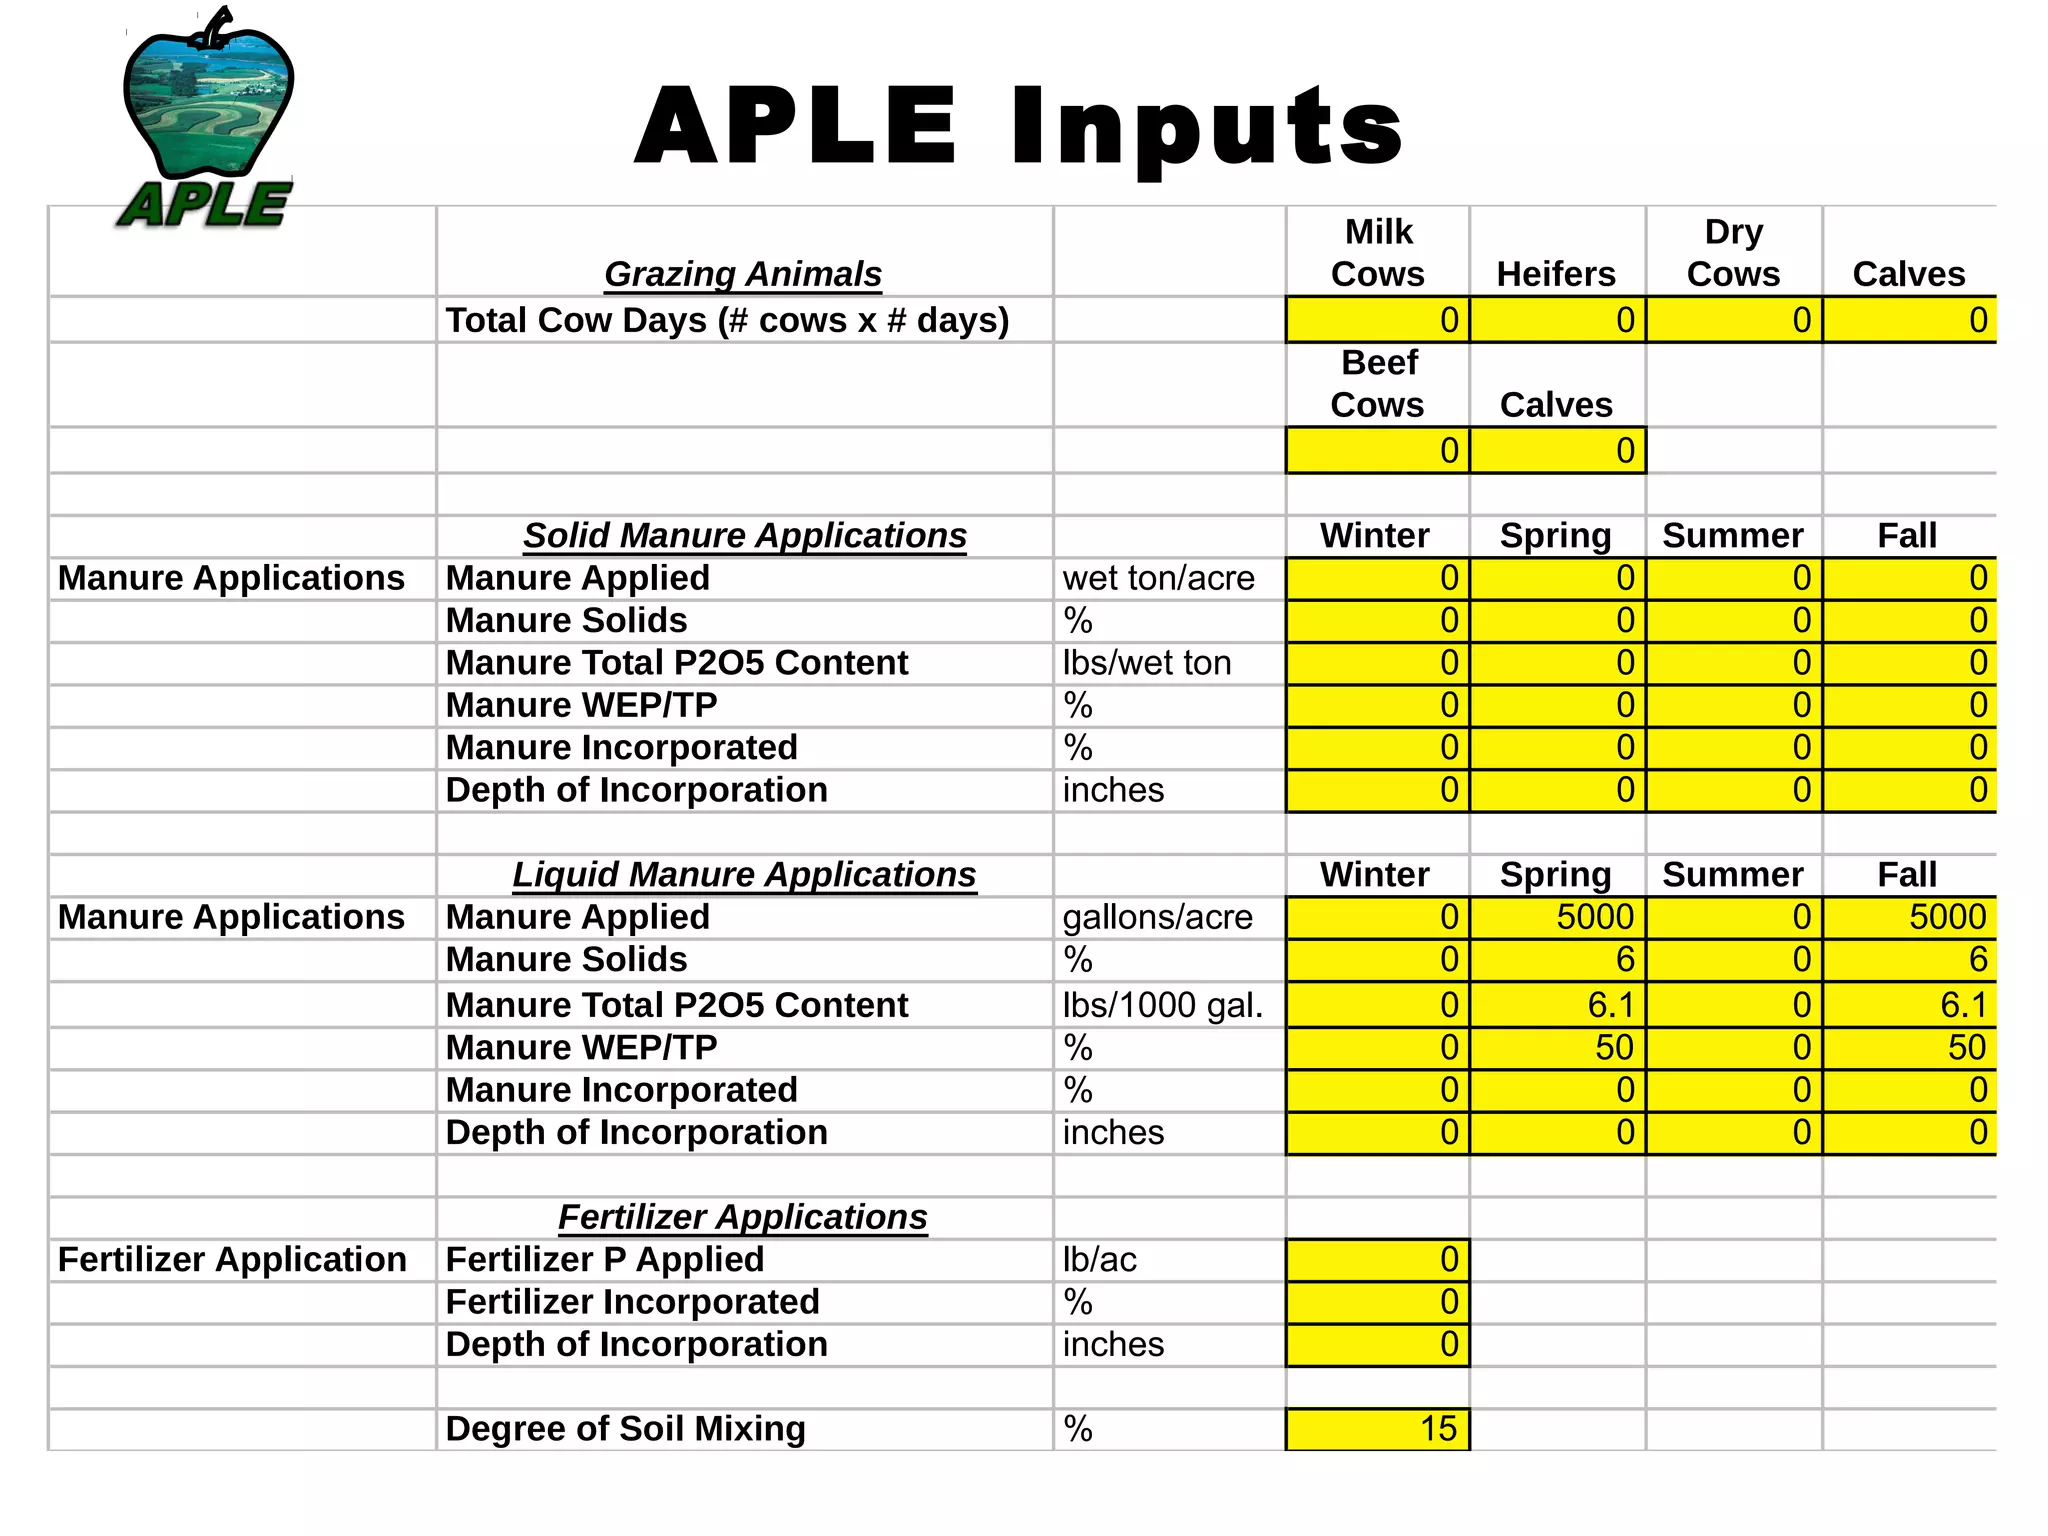
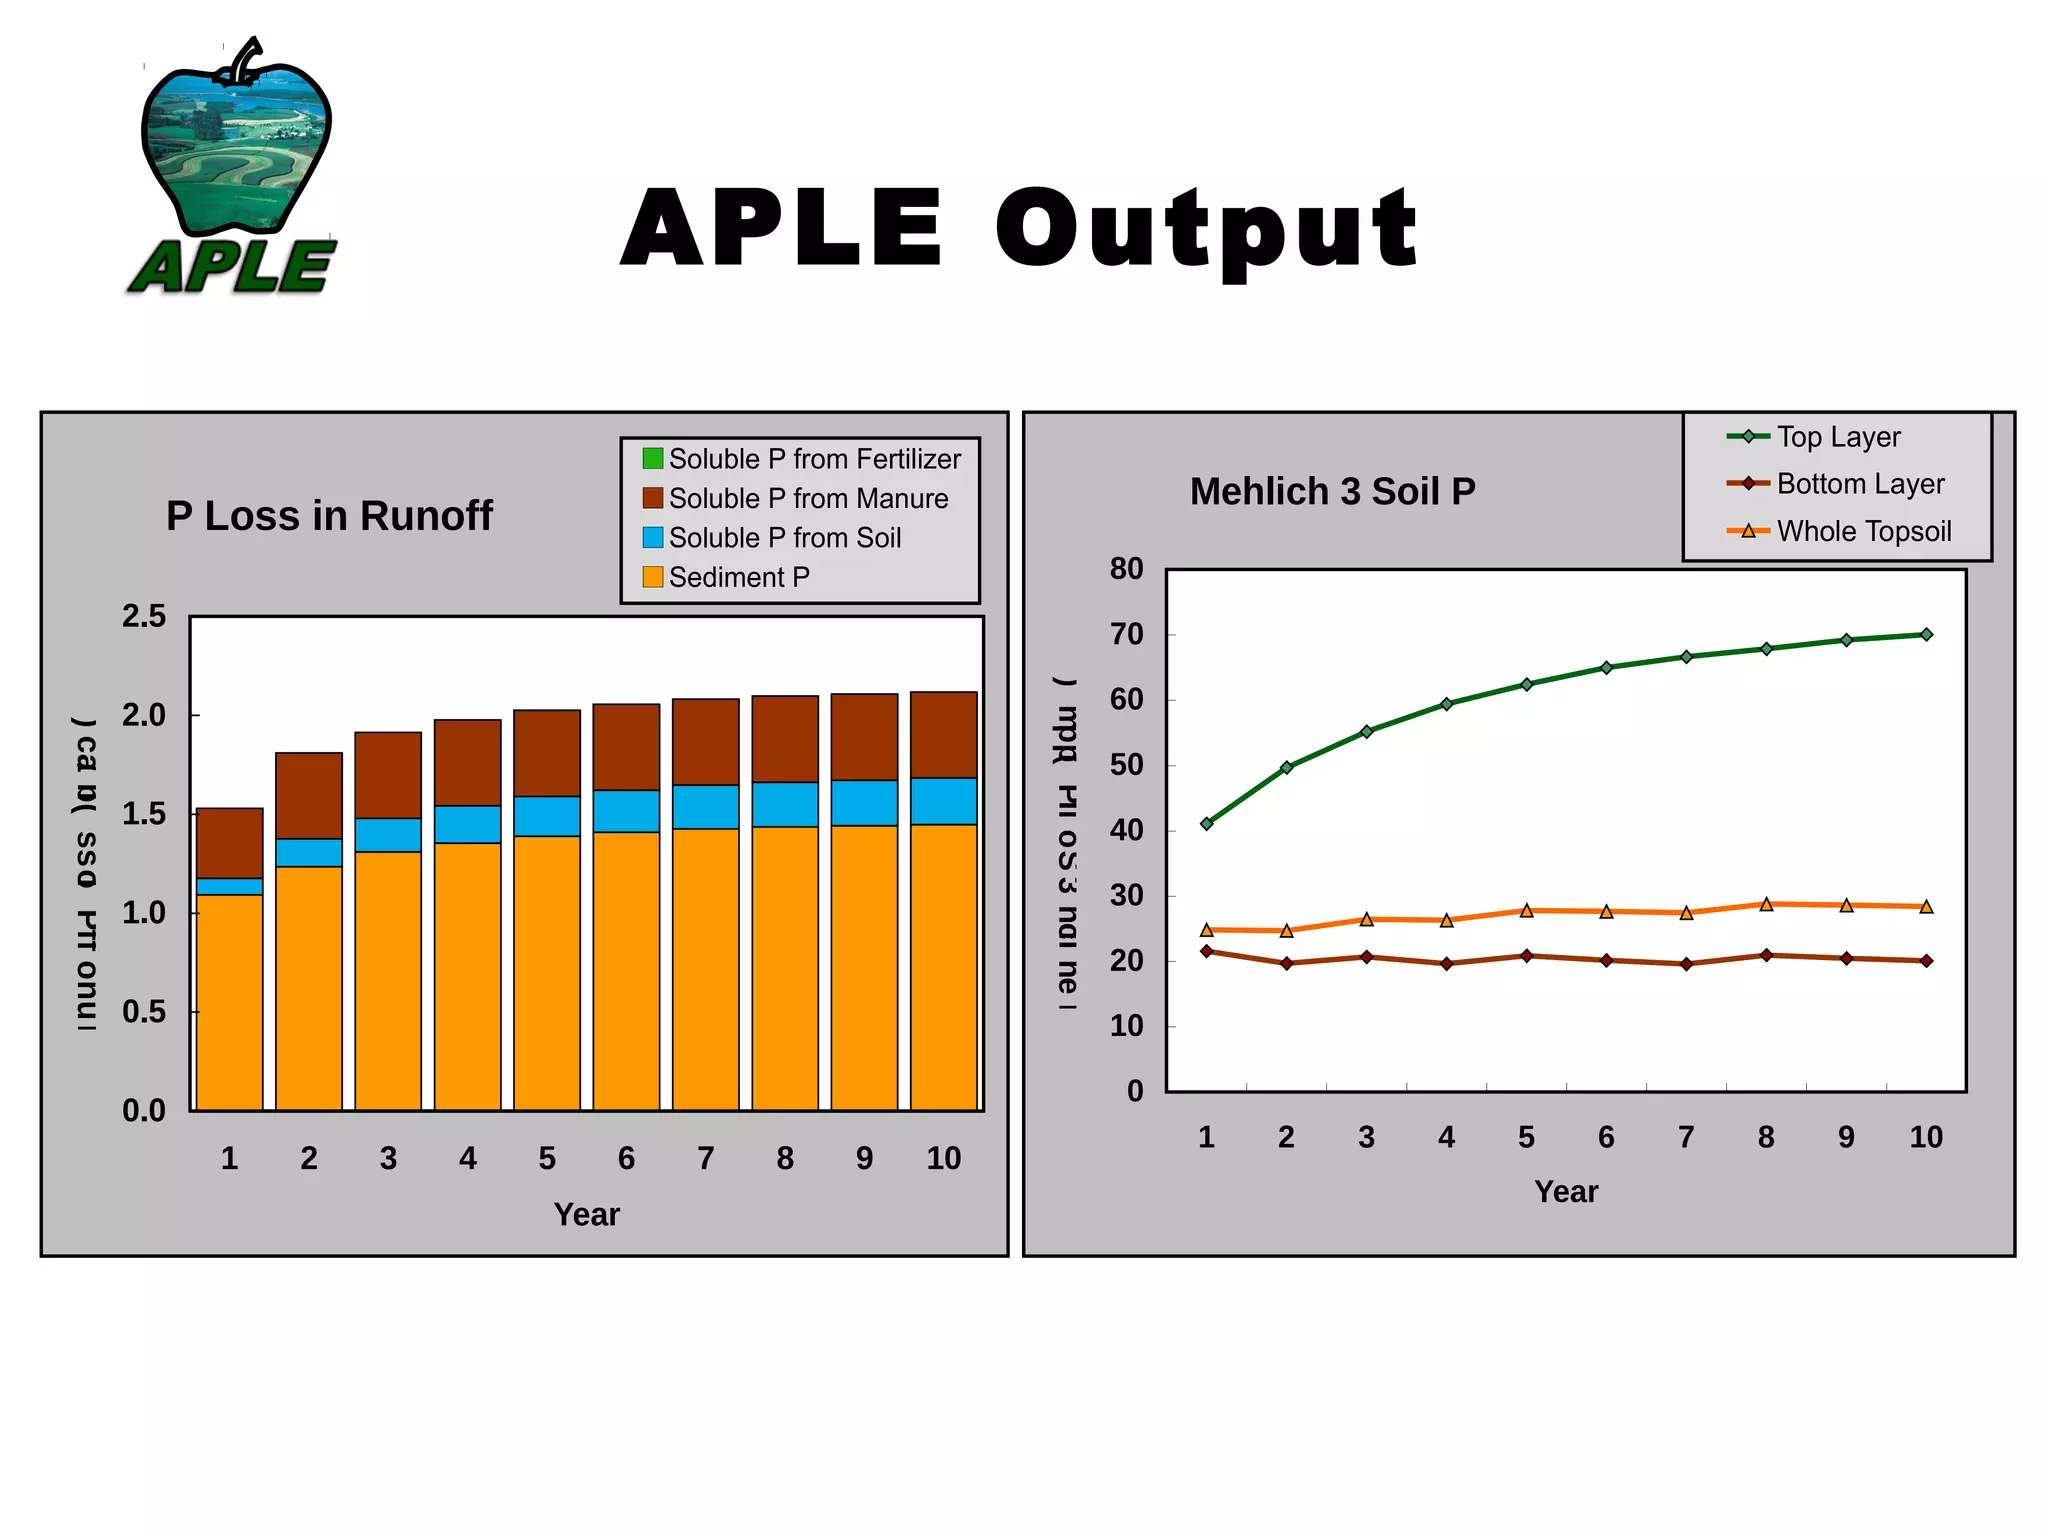
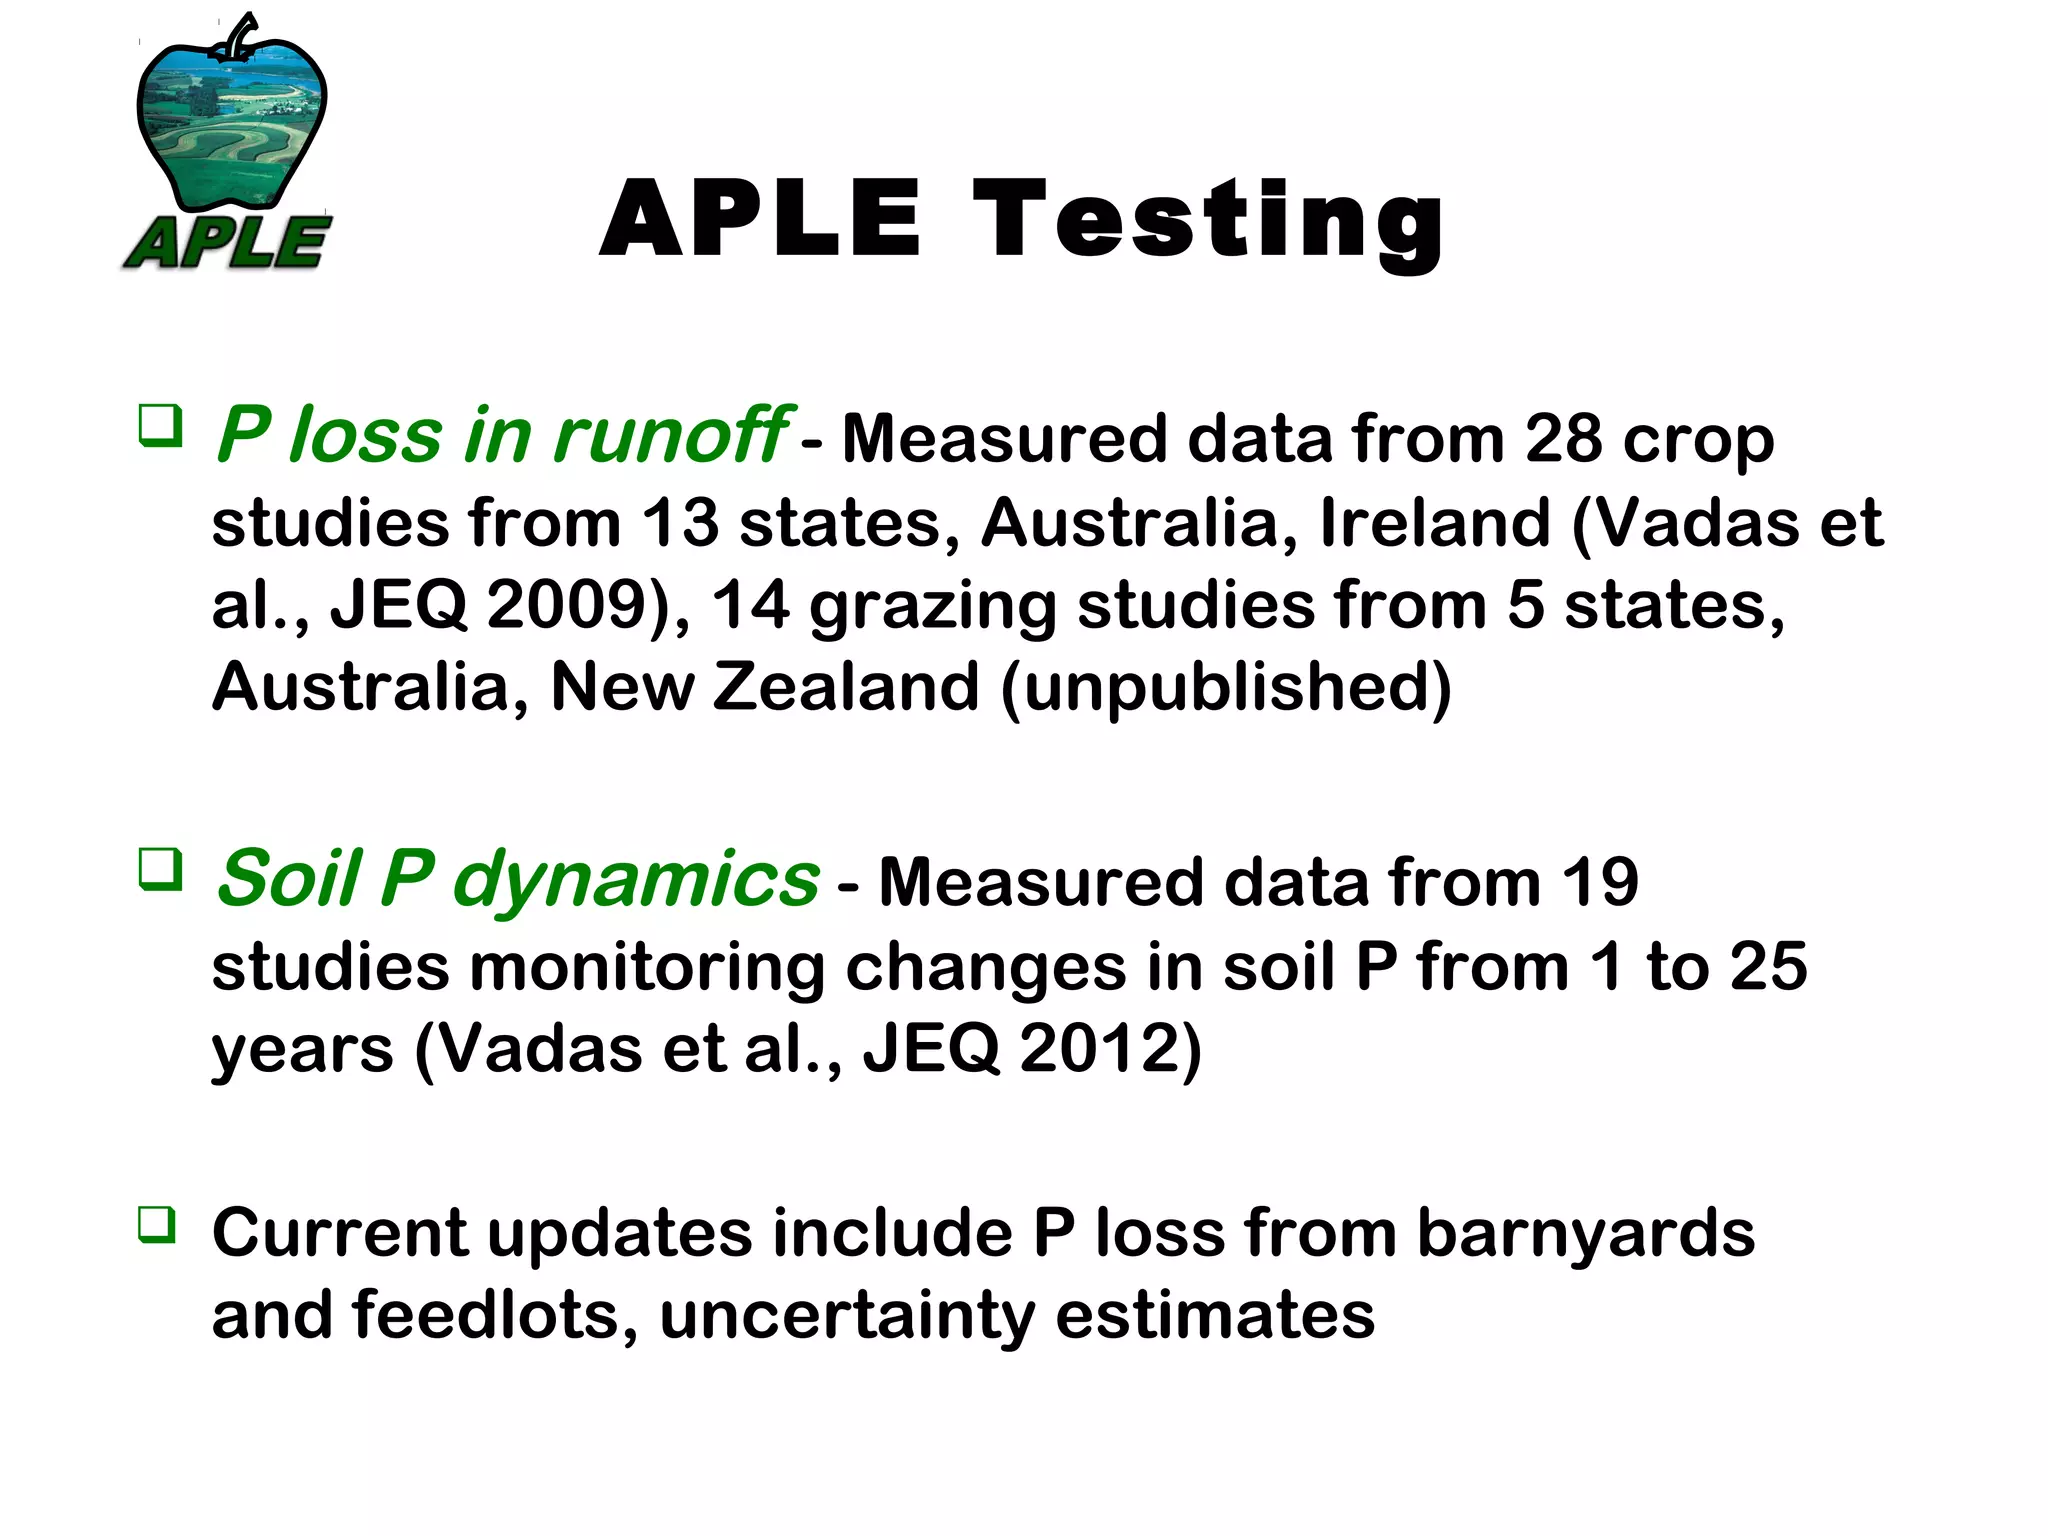
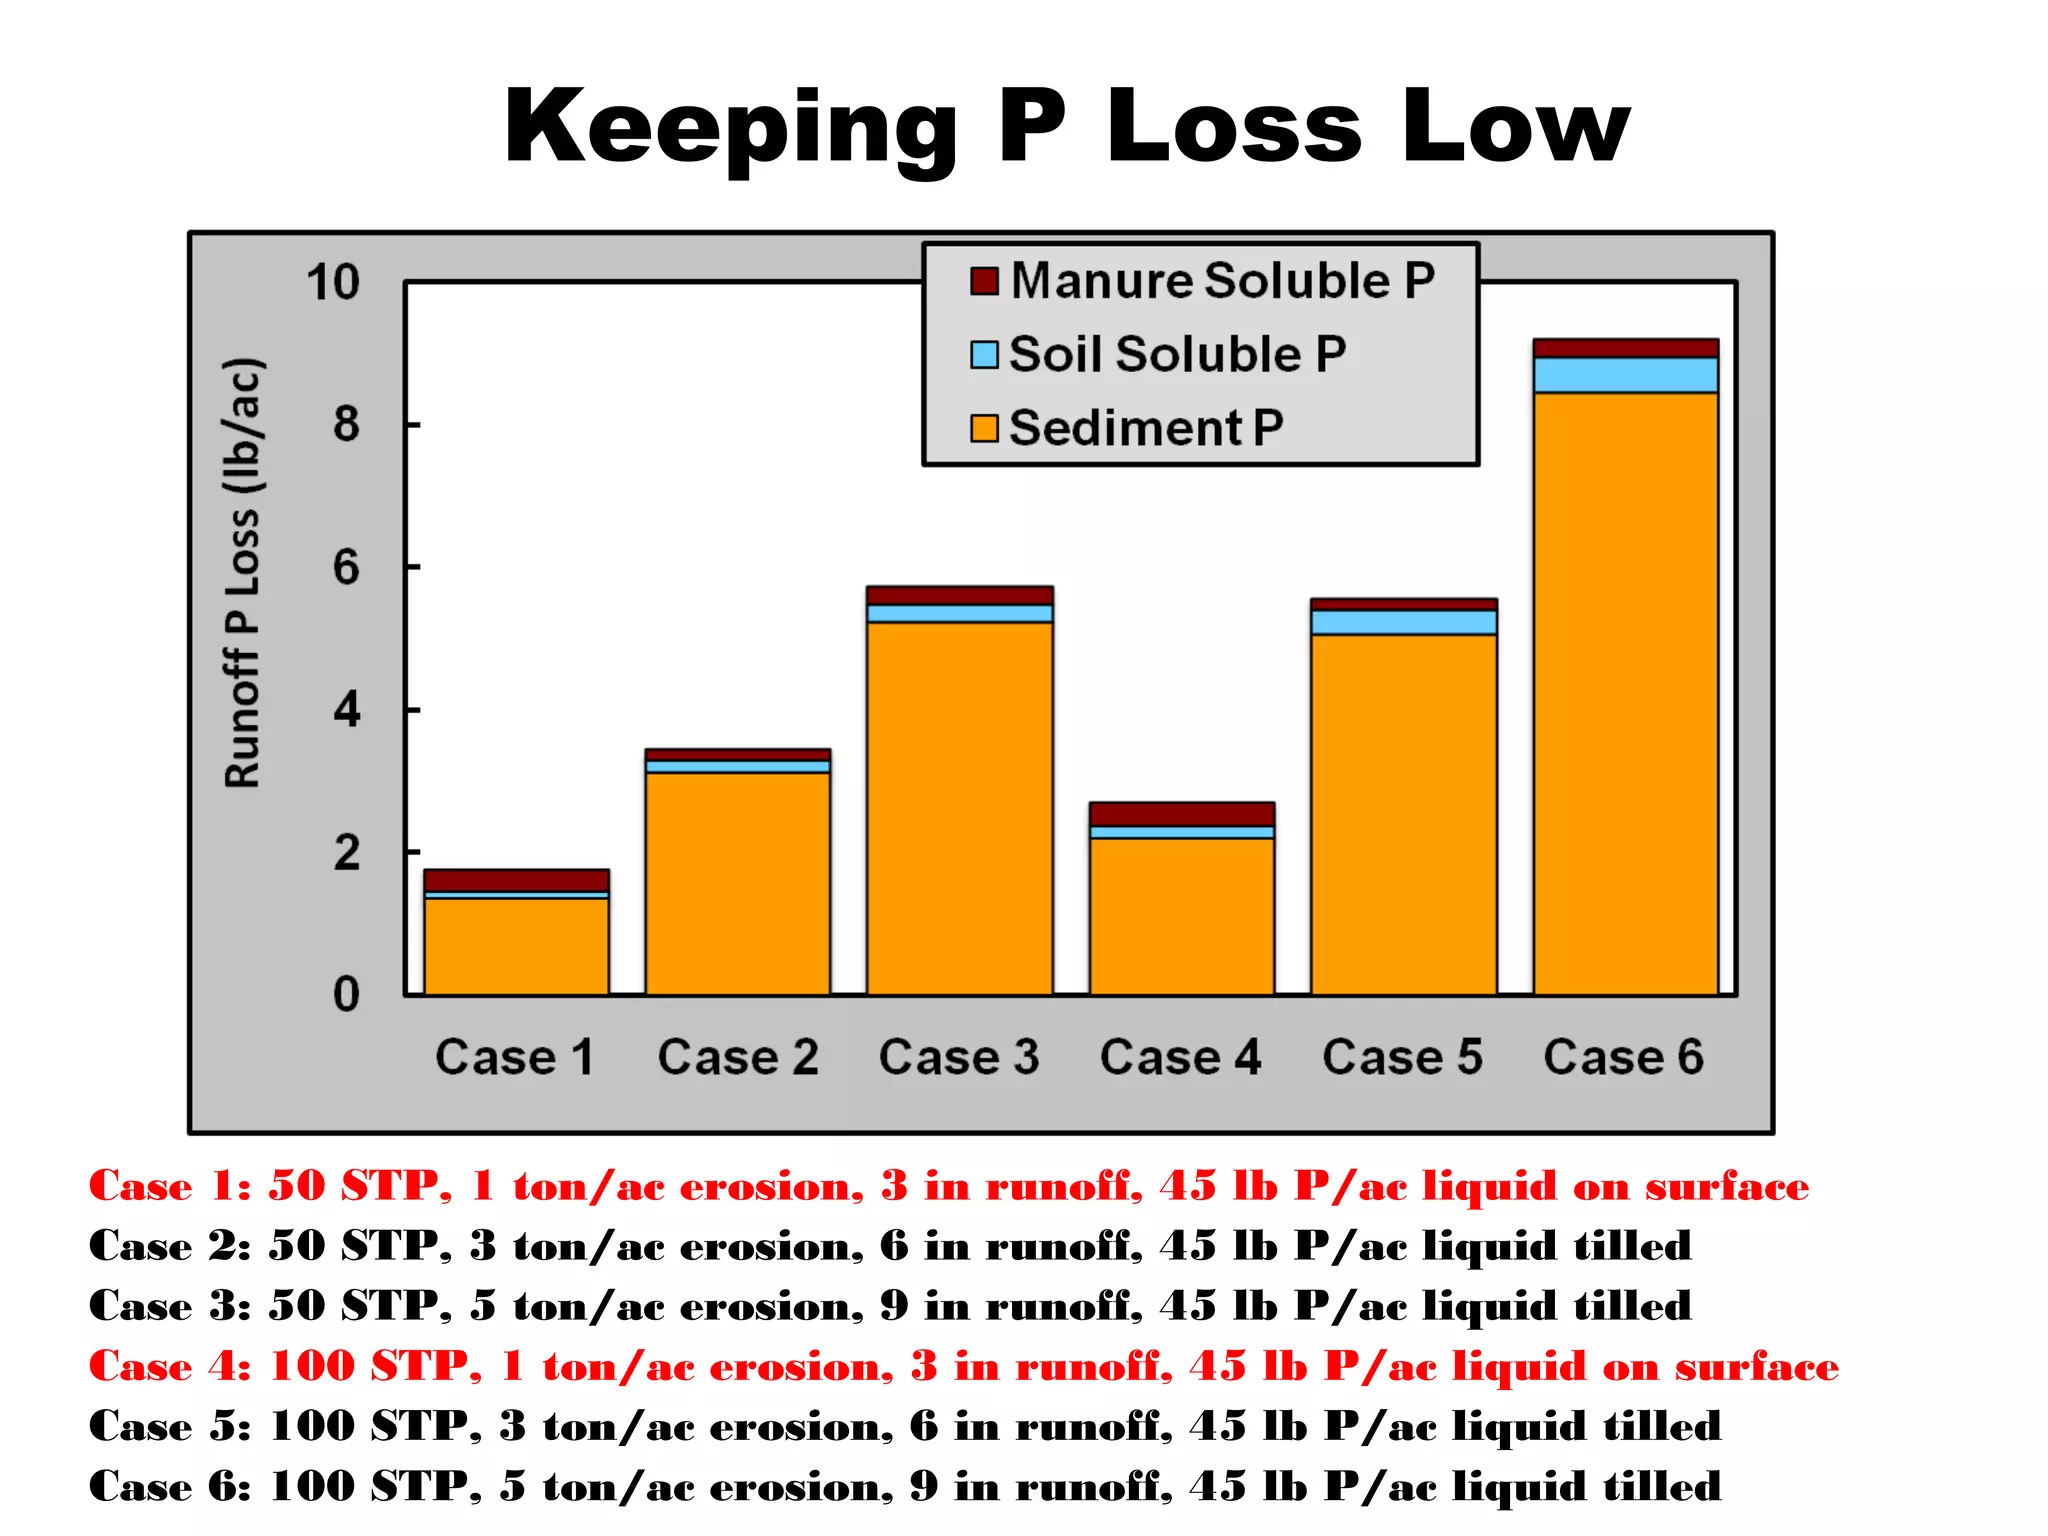
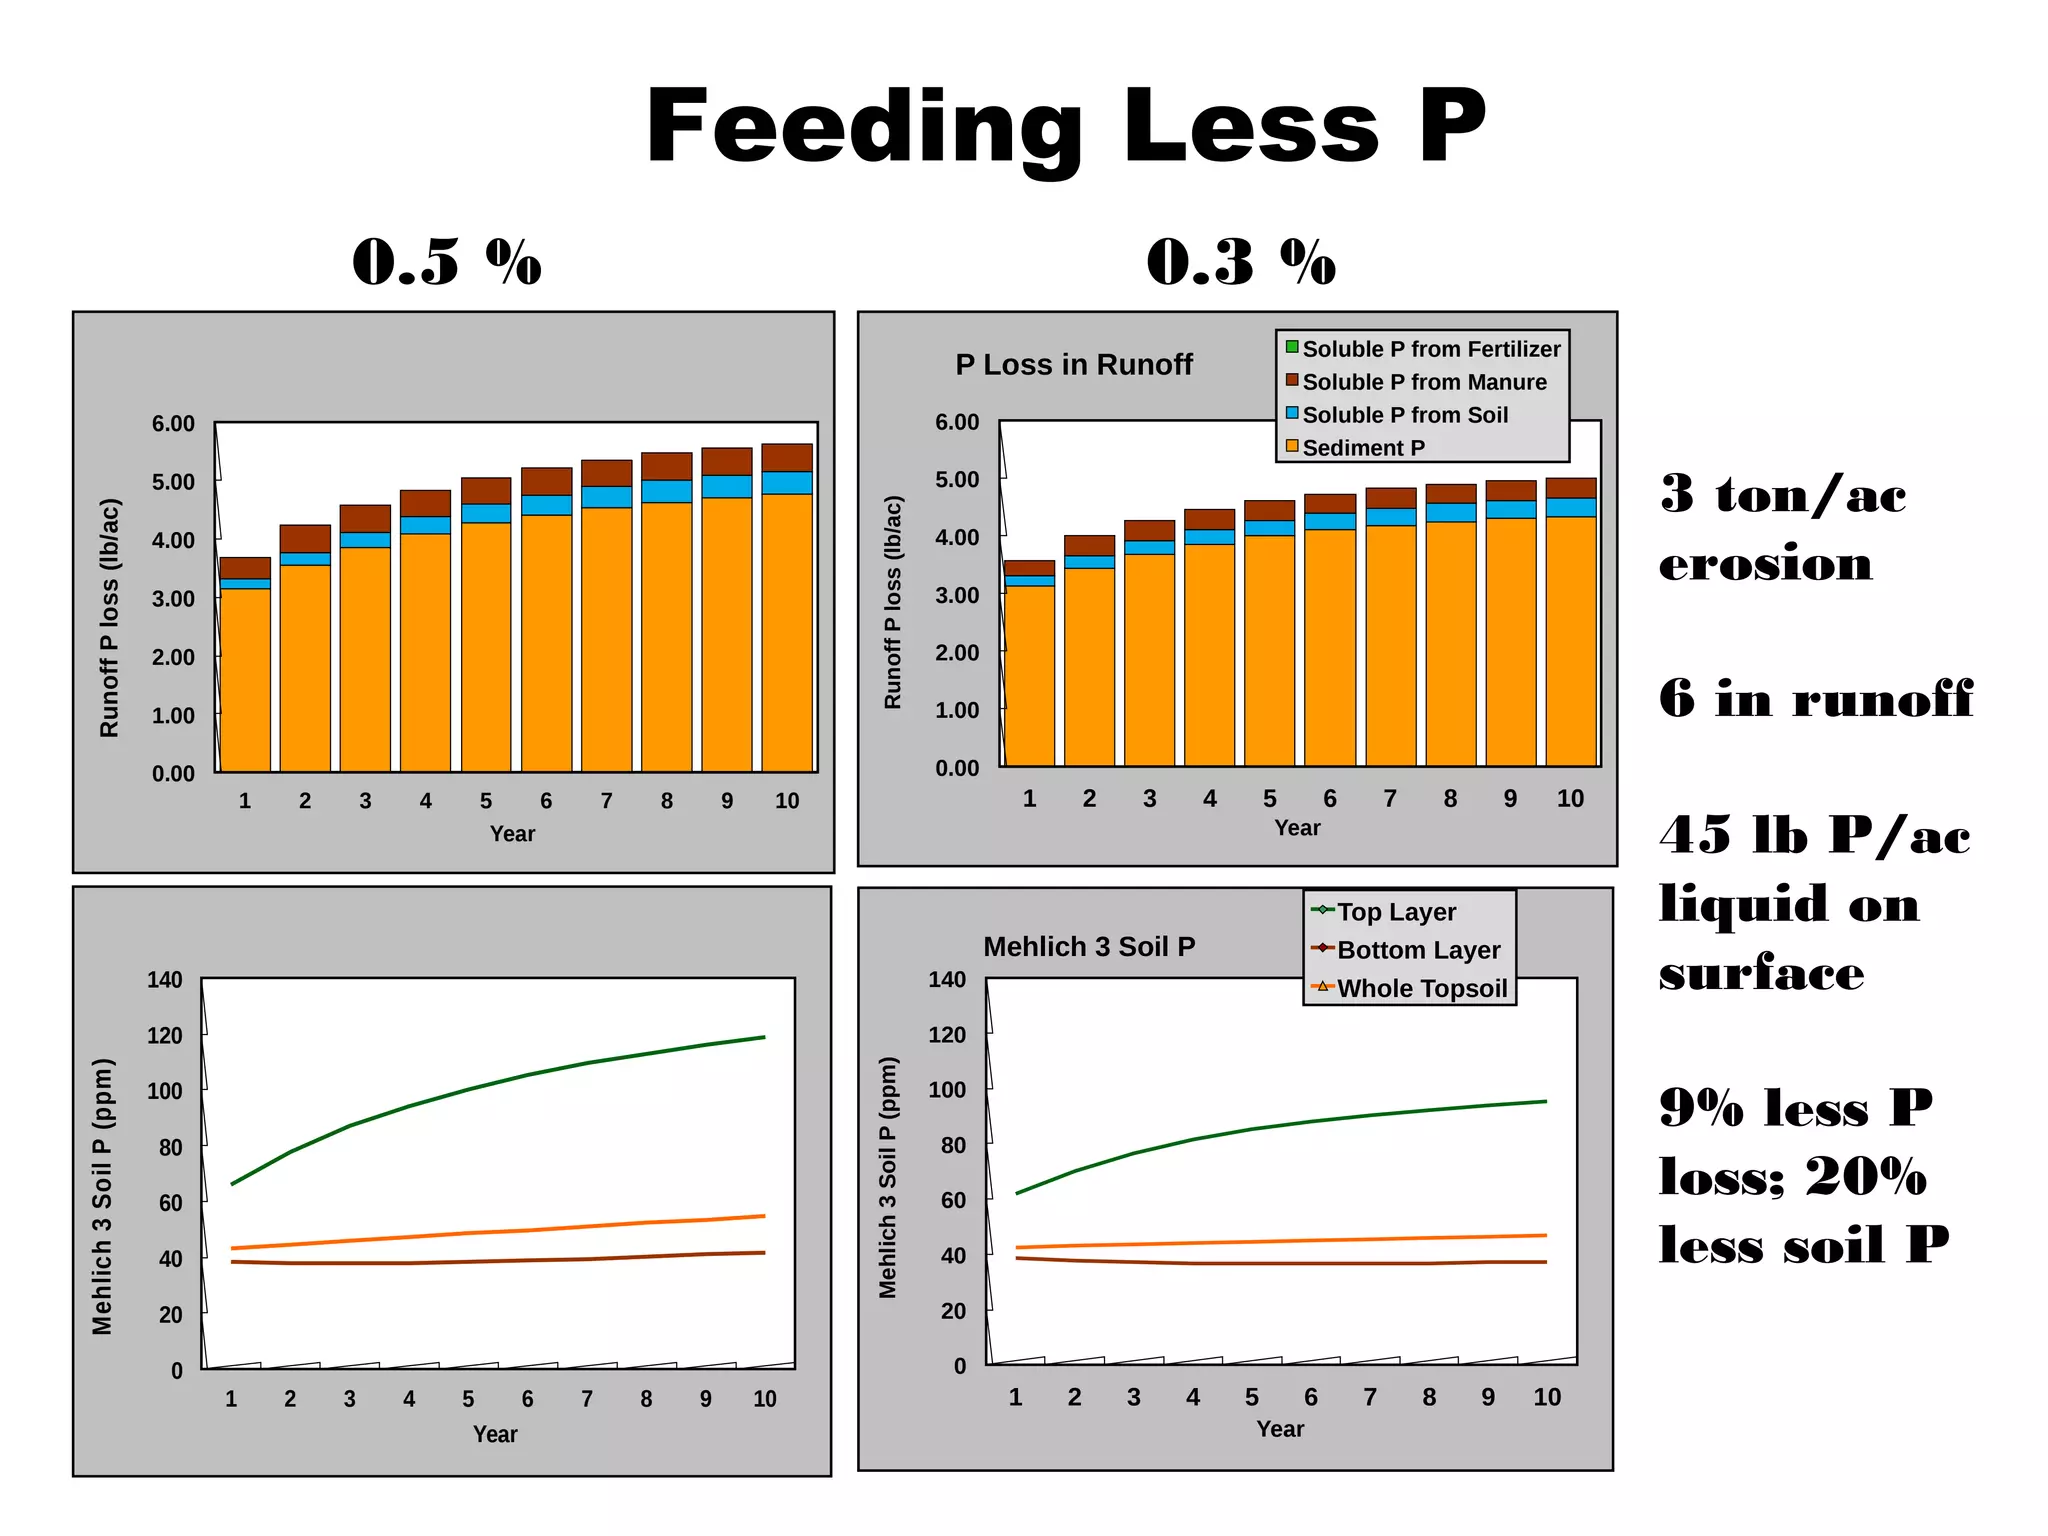
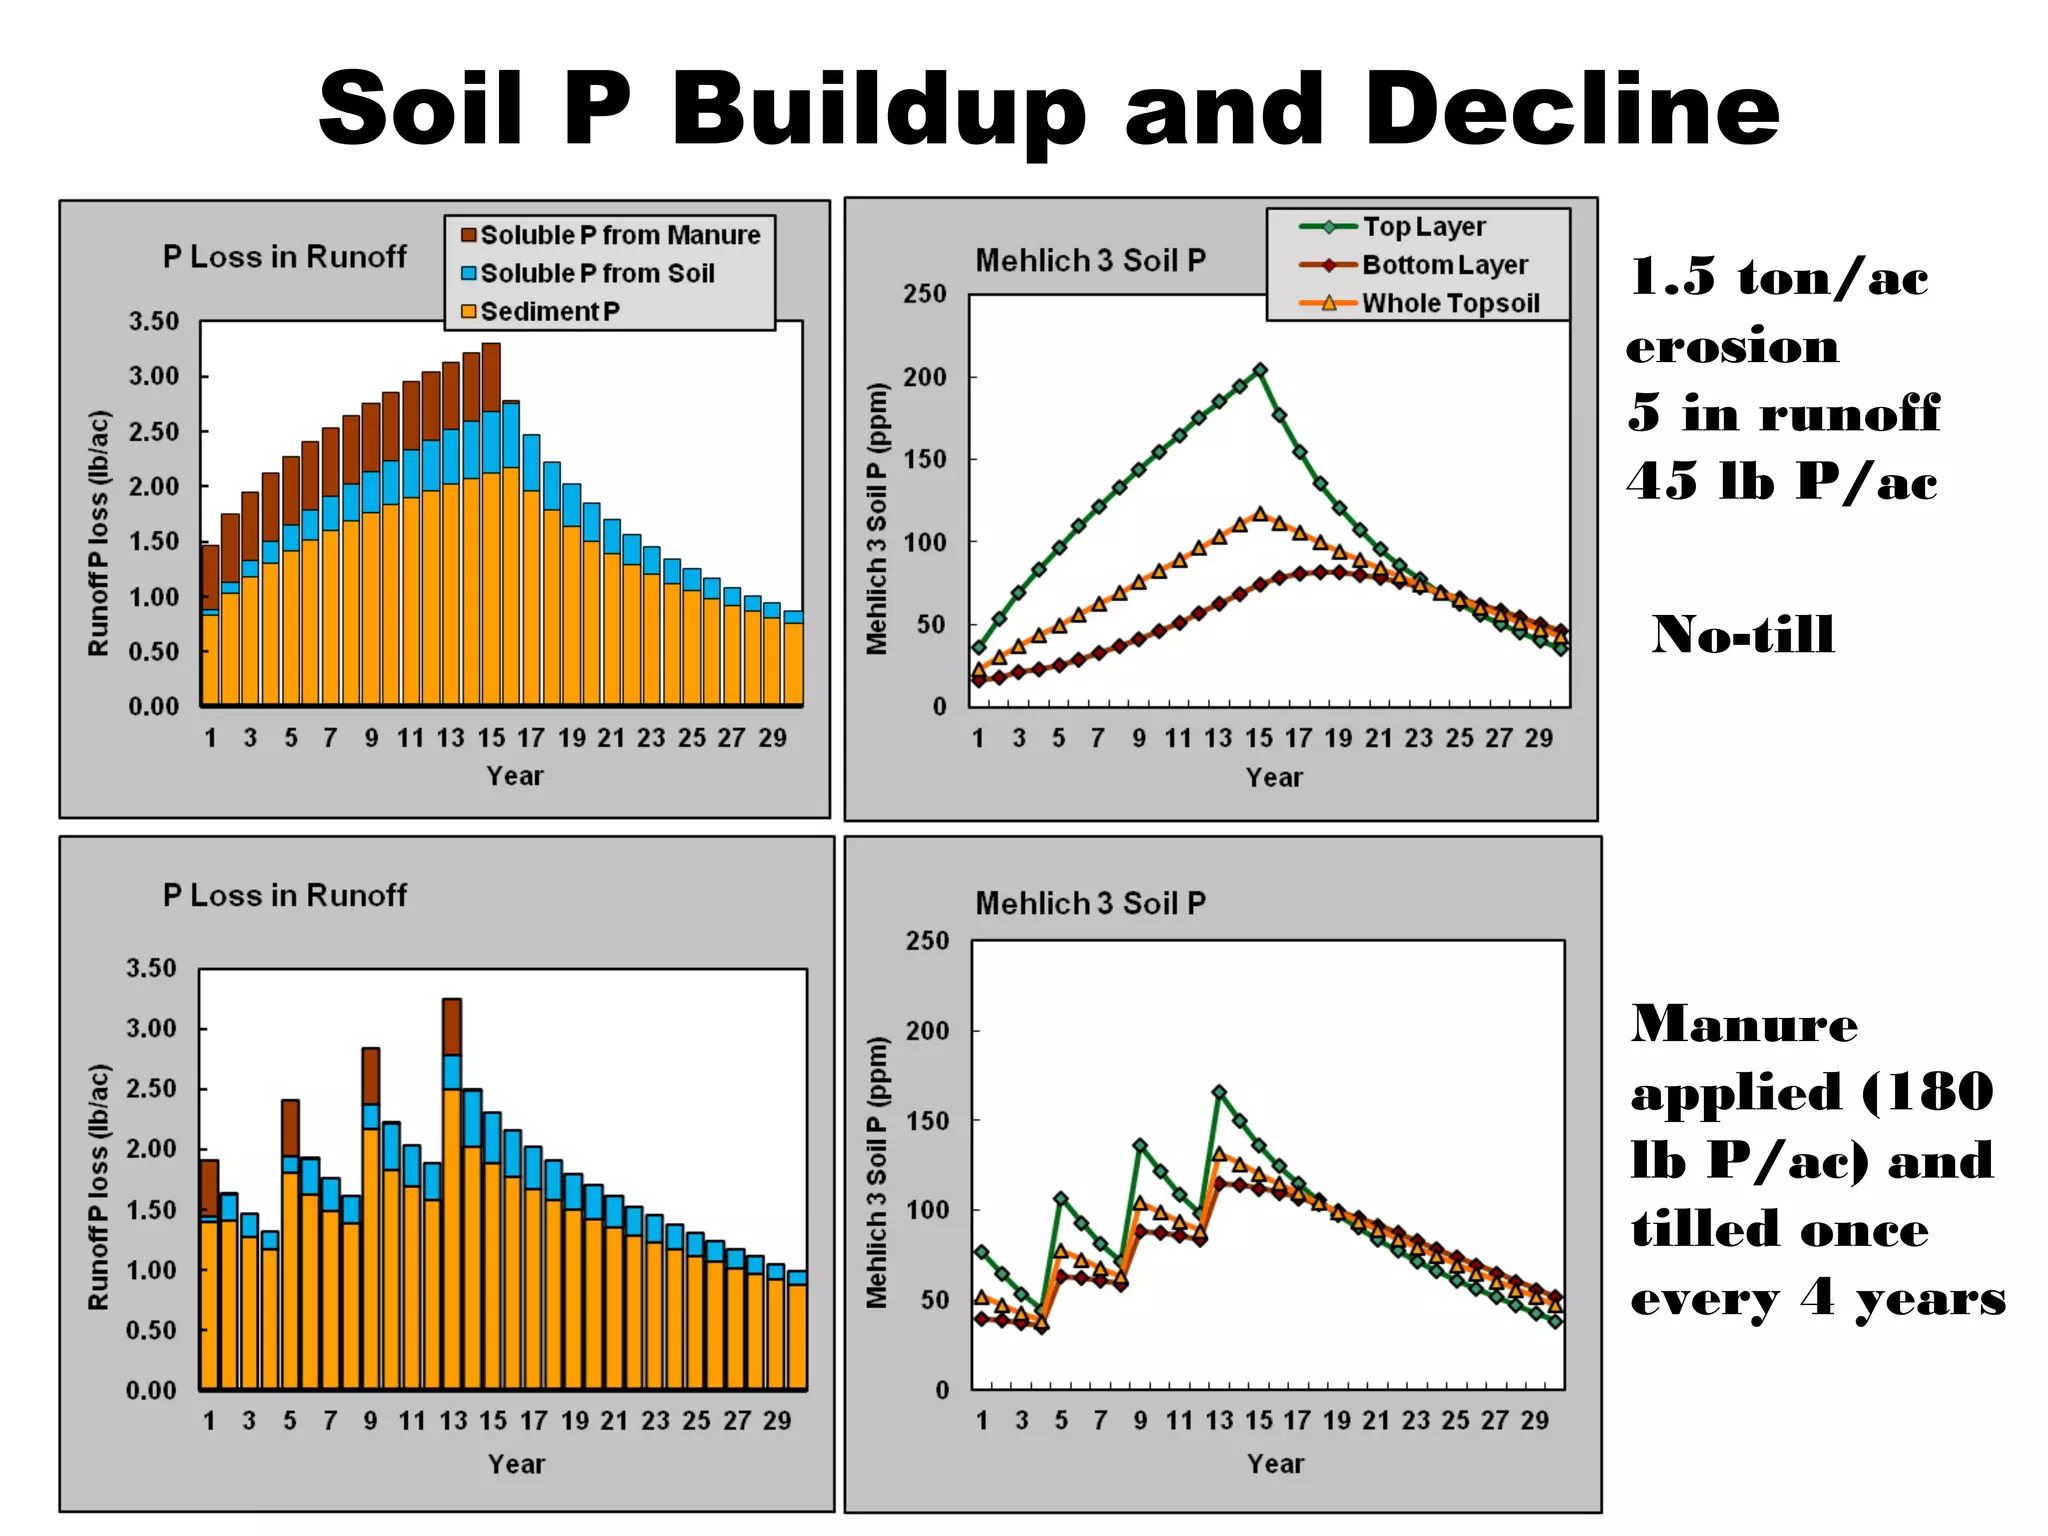
This document discusses different types of phosphorus (P) loss models and their appropriate uses. It summarizes that P models range from complex process-based models to simpler P index models. A new model called APLE aims to provide quantitative P loss estimates in a user-friendly format. The document also provides examples of APLE model inputs, outputs, and testing against field data. It demonstrates how the APLE model can be used to examine different management scenarios and their impacts on P loss and soil test P levels over multiple years.
ENGLISH 7_Q4_LESSON 2_ Employing a Variety of Strategies for Effective Interp...
Modeling Phosphorus Movement
1. Peter Vadas
USDA-ARS, Dairy Forage Research Center, Madison, WI
Current Models for Phosphorus
Loss from Agricultural Systems
2. Agricultural P Loss? It
Depends
How do we effectively integrate decades of data and
multiple processes into comprehensive method
producers, policy makers can use to make decisions?
Soil P quantity and chemistry
P Application rate and method
Manure and fertilizer chemistry
Runoff hydrology
Erosion
How much does agriculture contribute to P pollution?
What can producers do to decrease P loss? How do we
answer these questions?
3. The Case for Models
Due to sheer number of important physical and
management interactions, impossible to meet demands
for information fast enough and cheap enough relying on
field research alone.
Models are effective, efficient way to integrate variety of
field data to make decisions. Some scenarios (climate
change, system integration) impossible to address without
models.
Model development forces us to formalize and test
understanding of natural processes, and thus identify
knowledge and data gaps.
Models are simple representations of our understanding
of reality. Can’t capture all complexities, what we don’t
know.
5. Complex P Models
Daily time-step, field to watershed scale,
quantitative predictions; For TMDL-type projects
Process-based, spatially explicit simulations of
hydrology, multiple contaminant transport through
landscape
Data intensive for inputs and testing, extensive
user experience and skill needed
Should be calibrated
Require dedicated support system for updating and
development
6. Simple P Indexes
Annual time-step, field scale, relative ranking of
risk of P loss
Good for producer/policy education
Not data intensive, little user experience and
skill needed, no calibration needed
Not process-based, calculations based on data
and professional judgment
Generally had little field testing to verify
accuracy of predictions and recommendations
7. User-friendly,
Quantitative P Loss
Models Models that estimate (lb/ac) annual, field-scale,
P loss
Moderate data requirements (mix of databases
and user-defined management)
Require moderate user experience and skill, no
calibration needed
Process-based equations based only on
experimental data, not spatially explicit
Able to test with widely available P loss data
8. Excel spreadsheet model that estimates (lb/ac)
annual, field-scale, dissolved and sediment P loss in
surface runoff for given set of management, soil P,
erosion, runoff conditions.
Intended to be process-based like SWAT, APEX, but
user-friendly like P Index.
11. APLE Output
P Loss in Runoff
0.0
0.5
1.0
1.5
2.0
2.5
1 2 3 4 5 6 7 8 9 10
Year
RunoffPloss(lb/ac)
Soluble P from Fertilizer
Soluble P from Manure
Soluble P from Soil
Sediment P
Mehlich 3 Soil P
0
10
20
30
40
50
60
70
80
1 2 3 4 5 6 7 8 9 10
Year
Mehlich3SoilP(ppm)
Top Layer
Bottom Layer
Whole Topsoil
12. APLE Testing
P loss in runoff - Measured data from 28 crop
studies from 13 states, Australia, Ireland (Vadas et
al., JEQ 2009), 14 grazing studies from 5 states,
Australia, New Zealand (unpublished)
Soil P dynamics - Measured data from 19
studies monitoring changes in soil P from 1 to 25
years (Vadas et al., JEQ 2012)
Current updates include P loss from barnyards
and feedlots, uncertainty estimates
13. Case 1: 50 STP, 1 ton/ac erosion, 3 in runoff, 45 lb P/ac liquid on surface
Case 2: 50 STP, 3 ton/ac erosion, 6 in runoff, 45 lb P/ac liquid tilled
Case 3: 50 STP, 5 ton/ac erosion, 9 in runoff, 45 lb P/ac liquid tilled
Case 4: 100 STP, 1 ton/ac erosion, 3 in runoff, 45 lb P/ac liquid on surface
Case 5: 100 STP, 3 ton/ac erosion, 6 in runoff, 45 lb P/ac liquid tilled
Case 6: 100 STP, 5 ton/ac erosion, 9 in runoff, 45 lb P/ac liquid tilled
Keeping P Loss Low
14. 0.00
1.00
2.00
3.00
4.00
5.00
6.00
1 2 3 4 5 6 7 8 9 10
RunoffPloss(lb/ac)
Year
0.00
1.00
2.00
3.00
4.00
5.00
6.00
1 2 3 4 5 6 7 8 9 10
RunoffPloss(lb/ac)
Year
P Loss in Runoff
Soluble P from Fertilizer
Soluble P from Manure
Soluble P from Soil
Sediment P
0
20
40
60
80
100
120
140
1 2 3 4 5 6 7 8 9 10
Mehlich3SoilP(ppm)
Year
Mehlich 3 Soil P
Top Layer
Bottom Layer
Whole Topsoil
0
20
40
60
80
100
120
140
1 2 3 4 5 6 7 8 9 10
Mehlich3SoilP(ppm)
Year
Feeding Less P
0.5 % 0.3 %
3 ton/ac
erosion
6 in runoff
45 lb P/ac
liquid on
surface
9% less P
loss; 20%
less soil P
15. Soil P Buildup and Decline
1.5 ton/ac
erosion
5 in runoff
45 lb P/ac
No-till
Manure
applied (180
lb P/ac) and
tilled once
every 4 years
16. Summary
Models are effective way to integrate years of P
research data to meet demand for management
and impact information fast and cheap.
Models vary in complexity and appropriate uses,
not always easy to know which one to choose and
how to use output.
New P models help capture current science,
balance versatility and complexity with user-
friendliness
Models are indispensible; need to be well
developed and tested, have committed support
from policy makers, scientists
Editor's Notes
This slide has animation. Decided not to give any background on P loss from agriculture and the implications. Assuming people know this. Making the point that when we talk about P loss, there are a lot of factors that contribute. So with all these factors, how do we answer the questions in the first group? We have done decades of research, but it is still difficult to integrate all that information into a nice, easy method people can rapidly use.
This slide had animation. Saying that we really seem to have two modeling options out there right now for P – either the really complex (e.g. SWA) or the really simple (e.g. P Index). There is a need for something in the middle that is process-based but also easy to use. Probably do not need to read through whole list of attributes.
This slide had animation Saying that we developed the APLE model, which is free to download from DFRC site with documentation. You can read the text to say what model is intended to do.
No animation Next two slides just show the model input screen so audience can see the simplicity of operation and what kind of variables are needed.
No animation. Just showing the output – how it is quantitative, gives restuls over 10 years and looks at both P loss (especially from different sources) and changes in soil P. This is a level of output detail that most models (complex or simple) do not give.
No animation: Just making the point that APLE has been well validated. Sorry, I used the V-word. Can ’ t change it now. Also saying we are updating it for P loss from barnyards and feedlots and uncertainty.
There is animation here. The purpose of the next three slides is to give audience an idea of what kind of scenarios the model is good for. I did not present this type of information last year. In this slide, assuming ~2lb/acre loss is where we would like to be, the first scenario generally shows what level of runoff, erosion, soil P, and manure application would be OK. The following 5 scenarios show how users can change these variables to see the effect on P loss. Case 2-3 are increasing runoff and erosion from baseline. Case 4-6 have all the same variable as 1-3, but just with more soil P. Want to make the point that users can very quickly change inputs (matter of minutes) and see what kind management they need to achieve to get to a certain level of P loss.
No animation: Busy slide, but just showing that user’s can quickly assess environmental impact of feeding less P in animal diets (cows in this case). Just need to change manure P content in the input page, and we can get estimates of 9% less P in runoff and 20% less soil P.
No animation: Kind of busy too, but just showing users can look at long-term changes in soil P for different P application rates (we have 30y and 50 y versions of the model available). In this case, manure is applied either annually for no-till or once every four years (at a 4-y rate) and tilled in. Manure is applied for the first 15 y and stopped to look and soil P decline. Looks like the 4-year scenario can reduce P loss somewhat and keep soil P a little lower. However, it takes a long time to draw down soil P.
Summary slide, can probably just read this. Last bullet gets at the point of the session of combining N and P management.