SlideShare a Scribd company logo
1 of 46
Download to read offline
1 1
Printedfrom:http://www.me.mtu.edu/~mavable/MoM2nd
Mechanics of Materials: StressM. Vable
January 2014
CHAPTER ONE
STRESS
Learning objectives
1. Understanding the concept of stress.
2. Understanding the two-step analysis of relating stresses to external forces and moments.
_______________________________________________
On January 16th, 1943 a World War II tanker S.S. Schenectady, while tied to the pier on Swan Island in Oregon, fractured just
aft of the bridge and broke in two, as shown in Figure 1.1. The fracture started as a small crack in a weld and propagated rapidly
overcoming the strength of the material. But what exactly is the strength? How do we analyze it? To answer these questions, we
introduce the concept of stress. Defining this variable is the first step toward developing formulas that can be used in strength
analysis and the design of structural members.
Figure 1.2 shows two links of the logic that will be fully developed in Section 3.2. What motivates the construction of
these two links is an idea introduced in Statics—analysis is simpler if any distributed forces in the free-body diagram are
replaced by equivalent forces and moments before writing equilibrium equations (see Appendix A.6). Formulas developed in
mechanics of materials relate stresses to internal forces and moments. Free-body diagrams are used to relate internal forces
and moments to external forces and moments.
Figure 1.1 Failure of S.S. Schenectady.
Figure 1.2 Two-step process of relating stresses to external forces and moments.
Static
equivalency Equilibrium
1 2
Printedfrom:http://www.me.mtu.edu/~mavable/MoM2nd
Mechanics of Materials: StressM. Vable
January 2014
1.1 STRESS ON A SURFACE
The stress on a surface is an internally distributed force system that can be resolved into two components: normal (perpendicu-
lar) to the imaginary cut surface, called normal stress, and tangent (parallel) to the imaginary cut surface, called shear stress.
1.1.1 Normal Stress
In Figure 1.3, the cable of the chandelier and the columns supporting the building must be strong enough to support the weight
of the chandelier and the weight of the building, respectively. If we make an imaginary cut and draw the free-body diagrams,
we see that forces normal to the imaginary cut are needed to balance the weight. The internal normal force N divided by the
area of the cross section A exposed by the imaginary cut gives us the average intensity of an internal normal force distribution,
which we call the average normal stress:
(1.1)
where σ is the Greek letter sigma used to designate normal stress and the subscript av emphasizes that the normal stress is
an average value. We may view σav as a uniformly distributed normal force, as shown in Figure 1.3, which can be replaced
by a statically equivalent internal normal force. We will develop this viewpoint further in Section 1.1.4. Notice that N is in
boldface italics, as are all internal forces (and moments) in this book.
Equation (1.1) is consistent with our intuitive understanding of strength. Consider the following two observations. (i) We
know that if we keep increasing the force on a body, then the body will eventually break. Thus we expect the quantifier for
strength (stress) to increase in value with the increase of force until it reaches a critical value. In other words, we expect stress
to be directly proportional to force, as in Equation (1.1). (ii) If we compare two bodies that are identical in all respects except
that one is thicker than the other, then we expect that the thicker body is stronger. Thus, for a given force, as the body gets
thicker (larger cross-sectional area), we move away from the critical breaking value, and the value of the quantifier of strength
should decrease. In other words, stress should vary inversely with the cross-sectional area, as in Equation (1.1).
Equation (1.1) shows that the unit of stress is force per unit area. Table 1.1 lists the various units of stress used in this
book. It should be noted that 1 psi is equal to 6.895 kPa, or approximately 7 kPa. Alternatively, 1 kPa is equal to 0.145 psi, or
σav
N
A
----=
Tensile Normal Force
Compressive Normal Force
Imaginary Cut
Chandelier Weight
Building Weight
Imaginary Cut
Chandelier Weight
Tensile Normal Stress
Building Weight
Compressive Normal Stress
N
N N N
σavg
σavg σavg σavg
Figure 1.3 Examples of normal stress distribution.
1 3
Printedfrom:http://www.me.mtu.edu/~mavable/MoM2nd
Mechanics of Materials: StressM. Vable
January 2014
approximately 0.15 psi. Normal stress that pulls the imaginary surface away from the material is called tensile stress, as
shown on the cable of the chandelier in Figure 1.3. Normal stress that pushes the imaginary surface into the material is called
compressive stress, as shown on the column. In other words, tensile stress acts in the direction of the outward normal whereas
compressive stress is opposite to the direction of the outward normal to the imaginary surface. Normal stress is usually
reported as tensile or compressive and not as positive or negative. Thus σ = 100 MPa (T) or σ = 10 ksi (C) are the preferred
ways of reporting tensile or compressive normal stresses.
The normal stress acting in the direction of the axis of a slender member (rod, cable, bar, column) is called axial stress.
The compressive normal stress that is produced when one real surface presses against another is called the bearing stress.
Thus, the stress that exist between the base of the column and the floor is a bearing stress but the compressive stress inside the
column is not a bearing stress.
An important consideration in all analyses is to know whether the calculated values of the variables are reasonable. A sim-
ple mistake, such as forgetting to convert feet to inches or millimeters to meters, can result in values of stress that are incorrect
by orders of magnitude. Less dramatic errors can also be caught if one has a sense of the limiting stress values for a material.
Table 1.2 shows fracture stress values for a few common materials. Fracture stress is the experimentally measured value at
which a material breaks. The numbers are approximate, and + indicates variations of the stress values in each class of material.
The order of magnitude and the relative strength with respect to wood are shown to help you in acquiring a feel for the numbers.
TABLE 1.1 Units of stress
Abbreviation Units Basic Units
psi Pounds per square inch lb/in.2
ksi Kilopounds (kips) per square inch 103
lb/in.2
Pa Pascal N/m2
kPa Kilopascal 103
N/m2
MPa Megapascal 106
N/m2
GPa Gigapascal 109
N/m2
TABLE 1.2 Fracture stress magnitudes
Material ksi MPa Relative to Wood
Metals 90 + 90% 630 + 90% 7.0
Granite 30 + 60% 210 + 60% 2.5
Wood 12 + 25% 84 + 25% 1.0
Glass 9 + 90% 63 + 90% 0.89
Nylon 8 + 10% 56 + 10% 0.67
Rubber 2.7 + 20% 19 + 20% 0.18
Bones 2 + 25% 14 + 25% 0.16
Concrete 6 + 90% 42 + 90% 0.03
Adhesives 0.3 + 60% 2.1 + 60% 0.02
1 4
Printedfrom:http://www.me.mtu.edu/~mavable/MoM2nd
Mechanics of Materials: StressM. Vable
January 2014
EXAMPLE 1.1
A girl whose mass is 40 kg is using a swing set. The diameter of the wire used for constructing the links of the chain is 5 mm. Determine
the average normal stress in the links at the bottom of the swing, assuming that the inertial forces can be neglected.
PLAN
We make an imaginary cut through the chains, draw a free-body diagram, and find the tension T in each chain. The link is cut at two
imaginary surfaces, and hence the internal normal force N is equal to T/2 from which we obtain the average normal stress.
SOLUTION
The cross-sectional area and the weight of the girl can be found as
(E1)
Figure 1.5 shows the free body diagram after an imaginary cut is made through the chains. The tension in the chain and the normal force
at each surface of the link can be found as shown in Equations (E2) and (E3).
(E2)
(E3)
The average normal stress can be found as shown in Equation (E4).
(E4)
ANS.
COMMENTS
1. The stress calculations had two steps. First, we found the internal force by equilibrium; and second we calculated the stress from it.
2. An alternative view is to think that the total material area of the link in each chain is The internal normal
force in each chain is T = 196.2 N thus the average normal stress is as before.
1.1.2 Shear Stress
In Figure 1.6a the double-sided tape used for sticking a hook on the wall must have sufficient bonding strength to support the
weight of the clothes hung from the hook. The free-body diagram shown is created by making an imaginary cut at the wall sur-
Figure 1.4 Girl in a swing, Example 1.2.
A
πd
2
4
---------
π 0.005 m( )
2
4
------------------------------- 19.6 10
6–
( ) m
2
= = = W 40 kg( ) 9.81 m/s
2
( ) 392.4 N= =
T 2N=
2T 392.4 N= or 4N 392.4 N= or N 98.1 N=
Figure 1.5 Free-body diagram of swing.
NN
T
T T
W
σav
N
A
----
98.1 N
19.6 10×
6–
m
2
( )
------------------------------------------ 4.996 10
6
× N/m
2
= = =
σav 5.0 MPa (T)=
2A 39.2 10×
6–
m
2
.=
σav
T
2A
------- = 196.2 39.2 10
6–
×⁄( ) 5 10
6
× N/m
2
,= =
1 5
Printedfrom:http://www.me.mtu.edu/~mavable/MoM2nd
Mechanics of Materials: StressM. Vable
January 2014
face. In Figure 1.6b the paper in the ring binder will tear out if the pull of the hand overcomes the strength of the paper. The
free-body diagram shown is created by making an imaginary cut along the path of the rings as the paper is torn out. In both free-
body diagrams the internal force necessary for equilibrium is parallel (tangent) to the imaginary cut surface. The internal shear
force V divided by the cross sectional area A exposed by the imaginary cut gives us the average intensity of the internal shear
force distribution, which we call the average shear stress:
(1.2)
where τ is the Greek letter tau used to designate shear stress and the subscript av emphasizes that the shear stress is an average
value. We may view τav as a uniformly distributed shear force, which can be replaced by a statically equivalent internal normal
force V. We will develop this viewpoint further in Section 1.1.4.
1.1.3 Pins
Pins are one of the most common example of a structural member in which shear stress is assumed uniform on the imag-
inary surface perpendicular to the pin axis. Bolts, screws, nails, and rivets are often approximated as pins if the primary func-
tion of these mechanical fasteners is the transfer of shear forces from one member to another. However, if the primary
function of these mechanical fasteners is to press two solid bodies into each other (seals) then these fasteners cannot be
approximated as pins as the forces transferred are normal forces.
Shear pins are mechanical fuses designed to break in shear when the force being transferred exceeds a level that would
damage a critical component. In a lawn mower shear pins attach the blades to the transmission shaft and break if the blades hit
a large rock that may bend the transmission shaft.
τav
V
A
----=
Weight
of the
ClothesImaginary cut
between the wall
and the tape
V
Weight
of the
Clothes
τ
τ
Imaginary cut
along the possible path
of the edge of the ring.
Pull
of the
hand
Pull
of the
hand
Pull
of the
hand
τ
τ
τ
V
V
V
Mwall
Mwall
Weight
of the
Clothes
Figure 1.6 Examples of shear stress distribution.
(a) (b)
1 6
Printedfrom:http://www.me.mtu.edu/~mavable/MoM2nd
Mechanics of Materials: StressM. Vable
January 2014
Figure 1.7 shows magnified views of two types of connections at a support. Figure 1.7a shows pin in single shear as a sin-
gle cut between the support and the member will break the connection. Figure 1.7b shows a pin in double shear as two cuts are
needed to break the connection. For the same reaction force, the pin in double shear has a smaller shear stress.
When more than two members (forces) are acting on a pin, it is important to visualize the imaginary surface on which the
shear stress is to be calculated. Figure 1.8a shows a magnified view of a pin connection between three members. The shear
stress on the imaginary cut surface 1 will be different from that on the imaginary cut surface 2, as shown by the free-body dia-
grams in Figure 1.8b.
EXAMPLE 1.2
Two possible configurations for the assembly of a joint in a machine are to be evaluated. The magnified view of the two configurations
with the forces in the members are shown in Figure 1.9. The diameter of the pin is 1 in. Determine which joint assembly is preferred by
calculating the maximum shear stress in the pin for each case.
PLAN
We make imaginary cuts between individual members for the two configurations and draw free-body diagrams to determine the shear
force at each cut. We calculate and compare the shear stresses to determine the maximum shear stress in each configuration.
F F
V
(a)Figure 1.7 Pins in (a) single and (b) double shear.
(b)
F
V
V
F
Figure 1.8 Multiple forces on a pin.
NBN
VBV
NC
VBV
VDV
(b)
Cut 1
(a)
NC
NDN
NBN
Cut 2
NDN
VDV
Configuration 1 Configuration 2
NC = 20 kips
NC = 20 kips
NB = 15 kips
NA=15 kips NA = 15 kips
ND = 20 kips ND = 20 kips
NB = 15 kips
A
B
C D
B
C
D
A
Figure 1.9 Forces on a joint and different joining configurations.
1 7
Printedfrom:http://www.me.mtu.edu/~mavable/MoM2nd
Mechanics of Materials: StressM. Vable
January 2014
SOLUTION
The area of the pin is . Making imaginary cuts between members we can draw the free-body diagrams
and calculate the internal shear force at the imaginary cut, as shown in Figure 1.10.
Configuration 1: From the free-body diagrams in Figure 1.10a
(E1)
We see that the maximum shear force exists between members C and D. Thus the maximum shear stress is
(E2)
Configuration 2: From the free-body diagrams in Figure 1.10b
(E3)
The maximum shear force exists the between C and B. Thus the maximum shear stress is
(E4)
Comparing Equations (E2) and (E3) we conclude
ANS.
COMMENTS
1. Once more note the two steps: we first calculated the internal shear force by equilibrium and then calculated the shear stress from it.
2. The problem emphasizes the importance of visualizing the imaginary cut surface in the calculation of stresses.
3. A simple change in an assembly sequence can cause a joint to fail. This observation is true any time more than two members are
joined together. Gusset plates are often used at the joints such as in bridge shown in Figure 1.11 to eliminate the problems associated
with an assembly sequence.
A π 0.5 in.( )
2
0.7854 in.
2
= =
Imaginary cut between members A and B
NA= 15 kips
V1
Imaginary cut between members B and C
NB = 15 kips
NA= 15 kips
V2
Imaginary cut between members C and D
ND = 20 kips
V3
Imaginary cut between members A and C
Imaginary cut between members C and B
Imaginary cut between members B and D
V1 NA= 15 kips
NC = 20 kips
NA= 15 kips
(V2)y
(V2)x
ND = 20 kips
V3
A
A A
D
A
A
D
B
C
Figure 1.10 Free-body diagrams. (a) Configuration 1. (b) Configuration 2.
(a)
(b)
V1 15 kips= V2 0= V3 20 kips=
τmax = V3 A =⁄ 25.46 ksi.
V1 15 kips= V2( )x
15 kips= V2( )y
20 kips= V2 152 202+ 25 kips.= = V3 20 kips=
τmax V2 A⁄ 31.8 ksi.= =
The configuration 1 is preferred, as it will result in smaller shear stres
Figure 1.11 Use of gusset plates at joints in a bridge truss.
Gusset plate
1 8
Printedfrom:http://www.me.mtu.edu/~mavable/MoM2nd
Mechanics of Materials: StressM. Vable
January 2014
EXAMPLE 1.3
All members of the truss shown in Figure 1.12 have a cross-sectional area of 500 mm2
and all pins have a diameter of 20 mm. Determine:
(a) The axial stresses in members BC and DE, (b) The shear stress in the pin at A, assuming the pin is in double shear.
PLAN
(a) The free-body diagram of joint D can be used to find the internal axial force in member DE. The free body diagram drawn after an
imaginary cut through BC, CF, and EF can be used to find the internal force in member BC. (b) The free-body diagram of the entire truss
can be used to find the support reaction at A, from which the shear stress in the pin at A can be found.
SOLUTION
The cross-sectional areas of pins and members can be calculated as in Equation (E1)
(E1)
(a) Figure 1.13a shows the free-body diagram of joint D. The internal axial force NDE can be found using equilibrium equations as shown
in Equation (E3).
(E2)
(E3)
The axial stress in member DE can be found as shown in Equation (E4).
(E4)
ANS.
Figure 1.13b shows the free-body diagram after an imaginary cut is made through members CB, CF, and EF. By taking the moment
about point F we can find the internal axial force in member CB as shown in Equation (E5).
(E5)
The axial stress in member CB can be found as shown in Equation (E6).
(E6)
ANS.
(b) Figure 1.13c shows the free-body diagram of the entire truss.
By moment equilibrium about point G we obtain
(E7)
The shear force in the pin will be half the force of NAB as it is in double shear. We obtain the shear stress in the pin as
(E8)
ANS.
P ϭ 21 kN
A B
F E DG
C
2 m 2 m 2 m
G
2 m
Figure 1.12 Truss.
Ap
π 0.02 m( )
2
4
---------------------------- 314.2 10
6–
( )m
2
= = Am 500 10
6–
( )m
2
=
NDC 45
o
sin 21 kN– 0= or NDC 29.7 kN=
21 kN
NDE
NDC
D
45°
Figure 1.13 Free-body diagrams.
21 kN
NEFN
NCF
NCB
Ax
GxG
GyG 21
NAB
(a)
(b) (c)
N– DE NDC 45
o
0=cos– or NDE 21– kN=
σDE
NDE
Am
-----------
21 10
3
( ) N–[ ]
500 10
6–
( ) m
2
[ ]
----------------------------------------- 42– 10
6
( ) N/m
2
= = =
σDE 42 MPa (C)=
NCB 2 m( ) 21 kN( )– 4 m( ) 0= or NCB 42 kN=
σCB
NCB
Am
---------- 84 10
6
( ) N/m
2
= =
σCD 84 MPa (T)=
NAB 2 m( ) 21 kN 6 m( ) 0=– or NAB 63 kN=
τA
NAB 2⁄
Ap
-----------------
31.5 10
3
( ) N
314.2 10
6–
( )m
2
------------------------------------- 100 10
6
( ) N/m
2
= = =
τA 100 MPa=
1 9
Printedfrom:http://www.me.mtu.edu/~mavable/MoM2nd
Mechanics of Materials: StressM. Vable
January 2014
COMMENTS
1. We calculated the internal forces in each member before calculating the axial stresses, emphasizing the two steps Figure 1.2 of relat-
ing stresses to external forces.
2. In part (a) we could have solved for the force in BC by noting that EC is a zero force member and by drawing the free-body diagram
of joint C.
PROBLEM SET 1.1
Tensile stress
1.1 In a tug of war, each person shown in Figure P1.1 exerts a force of 200 lb. If the effective diameter of the rope is determine the axial
stress in the rope.
1.2 A weight is being raised using a cable and a pulley, as shown in Figure P1.2. If the weight W = 200 lb, determine the axial stress assuming:
(a) the cable diameter is (b) the cable diameter is
1.3 The cable in Figure P1.2 has a diameter of If the maximum stress in the cable must be limited to 4 ksi (T), what is the maximum
weight that can be lifted?
1.4 The weight W = 250 lb in Figure P1.2. If the maximum stress in the cable must be limited to 5 ksi (T), determine the minimum diameter of
the cable to the nearest
1.5 A 6-kg light shown in Figure P1.5 is hanging from the ceiling by wires of 0.75-mm diameter. Determine the tensile stress in wires AB and
BC.
1.6 An 8-kg light shown in Figure P1.5 is hanging from the ceiling by wires. If the tensile stress in the wires cannot exceed 50 MPa, determine
the minimum diameter of the wire, to the nearest tenth of a millimeter.
1
2
--- in.,
Figure P1.1
1
8
--- in. 1
4
--- in.
W
Figure P1.2
1
5
--- in.
1
16
------ in.
2 m
Light
A A
B
C
2.5m
2.5m
Figure P1.5
1 10
Printedfrom:http://www.me.mtu.edu/~mavable/MoM2nd
Mechanics of Materials: StressM. Vable
January 2014
1.7 Wires of 0.5-mm diameter are to be used for hanging lights such as the one shown in Figure P1.5. If the tensile stress in the wires cannot
exceed 80 MPa, determine the maximum mass of the light that can be hung using these wires.
1.8 A 3 kg picture is hung using a wire of 3 mm diameter, as shown in Figure P1.8. What is the average normal stress in the wires?
1.9 A 5 kg picture is hung using a wire, as shown in Figure P1.8. If the tensile stress in the wires cannot exceed 10MPa, determine the minimum
required diameter of the wire to the nearest millimeter.
1.10 Wires of 16-mil diameter are used for hanging a picture, as shown in Figure P1.8. If the tensile stress in the wire cannot exceed 750 psi,
determine the maximum weight of the picture that can be hung using these wires. 1 mil =
1.11 A board is raised to lean against the left wall using a cable and pulley, as shown in Figure P1.11. Determine the axial stress in the
cable in terms of the length L of the board, the specific weight γ per unit length of the board, the cable diameter d, and the angles θ and α,
shown in Figure P1.11.
Compressive and bearing stresses
1.12 A hollow circular column supporting a building is attached to a metal plate and bolted into the concrete foundation, as shown in Figure
P1.12. The column outside diameter is 100 mm and an inside diameter is 75 mm. The metal plate dimensions are 200 mm × 200 mm × 10 mm. The
load P is estimated at 800 kN. Determine: (a) the compressive stress in the column; (b) the average bearing stress between the metal plate and the
concrete.
1.13 A hollow circular column supporting a building is attached to a metal plate and bolted into the concrete foundation, as shown in Figure
P1.12. The column outside diameter is 4 in. and an inside diameter is 3.5 in. The metal plate dimensions are 10 in. × 10 in. × 0.75 in. If the allow-
able average compressive stress in the column is 30 ksi and the allowable average bearing stress in concrete is 2 ksi, determine the maximum load
P that can be applied to the column.
54o
Figure P1.8
1
1000
------------ in.
␪
␣
Board
Figure P1.11
Metal
Concrete
P
FigureP1.12
1 11
Printedfrom:http://www.me.mtu.edu/~mavable/MoM2nd
Mechanics of Materials: StressM. Vable
January 2014
1.14 A hollow square column supporting a building is attached to a metal plate and bolted into the concrete foundation, as shown in Figure
P1.14. The column has outside dimensions of 120 mm × 120 mm and a thickness of 10 mm. The load P is estimated at 600 kN. The metal plate
dimensions are 250 mm × 250 mm × 15 mm. Determine: (a) the compressive stress in the column; (b) the average bearing stress between the
metal plate and the concrete.
1.15 A column with the cross section shown in Figure P1.15 supports a building. The column is attached to a metal plate and bolted into the
concrete foundation. The load P is estimated at 750 kN. The metal plate dimensions are 300 mm × 300 mm × 20 mm. Determine: (a) the com-
pressive stress in the column; (b) the average bearing stress between the metal plate and the concrete
1.16 A 70-kg person is standing on a bathroom scale that has dimensions of 150 mm × 100 mm × 40 mm (Figures P1.16). Determine the bear-
ing stress between the scale and the floor. Assume the weight of the scale is negligible.
1.17 A 30-ft-tall brick chimney has an outside diameter of 3 ft and a wall thickness of 4 in. (Figure P1.17). If the specific weight of the bricks is
80 lb/ft3
, determine the average bearing stress at the base of the chimney.
Metal
Concrete
P
Figure P1.14
Concrete
160
m
m
Metal
P
10 mm
10 mm
10 mm10 mm
160 mm
FigureP1.15
Figure P1.16
Figure P1.17
30 ft
1 12
Printedfrom:http://www.me.mtu.edu/~mavable/MoM2nd
Mechanics of Materials: StressM. Vable
January 2014
1.18 Determine the average bearing stress at the bottom of the block shown in Figure P1.18 in terms of the specific weight γ and the length dimen-
sions a and h.
1.19 The Washington Monument is an obelisk with a hollow rectangular cross section that tapers along its length. An approximation of the
monument geometry is shown in Figure P1.19. The thickness at the base is 4.5 m and at top it is 2.5 m. The monument is constructed from marble
and granite. Using a specific weight of 28 kN/m3
for these materials, determine the average bearing stress at the base of the monument.
1.20 Show that the average compressive stress due to weight on a cross section at a distance x from the top of the wall in Figure P1.20b is half
that of wall in Figure P1.20a, thus confirming the wisdom of ancient Egyptians in building inward-sloping walls for the pyramids. (Hint: Using γ
the specific weight of wall material, H the height of the wall, t the thickness of the wall, and L the length of the wall, calculate the average com-
pressive stress at any cross section at a distance x from the top for the two walls.).
1.21 The Great pyramid of Giza shown in Figure 1.14d has a base of 757.7 ft x 757.7 ft and a height of 480.9 ft. Assume an average specific
weight of γ = 75 lb/ft3
. Determine (a) the bearing stress at the base of the pyramid. (b) the average compressive stress at mid height.
1.22 The Bent pyramid shown in Figure 1.14c has a base of 188 m x 188 m. The initial slopes of the sides is 54o
27’44”. After a certain height
the slope is 43o
22’. The total height of the pyramid is 105 m. Assume an average mass density of 1200 kg/ m3
. Determine the bearing stress at the
base of the pyramid.
1.23 A steel bolt of 25 mm diameter passes through an aluminum sleeve of thickness 4 mm and outside diameter of 48 mm as shown in Figure
h
a
100a
10h
Figure P1.18
10 m
17 m
169 m
10
m
17
m
Figure P1.19
Figure P1.20 (a) Straight wall (b) Inward sloping tapered wall.
(a)
(b)
H
x
H
t
t
x
L L
1 13
Printedfrom:http://www.me.mtu.edu/~mavable/MoM2nd
Mechanics of Materials: StressM. Vable
January 2014
P1.23. Determine the average normal stress in the sleeve if in the assembled position the bolt has an average normal stress of 100 MPa (T).
Shear stress
1.24 The device shown in Figure P1.24 is used for determining the shear strength of the wood. The dimensions of the wood block are
6 in. × 8 in. × 2 in. If the force required to break the wood block is 15 kips, determine the average shear strength of the wood.
1.25 The dimensions of the wood block in Figure P1.24 are 6 in. × 8 in. × 1.5 in. Estimate the force P that should be applied to break the block
if the average shear strength of the wood is 1.2 ksi.
1.26 The punch and die arrangement shown schematically in Figure P1.26 is used to punch out thin plate objects of different shapes. The cross
section of the punch and die shown in Figure P1.26 is a circle of 1-in. diameter. A force P = 6 kips is applied to the punch. If the plate thickness
t = determine the average shear stress in the plate along the path of the punch.
1.27 The cross section of the punch and die shown in Figure P1.26 is a square of 10 mm × 10 mm. The plate shown has a thickness t = 3 mm
and an average shear strength of 200 MPa. Determine the average force P needed to drive the punch through the plate.
1.28 The schematic of a punch and die for punching washers is shown in Figure P1.28. Determine the force P needed to punch out washers, in
terms of the plate thickness t, the average plate shear strength τ, and the inner and outer diameters of the washers di and do
Figure P1.23
Sleeve
Rigid washers
300 mm
25 mm 25 mm
P
6 in 2 in
6 in
Figure P1.24
1
8
--- in.,
P
Plate
Punch
Die Die
t
Figure P1.26
di
dod
P
Punch
Die Die
t
Figure P1.28
1 14
Printedfrom:http://www.me.mtu.edu/~mavable/MoM2nd
Mechanics of Materials: StressM. Vable
January 2014
1.29 The magnified view of a pin joint in a truss are shown in Figure P1.29. The diameter of the pin is 25 mm. Determine the maximum trans-
verse shear stress in the pin.
Normal and shear stresses
1.30 A weight W = 200 lb. is being raised using a cable and a pulley, as shown in Figure P1.30. The cable effective diameter is and
the pin in the pulley has a diameter of Determine the axial stress in the cable and the shear stress in the pin, assuming the pin is in dou-
ble shear.
1.31 The cable in Figure P1.30 has a diameter of and the pin in the pulley has a diameter of If the maximum normal stress in the
cable must be limited to 4 ksi (T) and the maximum shear stress in the pin is to be limited to 2 ksi, determine the maximum weight that can be
lifted to the nearest lb. The pin is in double shear.
1.32 The manufacturer of the plastic carrier for drywall panels shown in Figure P1.32 prescribes a maximum load P of 200 lb. If the cross-sec-
tional areas at sections AA and BB are 1.3 in.2
and 0.3 in.2,
respectively, determine the average shear stress at section AA and the average normal
stress at section BB at the maximum load P.
1.33 A bolt passing through a piece of wood is shown in Figure P1.33. Determine: (a) the axial stress in the bolt; (b) the average shear stress in
the bolt head; (c) the average bearing stress between the bolt head and the wood; (d) the average shear stress in the wood.
40 kN
30 kN
50 kN
36.9°
Figure P1.29
1
4
--- in.
3
8
--- in.
55°
W
Figure P1.30
1
5
--- in. 3
8
--- in.
Figure P1.32
P
A
A
B B
P ϭ 1.5 kips
3
8
i
in3
4
in1
2
Figure P1.33
1 15
Printedfrom:http://www.me.mtu.edu/~mavable/MoM2nd
Mechanics of Materials: StressM. Vable
January 2014
1.34 A load of P = 10 kips is transferred by the riveted joint shown in Figure P1.34. Determine (a) the average shear stress in the rivet. (b) the
largest average normal stress in the members attached (c) the largest average bearing stress between the pins and members.
1.35 A joint in a wooden structure is shown in Figure P1.35. The dimension and Determine the average normal stress
on plane BEF and average shear stress on plane BCD. Assume plane BEF and the horizontal plane at AB are a smooth surfaces.
1.36 A metal plate welded to an I-beam is securely fastened to the foundation wall using four bolts of 1/2 in. diameter as shown in Figure
P1.36. If P = 12 kips determine the normal and shear stress in each bolt. Assume the load is equally distributed among the four bolts.
1.37 A metal plate welded to an I-beam is securely fastened to the foundation wall using four bolts as shown Figure P1.36. The allowable nor-
mal stress in the bolts is 100 MPa and the allowable shear stress is 70 MPa. Assume the load is equally distributed among the four bolts. If the
beam load P= 50 kN, determine the minimum diameter to the nearest millimeter of the bolts.
1.38 A metal plate welded to an I-beam is securely fastened to the foundation wall using four bolts of 1/2 in. diameter as shown Figure P1.36.
The allowable normal stress in the bolts is 15 ksi and the allowable shear stress is 12 ksi. Assume the load is equally distributed among the four
bolts. Determine the maximum load P to the nearest pound the beam can support.
1.39 An adhesively bonded joint in wood is fabricated as shown in Figure P1.39. The length of the overlap is L= 4 in. and the thickness of the
wood is 3/8 in. Determine the average shear stress in the adhesive..
Figure P1.34
1 in.1 in.P P2 in.
0.5 in.
0.5 in.
0.5 in.
0.5 in. PP
h 4
3
8
--- in.= d 1
1
8
--- in.=
E
4 in
F
10 kips
30Њ
h
d
A
B
C
D
Figure P1.35
Figure P1.36
P
60o
Figure P1.39
1 16
Printedfrom:http://www.me.mtu.edu/~mavable/MoM2nd
Mechanics of Materials: StressM. Vable
January 2014
1.40 A double lap joint adhesively bonds three pieces of wood as shown in Figure P1.40. The joints transmits a force of P= 20 kips and has the
following dimensions: L = 3 in., a = 8 in. and h = 2 in. Determine the maximum average normal stress in the wood and the average shear stress in
the adhesive.
1.41 The wood in the double lap joint of Figure P1.40 has a strength of 15 MPa in tension and the strength of the adhesive in shear is 2 MPa.
The joint has the following dimensions: L = 75 mm, a =200 mm, and h = 50 mm. Determine the maximum force P the joint can transfer.
1.42 A wooden dowel of diameter d = 20 mm is used for constructing the double lap joint in Figure P1.42. The wooden members have a
strength of 10 MPa in tension, the bearing stress between the dowel and the members is to be limited to 18 MPa, the shear strength of the dowel is
25 MPa. The joint has the following dimensions: L = 75 mm, a =200 mm, and h = 50 mm. Determine the maximum force P the joint can transfer.
1.43 A couple is using the chair lift shown in Figure P1.43 to see the Fall colors in Michigan’s Upper Peninsula. The pipes of the chair frame are
1/16 in. thick. Assuming each person weighs 180 lb, determine the average normal stress at section AA and BB and average shear stress at section
CC assuming the chair is moving at a constant speed.
1.44 The axial force P = 12 kips acts on a rectangular member, as shown in Figure P1.44. Determine the average normal and shear stresses on
the inclined plane AA.
Figure P1.40
h/2
h/2
P
L
a
h
P/2
P/2
Figure P1.42
h/2
h/2
P
L
a
h
P/2
P/2
d
Figure P1.43
1.5 in.
2 in.
1/16 in.
1/16 in.
Section CC1.5 in.
B B
80o
A A
2 in.
C
C
P
2 in
P
A
1.5 in
Figure P1.44
1 17
Printedfrom:http://www.me.mtu.edu/~mavable/MoM2nd
Mechanics of Materials: StressM. Vable
January 2014
1.45 A wooden axial member has a cross section of 2 in.× 4 in. The member was glued along line AA and transmits a force of P = 80 kips as
shown in Figure P1.45. Determine the average normal and shear stress on plane AA.
1.46 Two rectangular bars of 10-mm thickness are loaded as shown in Figure P1.46. If the normal stress on plane AA is 180 MPa (C), determine
the force F1 and the normal and shear stresses on plane BB.
1.47 A butt joint is created by welding two plates to transmits a force of P = 250 kN as shown in Figure P1.47. Determine the average normal
and shear stress on the plane AA of the weld.
1.48 A square tube of 1/4 in thickness is welded along the seam and used for transmitting a force of P = 20 kips as shown in Figure P1.48.
Determine average normal and shear stress on the plane AA of the weld.
1.49 (a) In terms of P, a, b, and θ determine the average normal and shear stresses on the inclined plane AA shown in Figure P1.49. (b) Plot the
normal and shear stresses as a function of θ and determine the maximum values of the normal and shear stresses. (c) At what angles of the inclined
plane do the maximum normal and maximum shear stresses occurs.
Figure P1.45
A
A
P
4 in.
40o
50 kN
50 kN
F1 F3
A
A
B
B
75°
65°30 mm
10 mm
60 mm
Figure P1.46
P P
900 mm
50 mm 200 mm60o
60o
Figure P1.47
A
A
Figure P1.48
P
P
30o
2.5 in.
2.5 in.
P
b
P
a
␪
A
A
Figure P1.49
1 18
Printedfrom:http://www.me.mtu.edu/~mavable/MoM2nd
Mechanics of Materials: StressM. Vable
January 2014
1.50 An axial load is applied to a 1-in-diameter circular rod (Figure P1.50). The shear stress on section AA was found to be 20 ksi. The section
AA is at 45o
to the axis of the rod. Determine the applied force P and the average normal stress acting on section AA.
1.51 A simplified model of a child’s arm lifting a weight is shown in Figure P1.51. The cross-sectional area of the biceps muscle is estimated as
2 in2
. Determine the average normal stress in the muscle and the average shear force at the elbow joint A.
1.52 Figure P1.52 shows a truss and the sequence of assembly of members at pins H, G, and F. All members of the truss have cross-sectional
areas of 250 mm2
and all pins have diameters of 15 mm. Determine (a) the axial stresses in members HA, HB, HG, and HC. (b) the maximum
shear stress in pin H.
1.53 Figure P1.52 shows a truss and the sequence of assembly of members at pins H, G, and F. All members of the truss have cross-sectional
areas of 250 mm2
and all pins have diameters of 15 mm. Determine (a) the axial stresses in members FG, FC, FD, and FE. (b) the maximum shear
stress in pin F.
1.54 Figure P1.52 shows a truss and the sequence of assembly of members at pins H, G, and F. All members of the truss have cross-sectional
areas of 200 mm2
and all pins have diameters of 10 mm. Determine (a) the axial stresses in members GH, GC, and GF of the truss shown in Fig-
ure P1.52. (b) the maximum shear stress in pin G
1.55 The pin at C in Figure P1.55 is has a diameter of in. and is in double shear. The cross-sectional areas of members AB and BC are 2 in.2
and 2.5 in.2
, respectively. Determine the axial stress in member AB and the shear stress in pin C.
P P
A
A
Figure P1.50
5 lb
Bone
2 in
AA
Bone
6 ini
7 in7 in
Bicepsmuscle
Figure P1.51
A
B C D
E
F
G
H
30° 30°
4 kN 2 kN 3 kN
3 m 3 m 3 m 3 m
Figure P1.52
HA
HB
HG
HC
Pin H
GH
GC
GF
Pin G Pin F
FG
FC
FD
FE
4 kN 2 kN 3 kN
1
2
---
60°
60 in
66in
80lb/in
AB
CFigure P1.55
1 19
Printedfrom:http://www.me.mtu.edu/~mavable/MoM2nd
Mechanics of Materials: StressM. Vable
January 2014
1.56 All pins shown in Figure P1.56 are in single shear and have diameters of 40 mm. All members have square cross sections and the surface
at E is smooth. Determine the maximum shear stresses in the pins and the axial stress in member BD.
1.57 A student athlete is lifting weight W = 36 lbs as shown in Figure P1.57a. The weight of the athlete is WA = 140 lb. A model of the student
pelvis and legs is shown in Figure P1.57b. The weight of legs and pelvis WL = 32 lb acts at the center of gravity G. Determine the normal stress in
the erector spinae muscle that supports the trunk if the average muscle area at the time of lifting the weight is 1.75 in2
.
1.58 A student is exercising his shoulder muscles using a W = 15 lb dumbbell as shown in Figure P1.58a. The model of the student arm is
shown in Figure P1.58b. The weight of the arm of WA = 9 lb acts at the center of gravity G. Determine the average normal stress in the deltoid
muscle if the average area of the muscle is 0.75 in2
at the time the weight is in the horizontal position.
Design problems
1.59 The bottom screw in the hook shown in Figure P1.59 supports 60% of the load P while the remaining 40% of P is carried by the top screw.
The shear strength of the screws is 50 MPa. Develop a table for the maximum load P that the hook can support for screw diameters that vary from
1 mm to 5 mm in steps of 1 mm.
B
A
3 m
2.5 m
50 mm
150 mm
50 kN/m
2.5 m
D
C
E
200 mm
Figure P1.56
Figure P1.57
(a) (b)
A
B
C
Erector
spinae
muscles
1.5
in
G
A
B
8.2
in
10
in
20 in
Hip Joint
(W+WA)/2
3 in
45o
45o
WL
C
Figure P1.58
(a) (b)
Shoulder
joint
15o
A O
6 in6 in12 in
W WA
deltoid muscle
A
O
G B
P
Figure P1.59
P
1 20
Printedfrom:http://www.me.mtu.edu/~mavable/MoM2nd
Mechanics of Materials: StressM. Vable
January 2014
1.60 Determine the maximum force P that can be transferred by the riveted joint shown in Figure P1.34 if the limits apply: maximum normal
stress in the attached members can be 30 ksi., maximum bearing stress between the pins and members can be 15 ksi, and the maximum shear
stress in the rivet can be 20 ksi.
1.61 A tire swing is suspended using three chains, as shown in Figure P1.61. Each chain makes an angle of 12o
with the vertical. The chain is
made from links as shown. For design purposes assume that more than one person may use the swing, and hence the swing is to be designed to
carry a weight of 500 lb. If the maximum average normal stress in the links is not to exceed 10 ksi, determine to the nearest the diameter of
the wire that should be used for constructing the links.
1.62 Two cast-iron pipes are held together by a bolt, as shown in Figure P1.62. The outer diameters of the two pipes are 50 mm and 70 mm and the
wall thickness of each pipe is 10 mm. The diameter of the bolt is 15 mm. What is the maximum force P this assembly can transmit if the maximum
permissible stresses in the bolt and the cast iron are 200 MPa in shear and 150 MPa in tension, respectively.
1.63 A normal stress of 20 ksi is to be transferred from one plate to another by riveting a plate on top, as shown in Figure P1.63. The shear
strength of the in. rivets used is 40 ksi. Assuming all rivets carry equal shear stress, determine the minimum even number of rivets that must be
used.
1.64 Two possible joining configurations are to be evaluated. The forces on joint in a truss were calculated and a magnified view is shown Figure
P1.64. The pin diameter is 20 mm. Determine which joint assembly is better by calculating the maximum shear stress in the pin for each case.
1
16
------ in.
Figure P1.61
12o
P P
Figure P1.62
1
2
---
␴ ϭ 20 ksi
1 in ␴ ϭ 20 ksi6 in
8in
1 in
1 inFigure P1.63
ND= 30 kN
ND= 30 kN
NB = 67.32 kN
NB = 67.32 kN
NC = 50 kN
NC = 50 kN
NA = 32.68 kN
NA = 32.68 kN
30o
30o
30o
30o
Configuration 1 Configuration 2Figure P1.64
1 21
Printedfrom:http://www.me.mtu.edu/~mavable/MoM2nd
Mechanics of Materials: StressM. Vable
January 2014
1.65 Truss analysis showed the forces at joint A given in Figure P1.65. Determine the sequence in which the three members at joint A should be
assembled so that the shear stress in the pin is minimum.
1.66 An 8 in × 8 in reinforced concrete bar needs to be designed to carry a compressive axial force of 235 kips. The reinforcement is done using
round steel bars. Assuming the normal stress in concrete to be a uniform maximum value of 3 ksi and in steel bars to be a uniform value of 20 ksi,
determine the minimum number of iron bars that are needed.
1.67 A wooden axial member has a cross section of 2 in. × 4 in. The member was glued along line AA, as shown in Figure P1.45. Determine the
maximum force P that can be applied to the repaired axial member if the maximum normal stress in the glue cannot exceed 800 psi and the maxi-
mum shear stress in the glue cannot exceed 350 psi.
1.68 An adhesively bonded joint in wood is fabricated as shown in Figure P1.68. The length of the bonded region L = 5 in. Determine the maxi-
mum force P the joint can support if the shear strength of the adhesive is 300 psi and the wood strength is 6 ksi in tension.
1.69 The joint in Figure P1.68 is to support a force P = 25 kips. What should be the length L of the bonded region if the adhesive strength in
shear is 300 psi?
1.70 The normal stress in the members of the truss shown in Figure P1.70 is to be limited to 160 MPa in tension or compression. All members have
circular cross sections. The shear stress in the pins is to be limited to 250 MPa. Determine (a) the minimum diameters to the nearest millimeter of
members ED, EG, and EF. (b) the minimum diameter of pin E to the nearest millimeter and the sequence of assembly of members ED, EG, and EF.
1.71 The normal stress in the members of the truss shown in Figure P1.70 is to be limited to 160 MPa in tension or compression. All members have
circular cross sections. The shear stress in the pins is to be limited to 250 MPa. Determine (a) the minimum diameters to the nearest millimeter of
members CG, CD, and CB. (b) the minimum diameter of pin C to the nearest millimeter and the sequence of assembly of members CG, CD, and CB.
Stretch yourself
1.72 Truss analysis showed the forces at joint A given in Figure P1.72. Determine the sequence in which the four members at joint A should be
assembled to minimize the shear stress in the pin.
NC ϭ 40 kips
NB ϭ 32.77 kips
35Њ
ND ϭ 22.94 kips
A
Figure P1.65
1
2
----in.
PP
L
8 in
1 in
1 in
1 inFigure P1.68
F
E
DC
G
H
B
A
40 kN
65 kN
4 m
3 m
4 m
3 m
Figure P1.70
A
65Њ
ND ϭ 25 kipsNC ϭ 27.58 kips
NE ϭ 28.34 kipsNB ϭ 40 kips
Figure P1.72
1 22
Printedfrom:http://www.me.mtu.edu/~mavable/MoM2nd
Mechanics of Materials: StressM. Vable
January 2014
MoM in Action: Pyramids
The pyramids of Egypt are a remarkable engineering feat. The size, grandeur, and age of the pyramids
excites the human imagination. Science fiction authors create stories about aliens building them. Pyramid
design, however, is a story about human engineering in a design process that incorporates an intuitive under-
standing of material strength.
Before pyramids were built, Egyptians kings and nobles were buried in tombs called mastaba (Figure
1.14a). Mastaba have underground chambers that are blocked off by dropping heavy stones down vertical
shafts. On top of these underground burial chambers are rectangular structures with inward-sloping, tapered
brick mud walls. The ancient Egyptians had learned by experience that inward-sloping walls that taper
towards the top do not crumble as quickly as straight walls of uniform thickness (see problem 1.20).
Imhotep, the world’s first renowned engineer-architect, took many of the design elements of mastaba to
a very large scale in building the world’s first Step pyramid (Figure 1.14b) for his pharaoh Djozer (2667-
2648 BCE). By building it on a bedrock, Imhotep intuitively understood the importance of bearing stresses
which were not properly accounted for in building of the leaning tower of Pisa 4000 years later. The Step
pyramid rose in six steps to a height of 197 ft with a base of 397 ft x 358 ft. A 92-ft deep central shaft was
dug beneath the base for the granite burial chamber. The slopes of the faces of the Step pyramid varied from
72o
to 78o
. Several pharaohs after Djozer tried to build their own step pyramids but were unsuccessful.
The next development in pyramid design took place in the reign of pharaoh Sneferu (2613-2589 BCE).
Sneferu architects started by building a step pyramid but abandoned it because he wanted a pyramid with
smooth sides. The pyramid shown in Figure 1.14c was started with a base of 617 ft x 617 ft and an initial
slope of approximately 54o
. Signs of structural problem convinced the builders to change the slope to 43o
resulting in the unique bent shape seen in Figure 1.14c (see problem 1.22). Sneferu then ordered a third pyr-
amid built. This pyramid had an initial slope of 43o
, stood on a base of 722 ft x722 ft, rose to a height of
345 ft, and had smooth sides. This experience was used by architects in the reign of Khufu (2589-2566 BCE)
to build the largest pyramid in the world called the Great pyramid of Giza (Figure 1.14d). The Great Pyramid
(see problem 1.21) stands on a base of 756.7 ft x 756.7 ft and has a height of 481 ft.
The ancient Egyptians did not have a formal definition of stress, but they had an intuitive understanding
of the concept of strength. As happens often in engineering design they were able to design and construct
pyramids through trial and error. Modern engineering can reduce this costly and time consuming process by
developing rigorous methodologies and formulas. In this book we will be developing formulas for strength
and stiffness design of structures and machine elements.
Figure 1.14 Pyramids of Egypt (a) Mastaba (b) Step pyramid (c) Bent pyramid (d) Great pyramid of Giza.
(a)
(b)
(c) (d)
1 23
Printedfrom:http://www.me.mtu.edu/~mavable/MoM2nd
Mechanics of Materials: StressM. Vable
January 2014
1.1.4 Internally Distributed Force Systems
In Sections 1.1.1 and 1.1.2 the normal stress and the shear stress were introduced as the average intensity of an internal normal
and shear force distribution, respectively. But what if there are internal moments at a cross section? Would there be normal and
shear stresses at such sections? How are the normal and shear stresses related to internal moments? To answer these questions
and to get a better understanding of the character of normal stress and shear stress, we now consider an alternative and more
fundamental view.
The forces of attraction and repulsion between two particles (atoms or molecules) in a body are assumed to act along the
line that joins the two particles.1
The forces vary inversely as an exponent of the radial distance separating the two particles.
Thus every particle exerts a force on every other particle, as shown symbolically in Figure 1.15a on an imaginary surface of a
body. These forces between particles hold the body together and are referred to as internal forces. The shape of the body
changes when we apply external forces thus changing distance between particles and hence changing the forces between the
particles (internal forces). The body breaks when the change in the internal forces exceeds some characteristic material value.
Thus the strength of the material can be characterized by the measure of change in the intensity of internal forces. This mea-
sure of change in the intensity of internal forces is what we call stress.
In Figure 1.15b we replace all forces that are exerted on any single particle by the resultants of these forces on that parti-
cle. The magnitude and direction of these resultant forces will vary with the location of the particle (point) implying that this
is an internal distributed force system. The intensity of internally distributed forces on an imaginary cut surface of a body is
called the stress on the surface. The internally distributed forces (stress on a surface) can be resolved into normal (perpendic-
ular to the surface) and tangential (parallel to the surface) distribution. The intensity of an internally distributed force that is
normal to the surface of an imaginary cut is called the normal stress on the surface. The intensity of an internally distributed
force that is parallel to the surface of an imaginary cut surface is called the shear stress on the surface.
Normal stress on a surface may be viewed as the internal forces that develop due to the material resistance to the pulling
apart or pushing together of two adjoining planes of an imaginary cut. Like pressure, normal stress is always perpendicular to
the surface of the imaginary cut. But unlike pressure, which can only be compressive, normal stress can be tensile.
1
Forces that act along the line joining two particles are called central forces. The concept of central forces started with Newton’s universal gravitation law, which states: “the force
between two particles is inversely proportional to the square of the radial distance between two particles and acts along the line joining the two particles.” At atomic levels the cen-
tral forces do not vary with the square of the radial distance but with an exponent, which is a power of 8 or 10.
A
B C D
E
(a)
F
␶A
Normal to plane
(a)
FB
FC
FE
FD
FA␴A
␶A
B
E
D
C
A
Tangent in plane
(b)
Normal to plane
Figure 1.15 Internal forces between particles on two sides of an imaginary cut. (a) Forces between particles in a body, shown on par-
ticle A. (b) Resultant force on each particle.
1 24
Printedfrom:http://www.me.mtu.edu/~mavable/MoM2nd
Mechanics of Materials: StressM. Vable
January 2014
Shear stress on a surface may be viewed as the internal forces that develop due to the material resistance to the sliding of
two adjoining planes along the imaginary cut. Like friction, shear stresses act tangent to the plane in the direction opposite to
the impending motion of the surface. But unlike friction, shear stress is not related to the normal forces (stresses).
Now that we have established that the stress on a surface is an internally distributed force system, we are in a position to
answer the questions raised at the beginning of the section. If the normal and shear stresses are constant in magnitude and
direction across the cross section, as shown in Figure 1.16a and b, then these can be replaced by statically equivalent normal
and shear forces. [We obtain the equivalent forms of Equations (1.1) and (1.2).] But if either the magnitude or the direction of
the normal and shear stresses changes across the cross section, then internal bending moments My, Mz and the internal torque
T may be necessary for static equivalency, as shown in Figure 1.16c, d, and e. Figure 1.16 shows some of the stress distribu-
tions we will see in this book. But how do we deduce the variation of stress on a surface when stress is an internal quantity
that cannot be measured directly? The theories in this book that answer this question were developed over a long period of
time using experimental observations, intuition, and logical deduction in an iterative manner. Assumptions have to be made
regarding loading, geometry, and material properties of the structural member in the development of the theory. If the theoret-
ical predictions do not conform to experimental observations, then assumptions have to be modified to include added com-
plexities until the theoretical predictions are consistent with experimental observations. In Section 3.2, we will see the logic
whose two links are shown in Figure 1.2. This logic with assumptions regarding loading, geometry, and material properties
will be used to develop the simplified theories in Chapters 4 through 6.
EXAMPLE 1.4
Figure 1.17 shows a fiber pull-out test that is conducted to determine the shear strength of the interface between the fiber and the resin
matrix in a composite material (see Section 3.12.3). Assuming a uniform shear stress τ at the interface, derive a formula for the shear
stress in terms of the applied force P, the length of fiber L, and the fiber diameter D.
PLAN
The shear stress is acting on the cylindrical surface area of the embedded fiber. The shear stress is uniform and hence can be replaced by
an equivalent shear force V, which we can equate to P.
(a) (b) (c) (d) (e)
Figure 1.16 Static equivalency.
x
y
z
x
y
z
x
y
z
x
y
z
Mz
T
My
Normal stress
linear in y
Normal stress
linear in z
Uniform
shear stress
in tangential
direction.Uniform Normal
Stress σavg
N σ
avg
A= V τ
avg
A=
Uniform Shear
Stress τavg
P
L
D
Resin
Fiber
Figure 1.17 Fiber pull-out test.
1 25
Printedfrom:http://www.me.mtu.edu/~mavable/MoM2nd
Mechanics of Materials: StressM. Vable
January 2014
SOLUTION
Figure 1.18a shows the cylindrical surface of the fiber with the uniform shear stress on the surface. The surface area A is equal to the cir-
cumference multiplied by the fiber length L as shown by the Equation (E1).
(E1)
The shear force is the shear stress multiplied by the surface area,
(E2)
By equilibrium of forces in Figure 1.18b
(E3)
ANS.
COMMENTS
1. First, we replaced an internal distributed force system (shear stress) by an equivalent shear force. Second, we related the internal
shear force to external force by equilibrium.
2. In the preceding test it is implicitly assumed that the strength of the fiber is greater than the interface strength. Otherwise the fiber would
break before it gets pulled out.
3. In a test the force P is increased slowly until the fiber is pulled out. The pull-out force is recorded, and the shear strength can be calcu-
lated.
4. Suppose we have determined the shear strength from our formula for specific dimensions D and L of the fiber. Now we should be able
to predict the force P that a fiber with different dimensions would support. If on conducting the test the experimental value of P is sig-
nificantly different from the value predicted, then our assumption of uniform shear stress in the interface is most likely incorrect.
EXAMPLE 1.5
Figure 1.19 shows a test to determine the shear strength of an adhesive. A torque (a moment along the axis) is applied to two thin cylin-
ders joined together with the adhesive. Assuming a uniform shear stress τ in the adhesive, develop a formula for the adhesive shear stress
τ in terms of the applied torque Text, the cylinder radius R, and the cylinder thickness t.
PLAN
A free body diagram can be constructed after making an imaginary cut through the adhesive layer. On a differential area the internal
shear force can be found and the moment from the internal shear force on the differential area obtained. By integrating we can find the
total internal moment acting on the adhesive, which we can equate to the applied external moment Text.
A πDL=
P
D
L
Figure 1.18 Free body diagrams of the fiber in Example 1.4 (a) with shear stresses,
(b) with equivalent internal shear force.
P
V
(a) (b)
V τA πDL( )τ= =
V P= or πDL( )τ P=
τ P πDL( )⁄=
R
T
T
t
Adhesive
Figure 1.19 Adhesive shear strength test.
Text
Text
1 26
Printedfrom:http://www.me.mtu.edu/~mavable/MoM2nd
Mechanics of Materials: StressM. Vable
January 2014
SOLUTION
We make an imaginary cut through the adhesive and draw the shear stress in the tangential direction, as shown in Figure 1.20a.
The differential area is the differential arc length ds multiplied by the thickness t.
The differential tangential shear force dV is the shear stress multiplied by the differential area.
The differential internal torque (moment) is the moment arm R multiplied by dV, that is,
Noting that , we obtain the total internal torque by integrating over the entire circumference.
(E1)
By equilibrium of moment in Figure 1.20b
(E2)
ANS.
COMMENTS
1. By recording the value of the torque at which the top half of the cylinder separates from the bottom half, we can calculate the shear
strength of the adhesive.
2. The assumption of uniform shear stress can only be justified for thin cylinders. In Chapter 5 we will see that shear stress for thicker cyl-
inders varies linearly in the radial direction.
3. First, we replaced an internal distributed force system (shear stress) by an equivalent internal torque. Second, we related the internal
torque to external torque by equilibrium.
EXAMPLE 1.6
Figure 1.21 shows a drill being used to make a L = 12-in.-deep hole for placing explosive charges in a granite rock. The shear strength of
the granite is τ = 5 ksi. Determine the minimum torque T that must be applied to a drill of radius R = 1-in., assuming a uniform shear
stress along the length of the drill. Neglect the taper at the end.
dV ␶( ) ds
t
T
␶
␶
␶dsss
Figure 1.20 Free-body diagrams in Example 1.5 (a) with shear stress, (b) with equivalent internal torque.
Text
(a) (b)
Text
T
dT RdV Rτtds= =
ds Rdθ=[ ]
T R dV∫ R τt( )R θd∫ τtR
2
θ τtR
2
2π( )=d
0
2π
∫= = =
T Text= or 2πR
2
tτ Text=
τ
Text
2πR
2
t
---------------=
Figure 1.21 Torque on a drill.
12 in
A
␶
TText
1 27
Printedfrom:http://www.me.mtu.edu/~mavable/MoM2nd
Mechanics of Materials: StressM. Vable
January 2014
PLAN
The imaginary cut surface is the surface of the hole in the granite. The shear stress on the surface of the hole would act like a distributed
frictional force on the cylindrical surface of the drill bit. We can find the moment from this frictional force and relate it to the applied
torque.
SOLUTION
The shear stress acts tangential to the cylindrical surface of the drill bit, as shown in Figure 1.22a.
Multiplying the shear stress by the differential surface area ds dx we obtain the differential tangential shear force dV.
Multiplying dV by the moment arm R, we obtain the internal torque , which is due to the shear stress over the
differential surface area.
Integrating over the circumference and the length of the drill, we obtain the total internal torque.
or
(E1)
By equilibrium of moment in Figure 1.22b
(E2)
ANS.
COMMENTS
1. In this example and in Example 1.4 shear stress acted on the outside cylindrical surface. In Example 1.4 we replaced the shear stresses
by just an internal shear force, whereas in this example we replaced the shear stresses by an internal torque. The difference comes
from the direction of the shear stress.
2. In Example 1.5 and in this example the surfaces on which the shear stresses are acting are different. Yet in both examples we replaced the
shear stresses by the equivalent internal torque.
3. The two preceding comments emphasize that before we can define which internal force or which internal moment is statically equiv-
alent to the internal stress distribution, we must specify the direction of stress and the orientation of the surface on which the stress is
acting. We shall develop this concept further in Section 1.2.
T
A
dx
ds
x
R
␶
dV ϭ ␶ dx ds
Figure 1.22 Free body diagram of drill bit in Example 1.6 (a) with shear stress, (b) with equivalent internal torque.
Text
(a) (b)
x
A
T
Text
dT RdV Rτdsdx= =
ds Rdθ=
T R dV∫ R τ( )R θd dx
0
2π
∫0
L
∫ τR
2
θd dx
0
2π
∫0
L
∫ τR
2
2π xd
0
L
∫ 2π 2πτR
2
L= = = = = =
T 2π 5 ksi( ) 1 in.( )
2
12 in.( ) 120π in.·kips= =
Text T=
Text 377 in.·kips=
Consolidate your knowledge
1. In your own words describe stress on a surface.
1 28
Printedfrom:http://www.me.mtu.edu/~mavable/MoM2nd
Mechanics of Materials: StressM. Vable
January 2014
PROBLEM SET 1.2
Internally Distributed Force Systems
1.73 The post shown in Figure P1.73 has a rectangular cross section of 2 in. × 4 in. The length L of the post buried in the ground is 12 in. and the
average shear strength of the soil is 2 psi. Determine the force P needed to pull the post out of the ground.
1.74 The post shown in Figure P1.73 has a circular cross section of 100-mm diameter. The length L of the post buried in the ground is 400 mm.
It took a force of 1250 N to pull the post out of the ground. What was the average shear strength of the soil?
1.75 The cross section of the post shown in Figure P1.73 is an equilateral triangle with each side of dimension a. If the average shear strength of
the soil is τ, determine the force P needed to pull the post out of the ground in terms of τ, L, and a.
QUICK TEST 1.1 Time: 15 minutes Total: 20 points
Answer true or false and justify each answer in one sentence. Grade yourself with the answers given in Appendix E.
Give yourself one point for each correct answer (true or false) and one point for every correct explanation.
1. You can measure stress directly with an instrument the way you measure temperature with a thermometer.
2. There can be only one normal stress component acting on the surface of an imaginary cut.
3. If a shear stress component on the left surface of an imaginary cut is upward, then on the right surface it will be
downward.
4. If a normal stress component puts the left surface of an imaginary cut in tension, then the right surface will be
in compression.
5. The correct way of reporting shear stress is τ = 70 kips.
6. The correct way of reporting positive axial stress is σ = +15 MPa.
7. 1 GPa equals 106
Pa.
8. 1 psi is approximately equal to 7 Pa.
9. A common failure stress value for metals is 10,000 Pa.
10. Stress on a surface is the same as pressure on a surface as both quantities have the same units.
P
Ground
Post
L
Figure P1.73
1 29
Printedfrom:http://www.me.mtu.edu/~mavable/MoM2nd
Mechanics of Materials: StressM. Vable
January 2014
1.76 A force P = 10 lb is applied to the handle of a hammer in an effort to pull a nail out of the wood, as shown in Figure P1.76. The nail has a
diameter of and is buried in wood to a depth of 2 in. Determine the average shear stress acting on the nail.
1.77 Two cast-iron pipes are adhesively bonded together over a length of 200 mm as shown in Figure P1.77. The outer diameters of the two
pipes are 50 mm and 70 mm, and the wall thickness of each pipe is 10 mm. The two pipes separated while transmitting a force of 100 kN. What
was the average shear stress in the adhesive just before the two pipes separated?
1.78 Two cast-iron pipes are adhesively bonded together over a length of 200 mm (Figure P1.78). The outer diameters of the two pipes are 50
mm and 70 mm, and the wall thickness of each pipe is 10 mm. The two pipes separated while transmitting a torque of What was the aver-
age shear stress in the adhesive just before the two pipes separated?
1.79 Two cast-iron pipes are held together by a bolt, as shown in Figure P1.79. The outer diameters of the two pipes are 50 mm and 70 mm, and
the wall thickness of each pipe is 10 mm. The diameter of the bolt is 15 mm. The bolt broke while transmitting a torque of On what sur-
face(s) did the bolt break? What was the average shear stress in the bolt on the surface where it broke?
1.80 The can lid in Figure P1.80a gets punched on two sides AB and AC of an equilateral triangle ABC. Figure P1.80b is the top view showing
relative location of the points. The thickness of the lid is t = 1/64 in. and the lid material can at most support a shear stress of 1800 psi. Assume a
uniform shear stress during punching and point D acts like a pin joint. Use a= 1/2 in., b = 3 in. and c =1/4 in. Determine the minimum force F that
must be applied to the can opener.
1
8
--- in.
Figure P1.76
2 in.
P
12 in.
P P
Figure P1.77
2 kN m.⋅
T
T
Figure P1.78
2 kN·m.
T T
Figure P1.79
Figure P1.80
(a)
(b)B A
C
D
F
E
a
AA
B
C
B
C
D Ea
a
c
b
1 30
Printedfrom:http://www.me.mtu.edu/~mavable/MoM2nd
Mechanics of Materials: StressM. Vable
January 2014
1.81 It is proposed to use diameter bolts in a 10-in.-diameter coupling for transferring a torque of 100 in. · kips from one 4-in.-diameter
shaft onto another (Figure P1.81). The maximum average shear stress in the bolts is to be limited to 20 ksi. How many bolts are needed, and at
what radius should the bolts be placed on the coupling? (Note there are multiple answers.)
1.82 A human hand can comfortably apply a torsional moment of 15 in.·lb (Figure P1.82). (a) What should be the breaking shear strength of a
seal between the lid and the bottle, assuming the lid has a diameter of in. and a height of in.? (b) If the same sealing strength as in part (a) is
used on a lid that is 1 in. in diameter and in. in height, what would be the torque needed to open the bottle?
1.83 The torsional moment on the lid is applied by hand exerting a force F on the handle of bottle opener as shown in Figure P1.83. Assume the
average shear strength of the bond between the lid and the bottle is 10 psi. Determine the minimum force F needed to open the bottle. Use t = 3/
8 in. d = 2 1/2 in. and a = 4 in.
1.2 STRESS AT A POINT
The breaking of a structure starts at the point where the internal force intensity—that is, where stress exceeds some material
characteristic value. This implies that we need to refine our definition of stress on a surface to that of Stress at a Point. But an
infinite number of planes (surfaces) can pass through a point. Which imaginary surface do we shrink to zero? And when we
shrink the surface area to zero, which equation should we use, (1.1) or (1.2)? Both difficulties can be addressed by assigning an
orientation to the imaginary surface and to the internal force on this surface. We label these directions with subscripts for the
stress components, in the same way that subscripts x, y, and z describe the components of vectors.
Figure 1.23 shows a body cut by an imaginary plane that has an outward normal in the i direction. On this surface we
have a differential area ΔAi on which a resultant force acts. ΔFj is the component of the force in the j direction. A component
1
2
----in.
T T
Figure P1.81
11
2
--- 1
2
---
1
2
---
Figure P1.82
Figure P1.83
t
d
F
a
1 31
Printedfrom:http://www.me.mtu.edu/~mavable/MoM2nd
Mechanics of Materials: StressM. Vable
January 2014
of average stress is ΔFj /ΔAi. If we shrink ΔAi to zero we get the definition of a stress component at a point as shown by the
Equation (1.3).
(1.3)
Now when we look at a stress component, the first subscript tells us the orientation of the imaginary surface and the second the
direction of the internal force.
In three dimensions each subscript i and j can refer to an x, y, or z direction. In other words, there are nine possible com-
binations of the two subscripts. This is shown in the stress matrix in Equation (1.4). The diagonal elements in the stress matrix
are the normal stresses and all off-diagonal elements represent the shear stresses.
(1.4)
To specify the stress at a point, we need a magnitude and two directions. In three dimensions we need nine components of
stress, and in two dimensions we need four components of stress to completely define stress at a point. Table 1.3 shows the
number of components needed to specify a scalar, a vector, and stress. Now force, moment, velocity, and acceleration are all
different quantities, but they all are called vectors. In a similar manner, stress belongs to a category called tensors. More spe-
cifically, stress is a second-order tensor,2
where ‘second order’ refers to the exponent in the last row. In this terminology, a
vector is a tensor of order 1, and a scalar is a tensor of order 0.
1.2.1 Sign convention
To obtain the sign of a stress component in Equation (1.3) we establish the following sign convention.
Sign Convention: Differential area ΔAi will be considered positive if the outward normal to the surface is in the
positive i direction. If the outward normal is in the negative i direction, then ΔAi will be considered negative.
We can now deduce the sign for stress. A stress component can be positive in two ways. Both the numerator and the denomina-
tor are positive or both the numerator and the denominator are negative in Equation (1.3). Alternatively, if numerator and the
2
To be labeled as tensor, a quantity must also satisfy certain coordinate transformation properties, which will be discussed briefly in Chapter 8.
TABLE 1.3 Comparison of number of components
Quantity One Dimension Two Dimensions Three Dimensions
Scalar 1 = 10
1 = 20
1 = 30
Vector 1 = 11
2 = 21
3 = 31
Stress 1 = 12
4 = 22
9 = 32
σij
ΔFj
ΔAi
---------
⎝ ⎠
⎛ ⎞
ΔAi 0→
lim=
direction of
outward normal to
imaginary cut surface
direction of
internal force component
i
⌬Ai
⌬Fj
Internal force
Outward normal
Figure 1.23 Stress at a point.
σxx τxy τxz
τyx σyy τyz
τzx τzy σzz
1 32
Printedfrom:http://www.me.mtu.edu/~mavable/MoM2nd
Mechanics of Materials: StressM. Vable
January 2014
denominator in Equation (1.3) have: the same sign the stress component is positive; if they have opposite signs the stress com-
ponent is negative.
We conclude this section with the following points to remember.
• Stress is an internal quantity that has units of force per unit area.
• A stress component at a point is specified by a magnitude and two directions. Stress at a point is a second-order tensor.
• Stress on a surface is specified by a magnitude and only one direction. Stress on a surface thus is a vector.
• The first subscript on stress gives the direction of the outward normal of the imaginary cut surface. The second sub-
script gives the direction of the internal force.
• The sign of a stress component is determined from the direction of the internal force and the direction of the outward
normal to the imaginary cut surface.
1.3 STRESS ELEMENTS
The previous section showed that stress at a point is an abstract quantity. Stress on a surface, however, is easier to visualize as
the intensity of a distributed force on a surface. A stress element is an imaginary object that helps us visualize stress at a point
by constructing surfaces that have outward normals in the coordinate directions. In Cartesian coordinates the stress element is a
cube; in cylindrical or a spherical coordinates the stress element is a fragment of a cylinder or a sphere, respectively. We start
our discussion with the construction of a stress element in Cartesian coordinates to emphasize the basic construction principles.
We can use a similar process to draw stress elements in cylindrical and spherical coordinate systems as demonstrated in Exam-
ple 1.9.
1.3.1 Construction of a Stress Element for Axial Stress
Suppose we wish to visualize a positive stress component σxx at a point that may be generated in an bar under axial forces
shown in Figure 1.24a. Around this point imagine an object that has sides with outward normals in the coordinate direction.
The cube has six surfaces with outward normals that are either in the positive or in the negative coordinate direction, as shown
in Figure 1.24. The first subscript of σxx tells us it must be on the surface that has an outward normal in the x direction. Thus,
the two surfaces on which σxx will be shown are at A and B.
The direction of the outward normal on surface A is in the positive x direction [the denominator is positive in Equation
(1.3)]. For the stress component to be positive on surface A, the force must be in the positive x direction [the numerator must
be positive in Equation (1.3)], as shown in Figure 1.24b.
The direction of the outward normal on surface B is in the negative x direction [the denominator is negative in Equation
(1.3)]. For the stress component to be positive on surface B, the force must be in the negative x direction [the numerator must
be negative in Equation (1.3)], as shown in Figure 1.24b.
The positive stress component σxx are pulling the cube in opposite directions; that is, the cube is in tension due to a posi-
tive normal stress component. We can use this information to draw normal stresses in place of subscripts. A tensile normal
stress will pull the surface away from the interior of the element and a compressive normal stress will push the surface into the
element. As mentioned earlier, normal stresses are usually reported as tension or compression and not as positive or negative.
It should be emphasized that the single arrow used to show the stress component does not imply that the stress component
is a force. Showing the stress components as distributed forces on surfaces A and B as in Figure 1.25 is visually more accurate
Figure 1.24 (a) Axial bar. (b) Stress element for axial stress.
(a) (b)
x
y
z
PP
y
A
σxx
B
x
z
σxx
1 33
Printedfrom:http://www.me.mtu.edu/~mavable/MoM2nd
Mechanics of Materials: StressM. Vable
January 2014
but very tedious to draw every time we need to visualize stress. We will show stress components using single arrows as in Fig-
ure 1.24, but visualize them as shown in Figure 1.25.
1.3.2 Construction of a Stress Element for Plane Stress
Plane stress is one of the two types of two-dimensional simplifications used in mechanics of materials. In Chapter 2 we will
study the other type, plane strain. In Chapter 3 we will study the difference between the two types. By two dimensional we
imply that one of the coordinates does not play a role in the description of the problem. If we choose z to be the coordinate, we
set all stresses with subscript z to zero to get
(1.5)
We assume that the stress components in Equation (1.5) are positive. Let us consider the first row. The first subscript
gives us the direction of the outward normal, which is the x direction. Surfaces A and B in Figure 1.26a have outward normals
in the x direction, and it is on these surfaces that the stress component of the first row will be shown.
The direction of the outward normal on surface A is in the positive x direction [the denominator is positive in Equation
(1.3)]. For the stress component to be positive on surface A, the force must be in the positive direction [the numerator must be
positive in Equation (1.3)], as shown in Figure 1.26a.
The direction of the outward normal on surface B is in the negative x direction [the denominator is negative in Equation
(1.3)]. For the stress component to be positive on surface B, the force must be in the negative direction [the numerator must be
negative in Equation (1.3)], as shown in Figure 1.26a.
Now consider row 2 in the stress matrix in Equation (1.5). From the first subscript we know that the normal to the surface
is in the y direction. Surface C has an outward normal in the positive y direction, therefore all forces on surface C are in the
positive direction of the second subscript, as shown in Figure 1.26a. Surface D has an outward normal in the negative y direc-
tion, therefore all forces on surface D are in the negative direction of the second subscript, as shown in Figure 1.26a.
We note that the plane with outward normal in the z direction is stress-free. Stress-free surfaces are also called free sur-
faces, and these surfaces play an important role in stress analysis.
Figure 1.26b shows the two-dimensional representation of the stress element that will be seen looking down the z axis.
y
Figure 1.25 Stress components are distributed forces on a surface.
σxx
x
z
σxx
σxx τxy 0
τyx σyy 0
0 0 0
x
z
y
dz
dy
␴xx␴␴xx␴
␶xy␶
␴yy␴␴
␴yy␴␴
␶yx␶␶
dx
Figure 1.26 Plane stress: (a) 3-dimensional element (b) 2-dimensional element.
A
B
C
D
A
B
C
D
x
y
σxx
σxx
σyy
σyy
τxy
τxy
τyx
τyx
dy
dx
1 34
Printedfrom:http://www.me.mtu.edu/~mavable/MoM2nd
Mechanics of Materials: StressM. Vable
January 2014
1.4 SYMMETRIC SHEAR STRESSES
If a body is in equilibrium, then all points on the body are in equilibrium. Is the stress element that represents a point on the
body in equilibrium? To answer this question we need to convert the stresses into forces by multiplying by the surface area. We
take a simple problem of plane stress and assume that the cube in Figure 1.26 has lengths of dx, dy, and dz in the coordinate
directions. We draw a two-dimensional picture of the stress cube after multiplying each stress component by the surface area
and get the force diagram of Figure 1.27.3
In Figure 1.27 we note that the equations of force equilibrium are satisfied by the assumed state of stress at a point. We
consider the moment about point O and obtain
(1.6)
We cancel the differential volume (dx dy dz) on both sides to obtain
(1.7a)
In a similar manner we can show that
(1.7b)
(1.7c)
Equations (1.7a) through (1.7c) emphasize that shear stress is symmetric. The symmetry of shear stress implies that in three
dimensions there are only six independent stress components out of the nine components necessary to specify stress at a point.
In two dimensions there are only three independent stress components out of the four components necessary to specify stress at
a point. In Figure 1.26 notice that the shear stress components τxy and τyx point either toward the corners or away from the cor-
ners. This observation can be used in drawing the symmetric pair of shear stresses after drawing the shear stress on one of the
surfaces of the stress cube.
EXAMPLE 1.7
Show the non-zero stress components on the surfaces of the two cubes shown in different coordinate systems in Figure 1.28.
PLAN
We can identify the surface with the outward normal in the direction of the first subscript. Using the sign convention and Equation (1.3)
we draw the force in the direction of the second subscript.
3
Figure 1.27 is only valid if we assume that the stresses are varying very slowly with the x and y coordinates. If this were not true, we would have to account for the increase in
stresses over a differential element. But a more rigorous analysis will also reveal that shear stresses are symmetric, see Problem 1.105.
Figure 1.27 Force diagram for plane stress.
␴yy␴␴ (dx dz)
␴xx␴ (dy dz)
␶yx␶␶ (dx dz)
␶yx␶␶ (dx dz)
␶xy␶ (dy dz)
␴yy␴␴ (dx dz)
␴xx␴ (dy dz)
␶xy␶ (dy dz)
O
dx
dy
τxy dy dz( )dx τyx dx dz( )dy=
τxy τyx=
τyz τzy=
τzx τxz=
y
z x
Cube 1 Cube 2
Figure 1.28 Cubes in different coordinate systems in Example 1.7. z
y
x
σxx 80MPa T( )= τxy 30MPa= 0
τyx 30MPa= σyy 40MPa C( )= 0
0 0 0
1 35
Printedfrom:http://www.me.mtu.edu/~mavable/MoM2nd
Mechanics of Materials: StressM. Vable
January 2014
SOLUTION
Cube 1: The first subscript of σxx and τxy shows that the outward normal is in the x direction; hence these components will be shown on
surfaces C and D in Figure 1.29a.
The outward normal on surface C is in the negative x direction; hence the denominator in Equation (1.3) is negative. Therefore on Figure 1.29a:
• The internal force has to be in the negative x direction to produce a positive (tensile) σxx.
• The internal force has to be in the negative y direction to produce a positive τxy.
The outward normal on surface D is in the positive x direction; hence the denominator in Equation (1.3) is positive. Therefore on Figure 1.29a:
• The internal force has to be in the positive x direction to produce a positive (tensile) σxx.
• The internal force has to be in the positive y direction to produce a positive τxy.
The first subscript of τyx and σyy shows that the outward normal is in the y direction; hence this component will be shown on surfaces A and B.
The outward normal on surface A is in the positive y direction; hence the denominator in Equation (1.3) is positive. Therefore on Figure 1.29a:
• The internal force has to be in the positive x direction to produce a positive τyx.
• The internal force has to be in the negative y direction to produce a negative (compressive) σyy.
The outward normal on surface B is in the negative y direction; hence the denominator in Equation (1.3) is negative. Therefore on Figure 1.29a:
• The internal force has to be in the negative x direction to produce a positive τyx.
• The internal force has to be in the positive y direction to produce a negative (compressive) σyy.
Cube 2: The first subscript of σxx and τxy shows that the outward normal is in the x direction; hence these components will be shown on
surfaces E and F.
The outward normal on surface E is in the negative x direction; hence the denominator in Equation (1.3) is negative. Therefore on Figure 1.29a:
• The internal force has to be in the negative x direction to produce a positive (tensile) σxx.
• The internal force has to be in the negative y direction to produce a positive τxy.
The outward normal on surface F is in the positive x direction; hence the denominator in Equation (1.3) is positive. Therefore on Figure 1.29a:
• The internal force has to be in the positive x direction to produce a positive (tensile) σxx.
• The internal force has to be in the positive y direction to produce a positive τxy.
The first subscript of τyx and σyy shows that the outward normal is in the y direction; hence this component will be shown on surfaces A and B.
The outward normal on surface A is in the negative y direction; hence the denominator in Equation (1.3) is negative. Therefore on Figure 1.29a:
• The internal force has to be in the negative x direction to produce a positive τyx.
• The internal force has to be in the positive y direction to produce a negative (compressive) σyy.
The outward normal on surface B is in the positive y direction; hence the denominator in Equation (1.3) is positive. Therefore on Figure 1.29a:
• The internal force has to be in the positive x direction to produce a positive τyx.
• The internal force has to be in the negative y direction to produce a negative (compressive) σyy.
COMMENTS
1. Figure 1.30 shows the two-dimensional representations of stress cubes shown in Figure 1.29. These two-dimensional representations
are easier to draw but it must be kept in mind that the point is in three-dimensional space with surfaces with outward normals in the z
direction being stress free.
Figure 1.29 Solution of Example 1.7.(a) Cube 1. (b) Cube 2.
80
(a) (b)
z
y
x
D
A
C
B
80
30
3030
4040 30
E
F
y
z
x
A
D
C
B 40
30
80
80
30
30
40
E
F
Figure 1.30 Two-dimensional depiction of the solution of Example 1.7.(a) Cube 1. (b) Cube 2.
(a)
(b)
z
y
x
A
C
80
80
30
30
30
40
40
30
B
D
y
z
x
A
40
30
80
80
30
30
40
E
F
1 36
Printedfrom:http://www.me.mtu.edu/~mavable/MoM2nd
Mechanics of Materials: StressM. Vable
January 2014
2. We note that σxx pulls the surfaces outwards and σyy pushes the surfaces inwards in Figures 1.29 and 1.30 as these are tensile and com-
pressive stresses, respectively. Hence, we can use this information to draw these stress components without using the subscripts.
3. The shear stress τxx and τyx either point towards the corner or away from the corner as seen in Figures 1.29 and 1.30. Using this infor-
mation we can draw the shear stress on the appropriate surfaces after obtaining the direction on one surface using subscripts.
1.5* CONSTRUCTION OF A STRESS ELEMENT IN 3-DIMENSION
We once more visualize a cube with outward normals in the coordinate direction around the point we wish to show our stress
components. The cube has six surfaces with outward normals that are either in the positive or in the negative coordinate direc-
tion, as shown in Figure 1.31. In other words, we have now accounted for the first subscript in our stress definition. We know
that force is in the positive or negative direction of the second subscript. We use our sign convention to show the stress in the
direction of the force on each of the six surfaces.
To demonstrate the construction of the stress element we will assume that all nine stress components in the stress matrix
shown in Figure 1.31a are positive. Let us consider the first row. The first subscript gives us the direction of the outward nor-
mal, which is the x direction. Surfaces A and B in Figure 1.31b have outward normals in the x direction, and it is on these sur-
faces that the stress component of the first row will be shown.
The direction of the outward normal on surface A is in the positive x direction [the denominator is positive in Equation
(1.3)]. For the stress component to be positive on surface A, the force must be in the positive direction [the numerator must be
positive in Equation (1.3)], as shown in Figure 1.31b.
The direction of the outward normal on surface B is in the negative x direction [the denominator is negative in Equation
(1.3)]. For the stress component to be positive on surface B, the force must be in the negative direction [the numerator must be
negative in Equation (1.3)], as shown in Figure 1.31b.
Now consider row 2 in the stress matrix in Figure 1.31a. From the first subscript we know that the normal to the surface
is in the y direction. Surface C has an outward normal in the positive y direction, therefore all forces on surface C are in the
positive direction of the second subscript, as shown in Figure 1.31b. Surface D has an outward normal in the negative y direc-
tion, therefore all forces on surface D are in the negative direction of the second subscript, as shown in Figure 1.31b.
By the same logic, the components of row 3 in the stress matrix are shown on surfaces E and F in Figure 1.31b.
A
␴xx␴
xy
␶xz␶
␶yx␶␶
␶yz␶␶
␴yy␴␴
␶
␶
␶zx␶
␶zy␶
yy
yz␶
␶
C
x
y
z
F
Figure 1.31 Stress cube showing all positive stress components in three dimensions.
σxx
τyx
τzx
τxy
σyy
τzy
τxz
τyz
σzz
(a) (b)
1 37
Printedfrom:http://www.me.mtu.edu/~mavable/MoM2nd
Mechanics of Materials: StressM. Vable
January 2014
EXAMPLE 1.8
Show the nonzero stress components on surfaces A, B, and C of the two cubes shown in different coordinate systems in Figure 1.32.
PLAN
We can identify the surface with the outward normal in the direction of the first subscript. Using the sign convention and Equation (1.3)
we draw the force in the direction of the second subscript.
SOLUTION
Cube 1: The first subscript of σxx, τxy, and τxz shows that the outward normal is in the x direction; hence these components will be shown
on surface C. The outward normal on surface C is in the negative x direction; hence the denominator in Equation (1.3) is negative. There-
fore on Figure 1.33a:
• The internal force has to be in the negative x direction to produce a positive (tensile) σxx.
• The internal force has to be in the negative y direction to produce a positive τxy.
• The internal force has to be in the positive z direction to produce a negative τxz.
The first subscript of τyx shows that the outward normal is in the y direction; hence this component will be shown on surface B. The out-
ward normal on surface B is in the positive y direction; hence the denominator in Equation (1.3) is positive. Therefore on Figure 1.33a:
• The internal force has to be in the positive x direction to produce a positive τyx.
The first subscript of τzx, σzz shows that the outward normal is in the z direction; hence these components will be shown on surface A. The
outward normal on surface A is in the positive z direction; hence the denominator in Equation (1.3) is positive. Therefore on Figure
1.33a:
• The internal force has to be in the negative x direction to produce a negative τzx.
• The internal force has to be in the negative z direction to produce a negative (compressive) σzz.
Cube 2: The first subscript of σxx, τxy, and τxz shows that the outward normal is in the x direction; hence these components will be shown
on surface A. The outward normal on surface A is in the negative x direction; hence the denominator in Equation (1.3) is negative. There-
fore in Figure 1.33b:
• The internal force has to be in the negative x direction to produce a positive (tensile) σxx.
• The internal force has to be in the negative y direction to produce a positive τxy.
• The internal force has to be in the positive z direction to produce a negative τxz.
The first subscript of τyx shows that the outward normal is in the y direction; hence this component will be shown on surface B. The out-
ward normal on surface B is in the negative y direction; hence the denominator in Equation (1.3) is negative. Therefore in Figure 1.33b:
• The internal force has to be in the negative y direction to produce a positive τyx.
The first subscript of τzx, σzz shows that the outward normal is in the z direction; hence these components will be shown on surface C. The
outward normal on surface C is in the positive z direction; hence the denominator in Equation (1.3) is positive. Therefore in Figure
1.33b:
• The internal force has to be in the negative x direction to produce a negative τzx.
• The internal force has to be in the negative z direction to produce a negative (compressive) σzz.
COMMENTS
1. In drawing the normal stresses we could have made use of the fact that σxx is tensile and hence pulls the surface outward. σzz is com-
pressive and hence pushes the surface inward. This is a quicker way of getting the directions of these stress components than the argu-
ments based on signs and subscripts.
Cube 1
z x
yA
B
C
Figure 1.32 Cubes in different coordinate systems.
x
z
y
Cube 2
A
B
C
σxx 80 MPa (T)= τxy 30 MPa= τxz 70 MPa–=
τyx 30 MPa= σyy 0= τyz 0=
τzx 70 MPa–= τzy 0= σzz 40 MPa (C)=
z x
y
A
803033
30
70
70
40
B
C
(a)Figure 1.33 Solution of Example 1.8.
x
z
A
B
y
70
30
30
80
70
40
C
(b)
1 38
Printedfrom:http://www.me.mtu.edu/~mavable/MoM2nd
Mechanics of Materials: StressM. Vable
January 2014
2. Once we have drawn τxy and τxz using the subscripts, we could draw τyx and τzx using the observation that the pair of symmetric shear
stresses point towards or away from the corner formed by the two adjoining surfaces, thus saving some effort in the construction of the
stress element.
EXAMPLE 1.9
Show the following positive stress components on a stress element drawn in the spherical coordinate system shown in Figure 1.34.
PLAN
We construct a stress element with surfaces that have outward normals in the r, θ, and φ directions. The first subscript will identify the
surface on which the row of stress components is to be shown. The second subscript then will show the direction of the stress component
on the surface.
SOLUTION
We draw a stress element with lines in the directions of r, θ, and φ, as shown in Figure 1.35.
The stresses σrr, τrθ, and τrφ will be on surface A in Figure 1.35. The outward normal on surface A is in the positive r direction. Thus
the forces have to be in the positive r, θ, and φ directions to result in positive σrr, τrθ, and τrφ.
The stresses τθr, σθθ, and τθφ will be on surface B in Figure 1.35. The outward normal on surface B is in the negative θ direction.
Thus the forces have to be in the negative r, θ, and φ directions to result in positive τθr, σθθ, and τθφ.
The stresses τφr, τφθ, and σφφ will be on surface C in Figure 1.35. The outward normal on surface C is in the positive φ direction.
Thus the forces have to be in the positive r, θ, and φ directions to result in positive τφr, τφθ, and σφφ.
COMMENT
1. This example demonstrates that use of subscripts in determining the direction of stress components follows the same procedure as in
cartesian coordinates even though the stress element is a fragment of a sphere.
z
r
y
x
␪
␾
Figure 1.34 Stresses in spherical coordinates.
σrr τrθ τrφ
τθr σθθ τθφ
τφr τφθ σφφ
r
␪
␾
␪␪
␶␪␾␶
␶␪␶␶ r
␴␪␪␴
Figure 1.35 Stress element in spherical coordinates.
Consolidate your knowledge
1. In your own words describe stress at a point and how it differs from stress on a surface
1 39
Printedfrom:http://www.me.mtu.edu/~mavable/MoM2nd
Mechanics of Materials: StressM. Vable
January 2014
PROBLEM SET 1.3
Plane Stress: Cartesian Coordinates
1.84 Show the stress components of a point in plane stress on the square in Figure P1.84.
1.85 Show the stress components of a point in plane stress on the square in Figure P1.85.
1.86 Show the stress components of a point in plane stress on the square in Figure P1.86.
1.87 Show the stress components of a point in plane stress on the square in Figure P1.87.
QUICK TEST 1.2 Time: 15 minutes/Total: 20 points
Answer true or false and justify each answer in one sentence. Grade yourself with the answers given in Appendix E. Give
yourself one point for every correct answer (true or false) and one point for every correct explanation.
1. Stress at a point is a vector like stress on a surface.
2. In three dimensions stress has nine components.
3. In three dimensions stress has six independent components.
4. At a point in plane stress there are three independent stress components.
5. At a point in plane stress there are always six zero stress components.
6. If the shear stress on the left surface of an imaginary cut is upward and defined as positive, then on the right
surface of the imaginary cut it is downward and negative.
7. A stress element can be drawn to any scale.
8. A stress element can be drawn at any orientation.
9. Stress components are opposite in direction on the two surfaces of an imaginary cut.
10. Stress components have opposite signs on the two surfaces of an imaginary cut.
y
x
Figure P1.84
σxx 100 MPa (T) τxy 75 MPa–==
τyx 75– MPa σyy 85 MPa (T)==
y
x
Figure P1.85
σxx 85 MPa (C) τxy 75 MPa==
τyx 75 MPa σyy 100 MPa (T)==
y
x
Figure P1.86
σxx 27 ksi (C) τxy 18 ksi==
τyx 18 ksi σyy 85 ksi (T)==
y
x
Figure P1.87
σxx 27 ksi (C) τxy 18 ksi==
τyx 18 ksi σyy 85 ksi (T)==
1 40
Printedfrom:http://www.me.mtu.edu/~mavable/MoM2nd
Mechanics of Materials: StressM. Vable
January 2014
1.88 Show the nonzero stress components on the A, B, and C faces of the cube in Figure P1.88.
1.89 Show the nonzero stress components on the A, B, and C faces of the cube in Figure P1.89.
Plane Stress: Polar Coordinates
1.90 Show the stress components of a point in plane stress on the stress element in polar coordinates in Figure P1.90.
1.91 Show the stress components of a point in plane stress on the stress element in polar coordinates in Figure P1.91.
1.92 Show the stress components of a point in plane stress on the stress element in polar coordinates in Figure P1.92.
1.93 Show the stress components of a point in plane stress on the stress element in polar coordinates in Figure P1.93.
z x
yA
B
C
Figure P1.88
σxx 70 MPa (T) τxy 40– MPa τxz 0===
τyx 40– MPa σyy 85 MPa (C) τyz 0===
τzx 0 τzy 0 σzz 0===
x y
zA
B
C
Figure P1.89
σxx 70 MPa (T) τxy 40– MPa τxz 0===
τyx 40– MPa σyy 85 MPa (C) τyz 0===
τzx 0 τzy 0 σzz 0===
␪
y
r
xFigure P1.90
σrr 125 MPa (T) τrθ 65 MPa–==
τθr 65– MPa σθθ 90 MPa (C)==
␪
y
r
x
Figure P1.91
σrr 125 MPa (T) τrθ 65 MPa–==
τθr 65– MPa σθθ 90 MPa (C)==
␪
y
r
xFigure P1.92
σrr 18 ksi (T) τrθ 12– ksi==
τθr 12– ksi σθθ 25 ksi (C)==
␪
y
r
x
Figure P1.93
σrr 25 ksi (C) τrθ 12 ksi==
τθr 12 ksi σθθ 18 ksi (T)==
1 41
Printedfrom:http://www.me.mtu.edu/~mavable/MoM2nd
Mechanics of Materials: StressM. Vable
January 2014
Stress Element in 3-dimensions
1.94 Show the nonzero stress components on the A, B, and C faces of the cube in Figure P1.94.
1.95 Show the nonzero stress components on the A, B, and C faces of the cube in Figure P1.95.
1.96 Show the nonzero stress components on the A, B, and C faces of the cube in Figure P1.96.
1.97 Show the nonzero stress components on the A, B, and C faces of the cube in Figure P1.97.
1.98 Show the nonzero stress components in the r, θ, and x cylindrical coordinate system on the A, B, and C faces of the stress elements shown
in Figures P1.98.
z
y
xA
B
C
Figure P1.94
σxx 100 MPa (T) τxy 200 MPa= τxz 125 MPa–==
τyx 200 MPa σyy 175 MPa (C)= τyz 225 MPa==
τzx 125– MPa τzy 225 MPa σzz 150 MPa (T)===
y
x
zA
B
C
Figure P1.95
σxx 90 MPa (T) τxy 200 MPa τxz 0===
τyx 200 MPa σyy 175 MPa (T) τyz 225– MPa===
τzx 0 τzy 225– MPa σzz 150 MPa (C)===
z
y
x A
B
C
Figure P1.96
σxx 0 τxy 15ksi τxz 0===
τyx 15 ksi σyy 10 ksi (T) τyz 25– ksi===
τzx 0 τzy 25– ksi σzz 20 ksi (C)===
x
z
y A
B
C
Figure P1.97
σxx 0 τxy 15– ksi τxz 0===
τyx 15– ksi σyy 10 ksi (C) τyz 25 ksi===
τzx 0 τzy 25 ksi σzz 20 ksi (T)===
A
B
C
␪
r
x
Figure P1.98
σrr 150 MPa (T) τrθ 100– MPa τrx 125 MPa===
τθr 100– MPa σθθ 160 MPa (C) τθx 165 MPa===
τxr 125 MPa τxθ 165 MPa σxx 145 MPa (C)===
1 42
Printedfrom:http://www.me.mtu.edu/~mavable/MoM2nd
Mechanics of Materials: StressM. Vable
January 2014
1.99 Show the nonzero stress components in the r, θ, and x cylindrical coordinate system on the A, B, and C faces of the stress elements shown
in P1.99.
1.100 Show the nonzero stress components in the r, θ, and φ spherical coordinate system on the A, B, and C faces of the stress elements shown
in Figure P1.100.
1.101 Show the nonzero stress components in the r, θ, and φ spherical coordinate system on the A, B, and C faces of the stress elements shown
in P1.101.
Stretch yourself
1.102 Show that the normal stress σxx on a surface can be replaced by the equivalent internal normal force N and internal bending moments My
and Mz as shown in Figure P1.102 and given by the equations (1.8a) through (1.8c).
r
x
CCC
A
Figure P1.99
σrr 10 ksi (C) τrθ 22 ksi τrx 32 ksi===
τθr 22 ksi σθθ 0 τθx 25 ksi===
τxr 32 ksi τxθ 25 ksi σxx 20 ksi (T)===
z
r
y
x
AAAFigure P1.100
σrr 150 MPa (T) τrθ 100 MPa τrφ 125 MPa===
τθr 100 MPa σθθ 160 MPa (C) τθφ 175– MPa===
τφr 125 MPa τφθ 175– MPa σφφ 135 MPa (C)===
z
r
y
x
ABFigure P1.101
σrr 0 τrθ 18– ksi τrφ 0===
τθr 18– ksi σθθ 10 ksi (C) τθφ 25 ksi===
τφr 0 τφθ 25 ksi σφφ 20 ksi (T)===
y
z
x
O
Mz
My
N
Figure P1.102
(1.8a)
(1.8b)
(1.8c)
N σxx Ad
A
∫=
My zσxx Ad
A
∫–=
Mz yσxx Ad
A
∫–=
Chap1
Chap1
Chap1
Chap1

More Related Content

What's hot

Fluid mechanics 2nd edition hibbeler solutions manual
Fluid mechanics 2nd edition hibbeler solutions manualFluid mechanics 2nd edition hibbeler solutions manual
Fluid mechanics 2nd edition hibbeler solutions manualGyn172
 
Column Direct Load.ppt
 Column Direct Load.ppt Column Direct Load.ppt
Column Direct Load.pptSafwanRawi1
 
Shear And Moment Diagrams
Shear And Moment DiagramsShear And Moment Diagrams
Shear And Moment DiagramsAmr Hamed
 
Stress&strain part 2
Stress&strain part 2Stress&strain part 2
Stress&strain part 2AHMED SABER
 
Compression test verification_for_a_wood
Compression test verification_for_a_woodCompression test verification_for_a_wood
Compression test verification_for_a_woodSumitThakur755213
 
Approximate Analysis of Statically Indeteminate Structures.pdf
Approximate Analysis of Statically Indeteminate Structures.pdfApproximate Analysis of Statically Indeteminate Structures.pdf
Approximate Analysis of Statically Indeteminate Structures.pdfAshrafZaman33
 
Solution Manual for Structural Analysis 6th SI by Aslam Kassimali
Solution Manual for Structural Analysis 6th SI by Aslam KassimaliSolution Manual for Structural Analysis 6th SI by Aslam Kassimali
Solution Manual for Structural Analysis 6th SI by Aslam Kassimaliphysicsbook
 
Mecanica
MecanicaMecanica
MecanicaGlobal
 
Lecture 4 3 d stress tensor and equilibrium equations
Lecture 4 3 d stress tensor and equilibrium equationsLecture 4 3 d stress tensor and equilibrium equations
Lecture 4 3 d stress tensor and equilibrium equationsDeepak Agarwal
 
44558176 chapter-2-stress-and-strain-axial-loading
44558176 chapter-2-stress-and-strain-axial-loading44558176 chapter-2-stress-and-strain-axial-loading
44558176 chapter-2-stress-and-strain-axial-loadingSaleem Malik
 
Solution manual for mechanics of materials 10th edition hibbeler sample
Solution manual for mechanics of materials 10th edition hibbeler  sampleSolution manual for mechanics of materials 10th edition hibbeler  sample
Solution manual for mechanics of materials 10th edition hibbeler samplezammok
 
Experiment 6 MOS LAB
Experiment 6 MOS LABExperiment 6 MOS LAB
Experiment 6 MOS LABRajat Katiyar
 
Shear Force And Bending Moment In Beams
Shear Force And Bending Moment In BeamsShear Force And Bending Moment In Beams
Shear Force And Bending Moment In BeamsAmr Hamed
 
1. simple stress and strains
1. simple stress and strains1. simple stress and strains
1. simple stress and strainsMahesh_infomatica
 
Simpale stress and simple strain
Simpale stress and simple strainSimpale stress and simple strain
Simpale stress and simple strainKeval Patel
 

What's hot (20)

Fluid mechanics 2nd edition hibbeler solutions manual
Fluid mechanics 2nd edition hibbeler solutions manualFluid mechanics 2nd edition hibbeler solutions manual
Fluid mechanics 2nd edition hibbeler solutions manual
 
Column Direct Load.ppt
 Column Direct Load.ppt Column Direct Load.ppt
Column Direct Load.ppt
 
Shear And Moment Diagrams
Shear And Moment DiagramsShear And Moment Diagrams
Shear And Moment Diagrams
 
Stress&strain part 2
Stress&strain part 2Stress&strain part 2
Stress&strain part 2
 
Compression test verification_for_a_wood
Compression test verification_for_a_woodCompression test verification_for_a_wood
Compression test verification_for_a_wood
 
Approximate Analysis of Statically Indeteminate Structures.pdf
Approximate Analysis of Statically Indeteminate Structures.pdfApproximate Analysis of Statically Indeteminate Structures.pdf
Approximate Analysis of Statically Indeteminate Structures.pdf
 
Solution Manual for Structural Analysis 6th SI by Aslam Kassimali
Solution Manual for Structural Analysis 6th SI by Aslam KassimaliSolution Manual for Structural Analysis 6th SI by Aslam Kassimali
Solution Manual for Structural Analysis 6th SI by Aslam Kassimali
 
Mecanica
MecanicaMecanica
Mecanica
 
Unit 2 stresses in composite sections
Unit 2  stresses in composite sectionsUnit 2  stresses in composite sections
Unit 2 stresses in composite sections
 
Lecture 4 3 d stress tensor and equilibrium equations
Lecture 4 3 d stress tensor and equilibrium equationsLecture 4 3 d stress tensor and equilibrium equations
Lecture 4 3 d stress tensor and equilibrium equations
 
44558176 chapter-2-stress-and-strain-axial-loading
44558176 chapter-2-stress-and-strain-axial-loading44558176 chapter-2-stress-and-strain-axial-loading
44558176 chapter-2-stress-and-strain-axial-loading
 
3 torsion
3 torsion3 torsion
3 torsion
 
Solution manual for mechanics of materials 10th edition hibbeler sample
Solution manual for mechanics of materials 10th edition hibbeler  sampleSolution manual for mechanics of materials 10th edition hibbeler  sample
Solution manual for mechanics of materials 10th edition hibbeler sample
 
Experiment 6 MOS LAB
Experiment 6 MOS LABExperiment 6 MOS LAB
Experiment 6 MOS LAB
 
Shear Force And Bending Moment In Beams
Shear Force And Bending Moment In BeamsShear Force And Bending Moment In Beams
Shear Force And Bending Moment In Beams
 
Stress strain curve
Stress strain curveStress strain curve
Stress strain curve
 
1. simple stress and strains
1. simple stress and strains1. simple stress and strains
1. simple stress and strains
 
2 axial loading
2 axial loading2 axial loading
2 axial loading
 
4 tension test
4 tension test4 tension test
4 tension test
 
Simpale stress and simple strain
Simpale stress and simple strainSimpale stress and simple strain
Simpale stress and simple strain
 

Similar to Chap1

Chapter 1 stress and strain
Chapter 1   stress and strainChapter 1   stress and strain
Chapter 1 stress and strainMohammadNur92
 
Prof.N.B.HUI Lecture of solid mechanics
Prof.N.B.HUI Lecture of solid mechanicsProf.N.B.HUI Lecture of solid mechanics
Prof.N.B.HUI Lecture of solid mechanicshasanth dayala
 
Chapter ii tension & compression 1
Chapter ii tension & compression 1Chapter ii tension & compression 1
Chapter ii tension & compression 1MARTIN ATHIYO
 
Reliability Analysis of the Sectional Beams Due To Distribution of Shearing S...
Reliability Analysis of the Sectional Beams Due To Distribution of Shearing S...Reliability Analysis of the Sectional Beams Due To Distribution of Shearing S...
Reliability Analysis of the Sectional Beams Due To Distribution of Shearing S...researchinventy
 
materials properties
materials propertiesmaterials properties
materials propertiesBilal Khan
 
Chapter-1 Concept of Stress and Strain.pdf
Chapter-1 Concept of Stress and Strain.pdfChapter-1 Concept of Stress and Strain.pdf
Chapter-1 Concept of Stress and Strain.pdfBereketAdugna
 
Simple Stress and Strain
Simple Stress and StrainSimple Stress and Strain
Simple Stress and StrainMsheer Bargaray
 
Strength of Materials_ Beginner's Guide.pdf
Strength of Materials_ Beginner's Guide.pdfStrength of Materials_ Beginner's Guide.pdf
Strength of Materials_ Beginner's Guide.pdfronbilaosstudent
 
MECHANICS OF MATERIALS Chapter 01.pdf SLIDES
MECHANICS OF MATERIALS  Chapter 01.pdf SLIDESMECHANICS OF MATERIALS  Chapter 01.pdf SLIDES
MECHANICS OF MATERIALS Chapter 01.pdf SLIDESSamraKhalid20
 
Strengthofmaterialsbyskmondal 130102103545-phpapp02
Strengthofmaterialsbyskmondal 130102103545-phpapp02Strengthofmaterialsbyskmondal 130102103545-phpapp02
Strengthofmaterialsbyskmondal 130102103545-phpapp02Priyabrata Behera
 
Som complete unit 01 notes
Som complete unit 01 notesSom complete unit 01 notes
Som complete unit 01 notessistec
 
Thesis - Design a Planar Simple Shear Test for Characterizing Large Strange B...
Thesis - Design a Planar Simple Shear Test for Characterizing Large Strange B...Thesis - Design a Planar Simple Shear Test for Characterizing Large Strange B...
Thesis - Design a Planar Simple Shear Test for Characterizing Large Strange B...Marshal Fulford
 
Mechanics of materials
Mechanics of materialsMechanics of materials
Mechanics of materialsSelf-employed
 
Chapter1 ME slid show (2).pptx
Chapter1 ME slid show (2).pptxChapter1 ME slid show (2).pptx
Chapter1 ME slid show (2).pptxIsIskandar7
 

Similar to Chap1 (20)

Chapter 1 stress and strain
Chapter 1   stress and strainChapter 1   stress and strain
Chapter 1 stress and strain
 
Prof.N.B.HUI Lecture of solid mechanics
Prof.N.B.HUI Lecture of solid mechanicsProf.N.B.HUI Lecture of solid mechanics
Prof.N.B.HUI Lecture of solid mechanics
 
Chapter ii tension & compression 1
Chapter ii tension & compression 1Chapter ii tension & compression 1
Chapter ii tension & compression 1
 
Reliability Analysis of the Sectional Beams Due To Distribution of Shearing S...
Reliability Analysis of the Sectional Beams Due To Distribution of Shearing S...Reliability Analysis of the Sectional Beams Due To Distribution of Shearing S...
Reliability Analysis of the Sectional Beams Due To Distribution of Shearing S...
 
materials properties
materials propertiesmaterials properties
materials properties
 
Chapter-1 Concept of Stress and Strain.pdf
Chapter-1 Concept of Stress and Strain.pdfChapter-1 Concept of Stress and Strain.pdf
Chapter-1 Concept of Stress and Strain.pdf
 
Simple Stress and Strain
Simple Stress and StrainSimple Stress and Strain
Simple Stress and Strain
 
Chap02-A.pdf
Chap02-A.pdfChap02-A.pdf
Chap02-A.pdf
 
Unit 1- simple stress and strain
Unit 1- simple stress and strainUnit 1- simple stress and strain
Unit 1- simple stress and strain
 
Strength of Materials_ Beginner's Guide.pdf
Strength of Materials_ Beginner's Guide.pdfStrength of Materials_ Beginner's Guide.pdf
Strength of Materials_ Beginner's Guide.pdf
 
Mm210(2)
Mm210(2)Mm210(2)
Mm210(2)
 
MECHANICS OF MATERIALS Chapter 01.pdf SLIDES
MECHANICS OF MATERIALS  Chapter 01.pdf SLIDESMECHANICS OF MATERIALS  Chapter 01.pdf SLIDES
MECHANICS OF MATERIALS Chapter 01.pdf SLIDES
 
Geomechanics for Petroleum Engineers
Geomechanics for Petroleum EngineersGeomechanics for Petroleum Engineers
Geomechanics for Petroleum Engineers
 
Ch04 ssm
Ch04 ssmCh04 ssm
Ch04 ssm
 
2- Stress.pdf
2- Stress.pdf2- Stress.pdf
2- Stress.pdf
 
Strengthofmaterialsbyskmondal 130102103545-phpapp02
Strengthofmaterialsbyskmondal 130102103545-phpapp02Strengthofmaterialsbyskmondal 130102103545-phpapp02
Strengthofmaterialsbyskmondal 130102103545-phpapp02
 
Som complete unit 01 notes
Som complete unit 01 notesSom complete unit 01 notes
Som complete unit 01 notes
 
Thesis - Design a Planar Simple Shear Test for Characterizing Large Strange B...
Thesis - Design a Planar Simple Shear Test for Characterizing Large Strange B...Thesis - Design a Planar Simple Shear Test for Characterizing Large Strange B...
Thesis - Design a Planar Simple Shear Test for Characterizing Large Strange B...
 
Mechanics of materials
Mechanics of materialsMechanics of materials
Mechanics of materials
 
Chapter1 ME slid show (2).pptx
Chapter1 ME slid show (2).pptxChapter1 ME slid show (2).pptx
Chapter1 ME slid show (2).pptx
 

More from Krm Chari

Ancient nepal 144_03
Ancient nepal 144_03Ancient nepal 144_03
Ancient nepal 144_03Krm Chari
 
Buildingworkmethodstatement cm-ms-bw-001-141120013134-conversion-gate01(1)
Buildingworkmethodstatement cm-ms-bw-001-141120013134-conversion-gate01(1)Buildingworkmethodstatement cm-ms-bw-001-141120013134-conversion-gate01(1)
Buildingworkmethodstatement cm-ms-bw-001-141120013134-conversion-gate01(1)Krm Chari
 
Depreciation chart-11-12-fy
Depreciation chart-11-12-fyDepreciation chart-11-12-fy
Depreciation chart-11-12-fyKrm Chari
 
Ultimate strength
Ultimate strengthUltimate strength
Ultimate strengthKrm Chari
 
Presentation
PresentationPresentation
PresentationKrm Chari
 
Untitled Presentation
Untitled PresentationUntitled Presentation
Untitled PresentationKrm Chari
 
Masonry homes construction manual
Masonry homes construction manualMasonry homes construction manual
Masonry homes construction manualKrm Chari
 
Unit costs for standard bid items & special provision items
Unit costs for standard bid items & special provision itemsUnit costs for standard bid items & special provision items
Unit costs for standard bid items & special provision itemsKrm Chari
 

More from Krm Chari (10)

Ancient nepal 144_03
Ancient nepal 144_03Ancient nepal 144_03
Ancient nepal 144_03
 
Cib15834(1)
Cib15834(1)Cib15834(1)
Cib15834(1)
 
Buildingworkmethodstatement cm-ms-bw-001-141120013134-conversion-gate01(1)
Buildingworkmethodstatement cm-ms-bw-001-141120013134-conversion-gate01(1)Buildingworkmethodstatement cm-ms-bw-001-141120013134-conversion-gate01(1)
Buildingworkmethodstatement cm-ms-bw-001-141120013134-conversion-gate01(1)
 
Depreciation chart-11-12-fy
Depreciation chart-11-12-fyDepreciation chart-11-12-fy
Depreciation chart-11-12-fy
 
Brochure
BrochureBrochure
Brochure
 
Ultimate strength
Ultimate strengthUltimate strength
Ultimate strength
 
Presentation
PresentationPresentation
Presentation
 
Untitled Presentation
Untitled PresentationUntitled Presentation
Untitled Presentation
 
Masonry homes construction manual
Masonry homes construction manualMasonry homes construction manual
Masonry homes construction manual
 
Unit costs for standard bid items & special provision items
Unit costs for standard bid items & special provision itemsUnit costs for standard bid items & special provision items
Unit costs for standard bid items & special provision items
 

Recently uploaded

Current Transformer Drawing and GTP for MSETCL
Current Transformer Drawing and GTP for MSETCLCurrent Transformer Drawing and GTP for MSETCL
Current Transformer Drawing and GTP for MSETCLDeelipZope
 
Call Girls Delhi {Jodhpur} 9711199012 high profile service
Call Girls Delhi {Jodhpur} 9711199012 high profile serviceCall Girls Delhi {Jodhpur} 9711199012 high profile service
Call Girls Delhi {Jodhpur} 9711199012 high profile servicerehmti665
 
Architect Hassan Khalil Portfolio for 2024
Architect Hassan Khalil Portfolio for 2024Architect Hassan Khalil Portfolio for 2024
Architect Hassan Khalil Portfolio for 2024hassan khalil
 
main PPT.pptx of girls hostel security using rfid
main PPT.pptx of girls hostel security using rfidmain PPT.pptx of girls hostel security using rfid
main PPT.pptx of girls hostel security using rfidNikhilNagaraju
 
GDSC ASEB Gen AI study jams presentation
GDSC ASEB Gen AI study jams presentationGDSC ASEB Gen AI study jams presentation
GDSC ASEB Gen AI study jams presentationGDSCAESB
 
Artificial-Intelligence-in-Electronics (K).pptx
Artificial-Intelligence-in-Electronics (K).pptxArtificial-Intelligence-in-Electronics (K).pptx
Artificial-Intelligence-in-Electronics (K).pptxbritheesh05
 
Introduction to Microprocesso programming and interfacing.pptx
Introduction to Microprocesso programming and interfacing.pptxIntroduction to Microprocesso programming and interfacing.pptx
Introduction to Microprocesso programming and interfacing.pptxvipinkmenon1
 
chaitra-1.pptx fake news detection using machine learning
chaitra-1.pptx  fake news detection using machine learningchaitra-1.pptx  fake news detection using machine learning
chaitra-1.pptx fake news detection using machine learningmisbanausheenparvam
 
Past, Present and Future of Generative AI
Past, Present and Future of Generative AIPast, Present and Future of Generative AI
Past, Present and Future of Generative AIabhishek36461
 
CCS355 Neural Network & Deep Learning UNIT III notes and Question bank .pdf
CCS355 Neural Network & Deep Learning UNIT III notes and Question bank .pdfCCS355 Neural Network & Deep Learning UNIT III notes and Question bank .pdf
CCS355 Neural Network & Deep Learning UNIT III notes and Question bank .pdfAsst.prof M.Gokilavani
 
Gfe Mayur Vihar Call Girls Service WhatsApp -> 9999965857 Available 24x7 ^ De...
Gfe Mayur Vihar Call Girls Service WhatsApp -> 9999965857 Available 24x7 ^ De...Gfe Mayur Vihar Call Girls Service WhatsApp -> 9999965857 Available 24x7 ^ De...
Gfe Mayur Vihar Call Girls Service WhatsApp -> 9999965857 Available 24x7 ^ De...srsj9000
 
VICTOR MAESTRE RAMIREZ - Planetary Defender on NASA's Double Asteroid Redirec...
VICTOR MAESTRE RAMIREZ - Planetary Defender on NASA's Double Asteroid Redirec...VICTOR MAESTRE RAMIREZ - Planetary Defender on NASA's Double Asteroid Redirec...
VICTOR MAESTRE RAMIREZ - Planetary Defender on NASA's Double Asteroid Redirec...VICTOR MAESTRE RAMIREZ
 
Oxy acetylene welding presentation note.
Oxy acetylene welding presentation note.Oxy acetylene welding presentation note.
Oxy acetylene welding presentation note.eptoze12
 
Study on Air-Water & Water-Water Heat Exchange in a Finned Tube Exchanger
Study on Air-Water & Water-Water Heat Exchange in a Finned Tube ExchangerStudy on Air-Water & Water-Water Heat Exchange in a Finned Tube Exchanger
Study on Air-Water & Water-Water Heat Exchange in a Finned Tube ExchangerAnamika Sarkar
 
Internship report on mechanical engineering
Internship report on mechanical engineeringInternship report on mechanical engineering
Internship report on mechanical engineeringmalavadedarshan25
 
VIP Call Girls Service Hitech City Hyderabad Call +91-8250192130
VIP Call Girls Service Hitech City Hyderabad Call +91-8250192130VIP Call Girls Service Hitech City Hyderabad Call +91-8250192130
VIP Call Girls Service Hitech City Hyderabad Call +91-8250192130Suhani Kapoor
 

Recently uploaded (20)

Current Transformer Drawing and GTP for MSETCL
Current Transformer Drawing and GTP for MSETCLCurrent Transformer Drawing and GTP for MSETCL
Current Transformer Drawing and GTP for MSETCL
 
Call Girls Delhi {Jodhpur} 9711199012 high profile service
Call Girls Delhi {Jodhpur} 9711199012 high profile serviceCall Girls Delhi {Jodhpur} 9711199012 high profile service
Call Girls Delhi {Jodhpur} 9711199012 high profile service
 
Design and analysis of solar grass cutter.pdf
Design and analysis of solar grass cutter.pdfDesign and analysis of solar grass cutter.pdf
Design and analysis of solar grass cutter.pdf
 
Architect Hassan Khalil Portfolio for 2024
Architect Hassan Khalil Portfolio for 2024Architect Hassan Khalil Portfolio for 2024
Architect Hassan Khalil Portfolio for 2024
 
main PPT.pptx of girls hostel security using rfid
main PPT.pptx of girls hostel security using rfidmain PPT.pptx of girls hostel security using rfid
main PPT.pptx of girls hostel security using rfid
 
GDSC ASEB Gen AI study jams presentation
GDSC ASEB Gen AI study jams presentationGDSC ASEB Gen AI study jams presentation
GDSC ASEB Gen AI study jams presentation
 
Call Us -/9953056974- Call Girls In Vikaspuri-/- Delhi NCR
Call Us -/9953056974- Call Girls In Vikaspuri-/- Delhi NCRCall Us -/9953056974- Call Girls In Vikaspuri-/- Delhi NCR
Call Us -/9953056974- Call Girls In Vikaspuri-/- Delhi NCR
 
9953056974 Call Girls In South Ex, Escorts (Delhi) NCR.pdf
9953056974 Call Girls In South Ex, Escorts (Delhi) NCR.pdf9953056974 Call Girls In South Ex, Escorts (Delhi) NCR.pdf
9953056974 Call Girls In South Ex, Escorts (Delhi) NCR.pdf
 
Artificial-Intelligence-in-Electronics (K).pptx
Artificial-Intelligence-in-Electronics (K).pptxArtificial-Intelligence-in-Electronics (K).pptx
Artificial-Intelligence-in-Electronics (K).pptx
 
Introduction to Microprocesso programming and interfacing.pptx
Introduction to Microprocesso programming and interfacing.pptxIntroduction to Microprocesso programming and interfacing.pptx
Introduction to Microprocesso programming and interfacing.pptx
 
chaitra-1.pptx fake news detection using machine learning
chaitra-1.pptx  fake news detection using machine learningchaitra-1.pptx  fake news detection using machine learning
chaitra-1.pptx fake news detection using machine learning
 
Past, Present and Future of Generative AI
Past, Present and Future of Generative AIPast, Present and Future of Generative AI
Past, Present and Future of Generative AI
 
CCS355 Neural Network & Deep Learning UNIT III notes and Question bank .pdf
CCS355 Neural Network & Deep Learning UNIT III notes and Question bank .pdfCCS355 Neural Network & Deep Learning UNIT III notes and Question bank .pdf
CCS355 Neural Network & Deep Learning UNIT III notes and Question bank .pdf
 
Gfe Mayur Vihar Call Girls Service WhatsApp -> 9999965857 Available 24x7 ^ De...
Gfe Mayur Vihar Call Girls Service WhatsApp -> 9999965857 Available 24x7 ^ De...Gfe Mayur Vihar Call Girls Service WhatsApp -> 9999965857 Available 24x7 ^ De...
Gfe Mayur Vihar Call Girls Service WhatsApp -> 9999965857 Available 24x7 ^ De...
 
young call girls in Rajiv Chowk🔝 9953056974 🔝 Delhi escort Service
young call girls in Rajiv Chowk🔝 9953056974 🔝 Delhi escort Serviceyoung call girls in Rajiv Chowk🔝 9953056974 🔝 Delhi escort Service
young call girls in Rajiv Chowk🔝 9953056974 🔝 Delhi escort Service
 
VICTOR MAESTRE RAMIREZ - Planetary Defender on NASA's Double Asteroid Redirec...
VICTOR MAESTRE RAMIREZ - Planetary Defender on NASA's Double Asteroid Redirec...VICTOR MAESTRE RAMIREZ - Planetary Defender on NASA's Double Asteroid Redirec...
VICTOR MAESTRE RAMIREZ - Planetary Defender on NASA's Double Asteroid Redirec...
 
Oxy acetylene welding presentation note.
Oxy acetylene welding presentation note.Oxy acetylene welding presentation note.
Oxy acetylene welding presentation note.
 
Study on Air-Water & Water-Water Heat Exchange in a Finned Tube Exchanger
Study on Air-Water & Water-Water Heat Exchange in a Finned Tube ExchangerStudy on Air-Water & Water-Water Heat Exchange in a Finned Tube Exchanger
Study on Air-Water & Water-Water Heat Exchange in a Finned Tube Exchanger
 
Internship report on mechanical engineering
Internship report on mechanical engineeringInternship report on mechanical engineering
Internship report on mechanical engineering
 
VIP Call Girls Service Hitech City Hyderabad Call +91-8250192130
VIP Call Girls Service Hitech City Hyderabad Call +91-8250192130VIP Call Girls Service Hitech City Hyderabad Call +91-8250192130
VIP Call Girls Service Hitech City Hyderabad Call +91-8250192130
 

Chap1

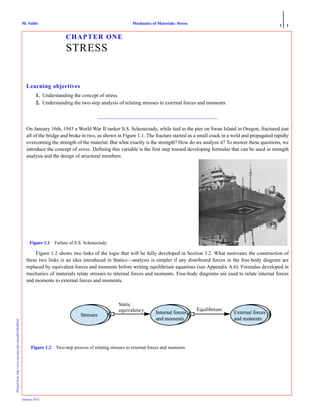
  • 1. 1 1 Printedfrom:http://www.me.mtu.edu/~mavable/MoM2nd Mechanics of Materials: StressM. Vable January 2014 CHAPTER ONE STRESS Learning objectives 1. Understanding the concept of stress. 2. Understanding the two-step analysis of relating stresses to external forces and moments. _______________________________________________ On January 16th, 1943 a World War II tanker S.S. Schenectady, while tied to the pier on Swan Island in Oregon, fractured just aft of the bridge and broke in two, as shown in Figure 1.1. The fracture started as a small crack in a weld and propagated rapidly overcoming the strength of the material. But what exactly is the strength? How do we analyze it? To answer these questions, we introduce the concept of stress. Defining this variable is the first step toward developing formulas that can be used in strength analysis and the design of structural members. Figure 1.2 shows two links of the logic that will be fully developed in Section 3.2. What motivates the construction of these two links is an idea introduced in Statics—analysis is simpler if any distributed forces in the free-body diagram are replaced by equivalent forces and moments before writing equilibrium equations (see Appendix A.6). Formulas developed in mechanics of materials relate stresses to internal forces and moments. Free-body diagrams are used to relate internal forces and moments to external forces and moments. Figure 1.1 Failure of S.S. Schenectady. Figure 1.2 Two-step process of relating stresses to external forces and moments. Static equivalency Equilibrium
  • 2. 1 2 Printedfrom:http://www.me.mtu.edu/~mavable/MoM2nd Mechanics of Materials: StressM. Vable January 2014 1.1 STRESS ON A SURFACE The stress on a surface is an internally distributed force system that can be resolved into two components: normal (perpendicu- lar) to the imaginary cut surface, called normal stress, and tangent (parallel) to the imaginary cut surface, called shear stress. 1.1.1 Normal Stress In Figure 1.3, the cable of the chandelier and the columns supporting the building must be strong enough to support the weight of the chandelier and the weight of the building, respectively. If we make an imaginary cut and draw the free-body diagrams, we see that forces normal to the imaginary cut are needed to balance the weight. The internal normal force N divided by the area of the cross section A exposed by the imaginary cut gives us the average intensity of an internal normal force distribution, which we call the average normal stress: (1.1) where σ is the Greek letter sigma used to designate normal stress and the subscript av emphasizes that the normal stress is an average value. We may view σav as a uniformly distributed normal force, as shown in Figure 1.3, which can be replaced by a statically equivalent internal normal force. We will develop this viewpoint further in Section 1.1.4. Notice that N is in boldface italics, as are all internal forces (and moments) in this book. Equation (1.1) is consistent with our intuitive understanding of strength. Consider the following two observations. (i) We know that if we keep increasing the force on a body, then the body will eventually break. Thus we expect the quantifier for strength (stress) to increase in value with the increase of force until it reaches a critical value. In other words, we expect stress to be directly proportional to force, as in Equation (1.1). (ii) If we compare two bodies that are identical in all respects except that one is thicker than the other, then we expect that the thicker body is stronger. Thus, for a given force, as the body gets thicker (larger cross-sectional area), we move away from the critical breaking value, and the value of the quantifier of strength should decrease. In other words, stress should vary inversely with the cross-sectional area, as in Equation (1.1). Equation (1.1) shows that the unit of stress is force per unit area. Table 1.1 lists the various units of stress used in this book. It should be noted that 1 psi is equal to 6.895 kPa, or approximately 7 kPa. Alternatively, 1 kPa is equal to 0.145 psi, or σav N A ----= Tensile Normal Force Compressive Normal Force Imaginary Cut Chandelier Weight Building Weight Imaginary Cut Chandelier Weight Tensile Normal Stress Building Weight Compressive Normal Stress N N N N σavg σavg σavg σavg Figure 1.3 Examples of normal stress distribution.
  • 3. 1 3 Printedfrom:http://www.me.mtu.edu/~mavable/MoM2nd Mechanics of Materials: StressM. Vable January 2014 approximately 0.15 psi. Normal stress that pulls the imaginary surface away from the material is called tensile stress, as shown on the cable of the chandelier in Figure 1.3. Normal stress that pushes the imaginary surface into the material is called compressive stress, as shown on the column. In other words, tensile stress acts in the direction of the outward normal whereas compressive stress is opposite to the direction of the outward normal to the imaginary surface. Normal stress is usually reported as tensile or compressive and not as positive or negative. Thus σ = 100 MPa (T) or σ = 10 ksi (C) are the preferred ways of reporting tensile or compressive normal stresses. The normal stress acting in the direction of the axis of a slender member (rod, cable, bar, column) is called axial stress. The compressive normal stress that is produced when one real surface presses against another is called the bearing stress. Thus, the stress that exist between the base of the column and the floor is a bearing stress but the compressive stress inside the column is not a bearing stress. An important consideration in all analyses is to know whether the calculated values of the variables are reasonable. A sim- ple mistake, such as forgetting to convert feet to inches or millimeters to meters, can result in values of stress that are incorrect by orders of magnitude. Less dramatic errors can also be caught if one has a sense of the limiting stress values for a material. Table 1.2 shows fracture stress values for a few common materials. Fracture stress is the experimentally measured value at which a material breaks. The numbers are approximate, and + indicates variations of the stress values in each class of material. The order of magnitude and the relative strength with respect to wood are shown to help you in acquiring a feel for the numbers. TABLE 1.1 Units of stress Abbreviation Units Basic Units psi Pounds per square inch lb/in.2 ksi Kilopounds (kips) per square inch 103 lb/in.2 Pa Pascal N/m2 kPa Kilopascal 103 N/m2 MPa Megapascal 106 N/m2 GPa Gigapascal 109 N/m2 TABLE 1.2 Fracture stress magnitudes Material ksi MPa Relative to Wood Metals 90 + 90% 630 + 90% 7.0 Granite 30 + 60% 210 + 60% 2.5 Wood 12 + 25% 84 + 25% 1.0 Glass 9 + 90% 63 + 90% 0.89 Nylon 8 + 10% 56 + 10% 0.67 Rubber 2.7 + 20% 19 + 20% 0.18 Bones 2 + 25% 14 + 25% 0.16 Concrete 6 + 90% 42 + 90% 0.03 Adhesives 0.3 + 60% 2.1 + 60% 0.02
  • 4. 1 4 Printedfrom:http://www.me.mtu.edu/~mavable/MoM2nd Mechanics of Materials: StressM. Vable January 2014 EXAMPLE 1.1 A girl whose mass is 40 kg is using a swing set. The diameter of the wire used for constructing the links of the chain is 5 mm. Determine the average normal stress in the links at the bottom of the swing, assuming that the inertial forces can be neglected. PLAN We make an imaginary cut through the chains, draw a free-body diagram, and find the tension T in each chain. The link is cut at two imaginary surfaces, and hence the internal normal force N is equal to T/2 from which we obtain the average normal stress. SOLUTION The cross-sectional area and the weight of the girl can be found as (E1) Figure 1.5 shows the free body diagram after an imaginary cut is made through the chains. The tension in the chain and the normal force at each surface of the link can be found as shown in Equations (E2) and (E3). (E2) (E3) The average normal stress can be found as shown in Equation (E4). (E4) ANS. COMMENTS 1. The stress calculations had two steps. First, we found the internal force by equilibrium; and second we calculated the stress from it. 2. An alternative view is to think that the total material area of the link in each chain is The internal normal force in each chain is T = 196.2 N thus the average normal stress is as before. 1.1.2 Shear Stress In Figure 1.6a the double-sided tape used for sticking a hook on the wall must have sufficient bonding strength to support the weight of the clothes hung from the hook. The free-body diagram shown is created by making an imaginary cut at the wall sur- Figure 1.4 Girl in a swing, Example 1.2. A πd 2 4 --------- π 0.005 m( ) 2 4 ------------------------------- 19.6 10 6– ( ) m 2 = = = W 40 kg( ) 9.81 m/s 2 ( ) 392.4 N= = T 2N= 2T 392.4 N= or 4N 392.4 N= or N 98.1 N= Figure 1.5 Free-body diagram of swing. NN T T T W σav N A ---- 98.1 N 19.6 10× 6– m 2 ( ) ------------------------------------------ 4.996 10 6 × N/m 2 = = = σav 5.0 MPa (T)= 2A 39.2 10× 6– m 2 .= σav T 2A ------- = 196.2 39.2 10 6– ×⁄( ) 5 10 6 × N/m 2 ,= =
  • 5. 1 5 Printedfrom:http://www.me.mtu.edu/~mavable/MoM2nd Mechanics of Materials: StressM. Vable January 2014 face. In Figure 1.6b the paper in the ring binder will tear out if the pull of the hand overcomes the strength of the paper. The free-body diagram shown is created by making an imaginary cut along the path of the rings as the paper is torn out. In both free- body diagrams the internal force necessary for equilibrium is parallel (tangent) to the imaginary cut surface. The internal shear force V divided by the cross sectional area A exposed by the imaginary cut gives us the average intensity of the internal shear force distribution, which we call the average shear stress: (1.2) where τ is the Greek letter tau used to designate shear stress and the subscript av emphasizes that the shear stress is an average value. We may view τav as a uniformly distributed shear force, which can be replaced by a statically equivalent internal normal force V. We will develop this viewpoint further in Section 1.1.4. 1.1.3 Pins Pins are one of the most common example of a structural member in which shear stress is assumed uniform on the imag- inary surface perpendicular to the pin axis. Bolts, screws, nails, and rivets are often approximated as pins if the primary func- tion of these mechanical fasteners is the transfer of shear forces from one member to another. However, if the primary function of these mechanical fasteners is to press two solid bodies into each other (seals) then these fasteners cannot be approximated as pins as the forces transferred are normal forces. Shear pins are mechanical fuses designed to break in shear when the force being transferred exceeds a level that would damage a critical component. In a lawn mower shear pins attach the blades to the transmission shaft and break if the blades hit a large rock that may bend the transmission shaft. τav V A ----= Weight of the ClothesImaginary cut between the wall and the tape V Weight of the Clothes τ τ Imaginary cut along the possible path of the edge of the ring. Pull of the hand Pull of the hand Pull of the hand τ τ τ V V V Mwall Mwall Weight of the Clothes Figure 1.6 Examples of shear stress distribution. (a) (b)
  • 6. 1 6 Printedfrom:http://www.me.mtu.edu/~mavable/MoM2nd Mechanics of Materials: StressM. Vable January 2014 Figure 1.7 shows magnified views of two types of connections at a support. Figure 1.7a shows pin in single shear as a sin- gle cut between the support and the member will break the connection. Figure 1.7b shows a pin in double shear as two cuts are needed to break the connection. For the same reaction force, the pin in double shear has a smaller shear stress. When more than two members (forces) are acting on a pin, it is important to visualize the imaginary surface on which the shear stress is to be calculated. Figure 1.8a shows a magnified view of a pin connection between three members. The shear stress on the imaginary cut surface 1 will be different from that on the imaginary cut surface 2, as shown by the free-body dia- grams in Figure 1.8b. EXAMPLE 1.2 Two possible configurations for the assembly of a joint in a machine are to be evaluated. The magnified view of the two configurations with the forces in the members are shown in Figure 1.9. The diameter of the pin is 1 in. Determine which joint assembly is preferred by calculating the maximum shear stress in the pin for each case. PLAN We make imaginary cuts between individual members for the two configurations and draw free-body diagrams to determine the shear force at each cut. We calculate and compare the shear stresses to determine the maximum shear stress in each configuration. F F V (a)Figure 1.7 Pins in (a) single and (b) double shear. (b) F V V F Figure 1.8 Multiple forces on a pin. NBN VBV NC VBV VDV (b) Cut 1 (a) NC NDN NBN Cut 2 NDN VDV Configuration 1 Configuration 2 NC = 20 kips NC = 20 kips NB = 15 kips NA=15 kips NA = 15 kips ND = 20 kips ND = 20 kips NB = 15 kips A B C D B C D A Figure 1.9 Forces on a joint and different joining configurations.
  • 7. 1 7 Printedfrom:http://www.me.mtu.edu/~mavable/MoM2nd Mechanics of Materials: StressM. Vable January 2014 SOLUTION The area of the pin is . Making imaginary cuts between members we can draw the free-body diagrams and calculate the internal shear force at the imaginary cut, as shown in Figure 1.10. Configuration 1: From the free-body diagrams in Figure 1.10a (E1) We see that the maximum shear force exists between members C and D. Thus the maximum shear stress is (E2) Configuration 2: From the free-body diagrams in Figure 1.10b (E3) The maximum shear force exists the between C and B. Thus the maximum shear stress is (E4) Comparing Equations (E2) and (E3) we conclude ANS. COMMENTS 1. Once more note the two steps: we first calculated the internal shear force by equilibrium and then calculated the shear stress from it. 2. The problem emphasizes the importance of visualizing the imaginary cut surface in the calculation of stresses. 3. A simple change in an assembly sequence can cause a joint to fail. This observation is true any time more than two members are joined together. Gusset plates are often used at the joints such as in bridge shown in Figure 1.11 to eliminate the problems associated with an assembly sequence. A π 0.5 in.( ) 2 0.7854 in. 2 = = Imaginary cut between members A and B NA= 15 kips V1 Imaginary cut between members B and C NB = 15 kips NA= 15 kips V2 Imaginary cut between members C and D ND = 20 kips V3 Imaginary cut between members A and C Imaginary cut between members C and B Imaginary cut between members B and D V1 NA= 15 kips NC = 20 kips NA= 15 kips (V2)y (V2)x ND = 20 kips V3 A A A D A A D B C Figure 1.10 Free-body diagrams. (a) Configuration 1. (b) Configuration 2. (a) (b) V1 15 kips= V2 0= V3 20 kips= τmax = V3 A =⁄ 25.46 ksi. V1 15 kips= V2( )x 15 kips= V2( )y 20 kips= V2 152 202+ 25 kips.= = V3 20 kips= τmax V2 A⁄ 31.8 ksi.= = The configuration 1 is preferred, as it will result in smaller shear stres Figure 1.11 Use of gusset plates at joints in a bridge truss. Gusset plate
  • 8. 1 8 Printedfrom:http://www.me.mtu.edu/~mavable/MoM2nd Mechanics of Materials: StressM. Vable January 2014 EXAMPLE 1.3 All members of the truss shown in Figure 1.12 have a cross-sectional area of 500 mm2 and all pins have a diameter of 20 mm. Determine: (a) The axial stresses in members BC and DE, (b) The shear stress in the pin at A, assuming the pin is in double shear. PLAN (a) The free-body diagram of joint D can be used to find the internal axial force in member DE. The free body diagram drawn after an imaginary cut through BC, CF, and EF can be used to find the internal force in member BC. (b) The free-body diagram of the entire truss can be used to find the support reaction at A, from which the shear stress in the pin at A can be found. SOLUTION The cross-sectional areas of pins and members can be calculated as in Equation (E1) (E1) (a) Figure 1.13a shows the free-body diagram of joint D. The internal axial force NDE can be found using equilibrium equations as shown in Equation (E3). (E2) (E3) The axial stress in member DE can be found as shown in Equation (E4). (E4) ANS. Figure 1.13b shows the free-body diagram after an imaginary cut is made through members CB, CF, and EF. By taking the moment about point F we can find the internal axial force in member CB as shown in Equation (E5). (E5) The axial stress in member CB can be found as shown in Equation (E6). (E6) ANS. (b) Figure 1.13c shows the free-body diagram of the entire truss. By moment equilibrium about point G we obtain (E7) The shear force in the pin will be half the force of NAB as it is in double shear. We obtain the shear stress in the pin as (E8) ANS. P ϭ 21 kN A B F E DG C 2 m 2 m 2 m G 2 m Figure 1.12 Truss. Ap π 0.02 m( ) 2 4 ---------------------------- 314.2 10 6– ( )m 2 = = Am 500 10 6– ( )m 2 = NDC 45 o sin 21 kN– 0= or NDC 29.7 kN= 21 kN NDE NDC D 45° Figure 1.13 Free-body diagrams. 21 kN NEFN NCF NCB Ax GxG GyG 21 NAB (a) (b) (c) N– DE NDC 45 o 0=cos– or NDE 21– kN= σDE NDE Am ----------- 21 10 3 ( ) N–[ ] 500 10 6– ( ) m 2 [ ] ----------------------------------------- 42– 10 6 ( ) N/m 2 = = = σDE 42 MPa (C)= NCB 2 m( ) 21 kN( )– 4 m( ) 0= or NCB 42 kN= σCB NCB Am ---------- 84 10 6 ( ) N/m 2 = = σCD 84 MPa (T)= NAB 2 m( ) 21 kN 6 m( ) 0=– or NAB 63 kN= τA NAB 2⁄ Ap ----------------- 31.5 10 3 ( ) N 314.2 10 6– ( )m 2 ------------------------------------- 100 10 6 ( ) N/m 2 = = = τA 100 MPa=
  • 9. 1 9 Printedfrom:http://www.me.mtu.edu/~mavable/MoM2nd Mechanics of Materials: StressM. Vable January 2014 COMMENTS 1. We calculated the internal forces in each member before calculating the axial stresses, emphasizing the two steps Figure 1.2 of relat- ing stresses to external forces. 2. In part (a) we could have solved for the force in BC by noting that EC is a zero force member and by drawing the free-body diagram of joint C. PROBLEM SET 1.1 Tensile stress 1.1 In a tug of war, each person shown in Figure P1.1 exerts a force of 200 lb. If the effective diameter of the rope is determine the axial stress in the rope. 1.2 A weight is being raised using a cable and a pulley, as shown in Figure P1.2. If the weight W = 200 lb, determine the axial stress assuming: (a) the cable diameter is (b) the cable diameter is 1.3 The cable in Figure P1.2 has a diameter of If the maximum stress in the cable must be limited to 4 ksi (T), what is the maximum weight that can be lifted? 1.4 The weight W = 250 lb in Figure P1.2. If the maximum stress in the cable must be limited to 5 ksi (T), determine the minimum diameter of the cable to the nearest 1.5 A 6-kg light shown in Figure P1.5 is hanging from the ceiling by wires of 0.75-mm diameter. Determine the tensile stress in wires AB and BC. 1.6 An 8-kg light shown in Figure P1.5 is hanging from the ceiling by wires. If the tensile stress in the wires cannot exceed 50 MPa, determine the minimum diameter of the wire, to the nearest tenth of a millimeter. 1 2 --- in., Figure P1.1 1 8 --- in. 1 4 --- in. W Figure P1.2 1 5 --- in. 1 16 ------ in. 2 m Light A A B C 2.5m 2.5m Figure P1.5
  • 10. 1 10 Printedfrom:http://www.me.mtu.edu/~mavable/MoM2nd Mechanics of Materials: StressM. Vable January 2014 1.7 Wires of 0.5-mm diameter are to be used for hanging lights such as the one shown in Figure P1.5. If the tensile stress in the wires cannot exceed 80 MPa, determine the maximum mass of the light that can be hung using these wires. 1.8 A 3 kg picture is hung using a wire of 3 mm diameter, as shown in Figure P1.8. What is the average normal stress in the wires? 1.9 A 5 kg picture is hung using a wire, as shown in Figure P1.8. If the tensile stress in the wires cannot exceed 10MPa, determine the minimum required diameter of the wire to the nearest millimeter. 1.10 Wires of 16-mil diameter are used for hanging a picture, as shown in Figure P1.8. If the tensile stress in the wire cannot exceed 750 psi, determine the maximum weight of the picture that can be hung using these wires. 1 mil = 1.11 A board is raised to lean against the left wall using a cable and pulley, as shown in Figure P1.11. Determine the axial stress in the cable in terms of the length L of the board, the specific weight γ per unit length of the board, the cable diameter d, and the angles θ and α, shown in Figure P1.11. Compressive and bearing stresses 1.12 A hollow circular column supporting a building is attached to a metal plate and bolted into the concrete foundation, as shown in Figure P1.12. The column outside diameter is 100 mm and an inside diameter is 75 mm. The metal plate dimensions are 200 mm × 200 mm × 10 mm. The load P is estimated at 800 kN. Determine: (a) the compressive stress in the column; (b) the average bearing stress between the metal plate and the concrete. 1.13 A hollow circular column supporting a building is attached to a metal plate and bolted into the concrete foundation, as shown in Figure P1.12. The column outside diameter is 4 in. and an inside diameter is 3.5 in. The metal plate dimensions are 10 in. × 10 in. × 0.75 in. If the allow- able average compressive stress in the column is 30 ksi and the allowable average bearing stress in concrete is 2 ksi, determine the maximum load P that can be applied to the column. 54o Figure P1.8 1 1000 ------------ in. ␪ ␣ Board Figure P1.11 Metal Concrete P FigureP1.12
  • 11. 1 11 Printedfrom:http://www.me.mtu.edu/~mavable/MoM2nd Mechanics of Materials: StressM. Vable January 2014 1.14 A hollow square column supporting a building is attached to a metal plate and bolted into the concrete foundation, as shown in Figure P1.14. The column has outside dimensions of 120 mm × 120 mm and a thickness of 10 mm. The load P is estimated at 600 kN. The metal plate dimensions are 250 mm × 250 mm × 15 mm. Determine: (a) the compressive stress in the column; (b) the average bearing stress between the metal plate and the concrete. 1.15 A column with the cross section shown in Figure P1.15 supports a building. The column is attached to a metal plate and bolted into the concrete foundation. The load P is estimated at 750 kN. The metal plate dimensions are 300 mm × 300 mm × 20 mm. Determine: (a) the com- pressive stress in the column; (b) the average bearing stress between the metal plate and the concrete 1.16 A 70-kg person is standing on a bathroom scale that has dimensions of 150 mm × 100 mm × 40 mm (Figures P1.16). Determine the bear- ing stress between the scale and the floor. Assume the weight of the scale is negligible. 1.17 A 30-ft-tall brick chimney has an outside diameter of 3 ft and a wall thickness of 4 in. (Figure P1.17). If the specific weight of the bricks is 80 lb/ft3 , determine the average bearing stress at the base of the chimney. Metal Concrete P Figure P1.14 Concrete 160 m m Metal P 10 mm 10 mm 10 mm10 mm 160 mm FigureP1.15 Figure P1.16 Figure P1.17 30 ft
  • 12. 1 12 Printedfrom:http://www.me.mtu.edu/~mavable/MoM2nd Mechanics of Materials: StressM. Vable January 2014 1.18 Determine the average bearing stress at the bottom of the block shown in Figure P1.18 in terms of the specific weight γ and the length dimen- sions a and h. 1.19 The Washington Monument is an obelisk with a hollow rectangular cross section that tapers along its length. An approximation of the monument geometry is shown in Figure P1.19. The thickness at the base is 4.5 m and at top it is 2.5 m. The monument is constructed from marble and granite. Using a specific weight of 28 kN/m3 for these materials, determine the average bearing stress at the base of the monument. 1.20 Show that the average compressive stress due to weight on a cross section at a distance x from the top of the wall in Figure P1.20b is half that of wall in Figure P1.20a, thus confirming the wisdom of ancient Egyptians in building inward-sloping walls for the pyramids. (Hint: Using γ the specific weight of wall material, H the height of the wall, t the thickness of the wall, and L the length of the wall, calculate the average com- pressive stress at any cross section at a distance x from the top for the two walls.). 1.21 The Great pyramid of Giza shown in Figure 1.14d has a base of 757.7 ft x 757.7 ft and a height of 480.9 ft. Assume an average specific weight of γ = 75 lb/ft3 . Determine (a) the bearing stress at the base of the pyramid. (b) the average compressive stress at mid height. 1.22 The Bent pyramid shown in Figure 1.14c has a base of 188 m x 188 m. The initial slopes of the sides is 54o 27’44”. After a certain height the slope is 43o 22’. The total height of the pyramid is 105 m. Assume an average mass density of 1200 kg/ m3 . Determine the bearing stress at the base of the pyramid. 1.23 A steel bolt of 25 mm diameter passes through an aluminum sleeve of thickness 4 mm and outside diameter of 48 mm as shown in Figure h a 100a 10h Figure P1.18 10 m 17 m 169 m 10 m 17 m Figure P1.19 Figure P1.20 (a) Straight wall (b) Inward sloping tapered wall. (a) (b) H x H t t x L L
  • 13. 1 13 Printedfrom:http://www.me.mtu.edu/~mavable/MoM2nd Mechanics of Materials: StressM. Vable January 2014 P1.23. Determine the average normal stress in the sleeve if in the assembled position the bolt has an average normal stress of 100 MPa (T). Shear stress 1.24 The device shown in Figure P1.24 is used for determining the shear strength of the wood. The dimensions of the wood block are 6 in. × 8 in. × 2 in. If the force required to break the wood block is 15 kips, determine the average shear strength of the wood. 1.25 The dimensions of the wood block in Figure P1.24 are 6 in. × 8 in. × 1.5 in. Estimate the force P that should be applied to break the block if the average shear strength of the wood is 1.2 ksi. 1.26 The punch and die arrangement shown schematically in Figure P1.26 is used to punch out thin plate objects of different shapes. The cross section of the punch and die shown in Figure P1.26 is a circle of 1-in. diameter. A force P = 6 kips is applied to the punch. If the plate thickness t = determine the average shear stress in the plate along the path of the punch. 1.27 The cross section of the punch and die shown in Figure P1.26 is a square of 10 mm × 10 mm. The plate shown has a thickness t = 3 mm and an average shear strength of 200 MPa. Determine the average force P needed to drive the punch through the plate. 1.28 The schematic of a punch and die for punching washers is shown in Figure P1.28. Determine the force P needed to punch out washers, in terms of the plate thickness t, the average plate shear strength τ, and the inner and outer diameters of the washers di and do Figure P1.23 Sleeve Rigid washers 300 mm 25 mm 25 mm P 6 in 2 in 6 in Figure P1.24 1 8 --- in., P Plate Punch Die Die t Figure P1.26 di dod P Punch Die Die t Figure P1.28
  • 14. 1 14 Printedfrom:http://www.me.mtu.edu/~mavable/MoM2nd Mechanics of Materials: StressM. Vable January 2014 1.29 The magnified view of a pin joint in a truss are shown in Figure P1.29. The diameter of the pin is 25 mm. Determine the maximum trans- verse shear stress in the pin. Normal and shear stresses 1.30 A weight W = 200 lb. is being raised using a cable and a pulley, as shown in Figure P1.30. The cable effective diameter is and the pin in the pulley has a diameter of Determine the axial stress in the cable and the shear stress in the pin, assuming the pin is in dou- ble shear. 1.31 The cable in Figure P1.30 has a diameter of and the pin in the pulley has a diameter of If the maximum normal stress in the cable must be limited to 4 ksi (T) and the maximum shear stress in the pin is to be limited to 2 ksi, determine the maximum weight that can be lifted to the nearest lb. The pin is in double shear. 1.32 The manufacturer of the plastic carrier for drywall panels shown in Figure P1.32 prescribes a maximum load P of 200 lb. If the cross-sec- tional areas at sections AA and BB are 1.3 in.2 and 0.3 in.2, respectively, determine the average shear stress at section AA and the average normal stress at section BB at the maximum load P. 1.33 A bolt passing through a piece of wood is shown in Figure P1.33. Determine: (a) the axial stress in the bolt; (b) the average shear stress in the bolt head; (c) the average bearing stress between the bolt head and the wood; (d) the average shear stress in the wood. 40 kN 30 kN 50 kN 36.9° Figure P1.29 1 4 --- in. 3 8 --- in. 55° W Figure P1.30 1 5 --- in. 3 8 --- in. Figure P1.32 P A A B B P ϭ 1.5 kips 3 8 i in3 4 in1 2 Figure P1.33
  • 15. 1 15 Printedfrom:http://www.me.mtu.edu/~mavable/MoM2nd Mechanics of Materials: StressM. Vable January 2014 1.34 A load of P = 10 kips is transferred by the riveted joint shown in Figure P1.34. Determine (a) the average shear stress in the rivet. (b) the largest average normal stress in the members attached (c) the largest average bearing stress between the pins and members. 1.35 A joint in a wooden structure is shown in Figure P1.35. The dimension and Determine the average normal stress on plane BEF and average shear stress on plane BCD. Assume plane BEF and the horizontal plane at AB are a smooth surfaces. 1.36 A metal plate welded to an I-beam is securely fastened to the foundation wall using four bolts of 1/2 in. diameter as shown in Figure P1.36. If P = 12 kips determine the normal and shear stress in each bolt. Assume the load is equally distributed among the four bolts. 1.37 A metal plate welded to an I-beam is securely fastened to the foundation wall using four bolts as shown Figure P1.36. The allowable nor- mal stress in the bolts is 100 MPa and the allowable shear stress is 70 MPa. Assume the load is equally distributed among the four bolts. If the beam load P= 50 kN, determine the minimum diameter to the nearest millimeter of the bolts. 1.38 A metal plate welded to an I-beam is securely fastened to the foundation wall using four bolts of 1/2 in. diameter as shown Figure P1.36. The allowable normal stress in the bolts is 15 ksi and the allowable shear stress is 12 ksi. Assume the load is equally distributed among the four bolts. Determine the maximum load P to the nearest pound the beam can support. 1.39 An adhesively bonded joint in wood is fabricated as shown in Figure P1.39. The length of the overlap is L= 4 in. and the thickness of the wood is 3/8 in. Determine the average shear stress in the adhesive.. Figure P1.34 1 in.1 in.P P2 in. 0.5 in. 0.5 in. 0.5 in. 0.5 in. PP h 4 3 8 --- in.= d 1 1 8 --- in.= E 4 in F 10 kips 30Њ h d A B C D Figure P1.35 Figure P1.36 P 60o Figure P1.39
  • 16. 1 16 Printedfrom:http://www.me.mtu.edu/~mavable/MoM2nd Mechanics of Materials: StressM. Vable January 2014 1.40 A double lap joint adhesively bonds three pieces of wood as shown in Figure P1.40. The joints transmits a force of P= 20 kips and has the following dimensions: L = 3 in., a = 8 in. and h = 2 in. Determine the maximum average normal stress in the wood and the average shear stress in the adhesive. 1.41 The wood in the double lap joint of Figure P1.40 has a strength of 15 MPa in tension and the strength of the adhesive in shear is 2 MPa. The joint has the following dimensions: L = 75 mm, a =200 mm, and h = 50 mm. Determine the maximum force P the joint can transfer. 1.42 A wooden dowel of diameter d = 20 mm is used for constructing the double lap joint in Figure P1.42. The wooden members have a strength of 10 MPa in tension, the bearing stress between the dowel and the members is to be limited to 18 MPa, the shear strength of the dowel is 25 MPa. The joint has the following dimensions: L = 75 mm, a =200 mm, and h = 50 mm. Determine the maximum force P the joint can transfer. 1.43 A couple is using the chair lift shown in Figure P1.43 to see the Fall colors in Michigan’s Upper Peninsula. The pipes of the chair frame are 1/16 in. thick. Assuming each person weighs 180 lb, determine the average normal stress at section AA and BB and average shear stress at section CC assuming the chair is moving at a constant speed. 1.44 The axial force P = 12 kips acts on a rectangular member, as shown in Figure P1.44. Determine the average normal and shear stresses on the inclined plane AA. Figure P1.40 h/2 h/2 P L a h P/2 P/2 Figure P1.42 h/2 h/2 P L a h P/2 P/2 d Figure P1.43 1.5 in. 2 in. 1/16 in. 1/16 in. Section CC1.5 in. B B 80o A A 2 in. C C P 2 in P A 1.5 in Figure P1.44
  • 17. 1 17 Printedfrom:http://www.me.mtu.edu/~mavable/MoM2nd Mechanics of Materials: StressM. Vable January 2014 1.45 A wooden axial member has a cross section of 2 in.× 4 in. The member was glued along line AA and transmits a force of P = 80 kips as shown in Figure P1.45. Determine the average normal and shear stress on plane AA. 1.46 Two rectangular bars of 10-mm thickness are loaded as shown in Figure P1.46. If the normal stress on plane AA is 180 MPa (C), determine the force F1 and the normal and shear stresses on plane BB. 1.47 A butt joint is created by welding two plates to transmits a force of P = 250 kN as shown in Figure P1.47. Determine the average normal and shear stress on the plane AA of the weld. 1.48 A square tube of 1/4 in thickness is welded along the seam and used for transmitting a force of P = 20 kips as shown in Figure P1.48. Determine average normal and shear stress on the plane AA of the weld. 1.49 (a) In terms of P, a, b, and θ determine the average normal and shear stresses on the inclined plane AA shown in Figure P1.49. (b) Plot the normal and shear stresses as a function of θ and determine the maximum values of the normal and shear stresses. (c) At what angles of the inclined plane do the maximum normal and maximum shear stresses occurs. Figure P1.45 A A P 4 in. 40o 50 kN 50 kN F1 F3 A A B B 75° 65°30 mm 10 mm 60 mm Figure P1.46 P P 900 mm 50 mm 200 mm60o 60o Figure P1.47 A A Figure P1.48 P P 30o 2.5 in. 2.5 in. P b P a ␪ A A Figure P1.49
  • 18. 1 18 Printedfrom:http://www.me.mtu.edu/~mavable/MoM2nd Mechanics of Materials: StressM. Vable January 2014 1.50 An axial load is applied to a 1-in-diameter circular rod (Figure P1.50). The shear stress on section AA was found to be 20 ksi. The section AA is at 45o to the axis of the rod. Determine the applied force P and the average normal stress acting on section AA. 1.51 A simplified model of a child’s arm lifting a weight is shown in Figure P1.51. The cross-sectional area of the biceps muscle is estimated as 2 in2 . Determine the average normal stress in the muscle and the average shear force at the elbow joint A. 1.52 Figure P1.52 shows a truss and the sequence of assembly of members at pins H, G, and F. All members of the truss have cross-sectional areas of 250 mm2 and all pins have diameters of 15 mm. Determine (a) the axial stresses in members HA, HB, HG, and HC. (b) the maximum shear stress in pin H. 1.53 Figure P1.52 shows a truss and the sequence of assembly of members at pins H, G, and F. All members of the truss have cross-sectional areas of 250 mm2 and all pins have diameters of 15 mm. Determine (a) the axial stresses in members FG, FC, FD, and FE. (b) the maximum shear stress in pin F. 1.54 Figure P1.52 shows a truss and the sequence of assembly of members at pins H, G, and F. All members of the truss have cross-sectional areas of 200 mm2 and all pins have diameters of 10 mm. Determine (a) the axial stresses in members GH, GC, and GF of the truss shown in Fig- ure P1.52. (b) the maximum shear stress in pin G 1.55 The pin at C in Figure P1.55 is has a diameter of in. and is in double shear. The cross-sectional areas of members AB and BC are 2 in.2 and 2.5 in.2 , respectively. Determine the axial stress in member AB and the shear stress in pin C. P P A A Figure P1.50 5 lb Bone 2 in AA Bone 6 ini 7 in7 in Bicepsmuscle Figure P1.51 A B C D E F G H 30° 30° 4 kN 2 kN 3 kN 3 m 3 m 3 m 3 m Figure P1.52 HA HB HG HC Pin H GH GC GF Pin G Pin F FG FC FD FE 4 kN 2 kN 3 kN 1 2 --- 60° 60 in 66in 80lb/in AB CFigure P1.55
  • 19. 1 19 Printedfrom:http://www.me.mtu.edu/~mavable/MoM2nd Mechanics of Materials: StressM. Vable January 2014 1.56 All pins shown in Figure P1.56 are in single shear and have diameters of 40 mm. All members have square cross sections and the surface at E is smooth. Determine the maximum shear stresses in the pins and the axial stress in member BD. 1.57 A student athlete is lifting weight W = 36 lbs as shown in Figure P1.57a. The weight of the athlete is WA = 140 lb. A model of the student pelvis and legs is shown in Figure P1.57b. The weight of legs and pelvis WL = 32 lb acts at the center of gravity G. Determine the normal stress in the erector spinae muscle that supports the trunk if the average muscle area at the time of lifting the weight is 1.75 in2 . 1.58 A student is exercising his shoulder muscles using a W = 15 lb dumbbell as shown in Figure P1.58a. The model of the student arm is shown in Figure P1.58b. The weight of the arm of WA = 9 lb acts at the center of gravity G. Determine the average normal stress in the deltoid muscle if the average area of the muscle is 0.75 in2 at the time the weight is in the horizontal position. Design problems 1.59 The bottom screw in the hook shown in Figure P1.59 supports 60% of the load P while the remaining 40% of P is carried by the top screw. The shear strength of the screws is 50 MPa. Develop a table for the maximum load P that the hook can support for screw diameters that vary from 1 mm to 5 mm in steps of 1 mm. B A 3 m 2.5 m 50 mm 150 mm 50 kN/m 2.5 m D C E 200 mm Figure P1.56 Figure P1.57 (a) (b) A B C Erector spinae muscles 1.5 in G A B 8.2 in 10 in 20 in Hip Joint (W+WA)/2 3 in 45o 45o WL C Figure P1.58 (a) (b) Shoulder joint 15o A O 6 in6 in12 in W WA deltoid muscle A O G B P Figure P1.59 P
  • 20. 1 20 Printedfrom:http://www.me.mtu.edu/~mavable/MoM2nd Mechanics of Materials: StressM. Vable January 2014 1.60 Determine the maximum force P that can be transferred by the riveted joint shown in Figure P1.34 if the limits apply: maximum normal stress in the attached members can be 30 ksi., maximum bearing stress between the pins and members can be 15 ksi, and the maximum shear stress in the rivet can be 20 ksi. 1.61 A tire swing is suspended using three chains, as shown in Figure P1.61. Each chain makes an angle of 12o with the vertical. The chain is made from links as shown. For design purposes assume that more than one person may use the swing, and hence the swing is to be designed to carry a weight of 500 lb. If the maximum average normal stress in the links is not to exceed 10 ksi, determine to the nearest the diameter of the wire that should be used for constructing the links. 1.62 Two cast-iron pipes are held together by a bolt, as shown in Figure P1.62. The outer diameters of the two pipes are 50 mm and 70 mm and the wall thickness of each pipe is 10 mm. The diameter of the bolt is 15 mm. What is the maximum force P this assembly can transmit if the maximum permissible stresses in the bolt and the cast iron are 200 MPa in shear and 150 MPa in tension, respectively. 1.63 A normal stress of 20 ksi is to be transferred from one plate to another by riveting a plate on top, as shown in Figure P1.63. The shear strength of the in. rivets used is 40 ksi. Assuming all rivets carry equal shear stress, determine the minimum even number of rivets that must be used. 1.64 Two possible joining configurations are to be evaluated. The forces on joint in a truss were calculated and a magnified view is shown Figure P1.64. The pin diameter is 20 mm. Determine which joint assembly is better by calculating the maximum shear stress in the pin for each case. 1 16 ------ in. Figure P1.61 12o P P Figure P1.62 1 2 --- ␴ ϭ 20 ksi 1 in ␴ ϭ 20 ksi6 in 8in 1 in 1 inFigure P1.63 ND= 30 kN ND= 30 kN NB = 67.32 kN NB = 67.32 kN NC = 50 kN NC = 50 kN NA = 32.68 kN NA = 32.68 kN 30o 30o 30o 30o Configuration 1 Configuration 2Figure P1.64
  • 21. 1 21 Printedfrom:http://www.me.mtu.edu/~mavable/MoM2nd Mechanics of Materials: StressM. Vable January 2014 1.65 Truss analysis showed the forces at joint A given in Figure P1.65. Determine the sequence in which the three members at joint A should be assembled so that the shear stress in the pin is minimum. 1.66 An 8 in × 8 in reinforced concrete bar needs to be designed to carry a compressive axial force of 235 kips. The reinforcement is done using round steel bars. Assuming the normal stress in concrete to be a uniform maximum value of 3 ksi and in steel bars to be a uniform value of 20 ksi, determine the minimum number of iron bars that are needed. 1.67 A wooden axial member has a cross section of 2 in. × 4 in. The member was glued along line AA, as shown in Figure P1.45. Determine the maximum force P that can be applied to the repaired axial member if the maximum normal stress in the glue cannot exceed 800 psi and the maxi- mum shear stress in the glue cannot exceed 350 psi. 1.68 An adhesively bonded joint in wood is fabricated as shown in Figure P1.68. The length of the bonded region L = 5 in. Determine the maxi- mum force P the joint can support if the shear strength of the adhesive is 300 psi and the wood strength is 6 ksi in tension. 1.69 The joint in Figure P1.68 is to support a force P = 25 kips. What should be the length L of the bonded region if the adhesive strength in shear is 300 psi? 1.70 The normal stress in the members of the truss shown in Figure P1.70 is to be limited to 160 MPa in tension or compression. All members have circular cross sections. The shear stress in the pins is to be limited to 250 MPa. Determine (a) the minimum diameters to the nearest millimeter of members ED, EG, and EF. (b) the minimum diameter of pin E to the nearest millimeter and the sequence of assembly of members ED, EG, and EF. 1.71 The normal stress in the members of the truss shown in Figure P1.70 is to be limited to 160 MPa in tension or compression. All members have circular cross sections. The shear stress in the pins is to be limited to 250 MPa. Determine (a) the minimum diameters to the nearest millimeter of members CG, CD, and CB. (b) the minimum diameter of pin C to the nearest millimeter and the sequence of assembly of members CG, CD, and CB. Stretch yourself 1.72 Truss analysis showed the forces at joint A given in Figure P1.72. Determine the sequence in which the four members at joint A should be assembled to minimize the shear stress in the pin. NC ϭ 40 kips NB ϭ 32.77 kips 35Њ ND ϭ 22.94 kips A Figure P1.65 1 2 ----in. PP L 8 in 1 in 1 in 1 inFigure P1.68 F E DC G H B A 40 kN 65 kN 4 m 3 m 4 m 3 m Figure P1.70 A 65Њ ND ϭ 25 kipsNC ϭ 27.58 kips NE ϭ 28.34 kipsNB ϭ 40 kips Figure P1.72
  • 22. 1 22 Printedfrom:http://www.me.mtu.edu/~mavable/MoM2nd Mechanics of Materials: StressM. Vable January 2014 MoM in Action: Pyramids The pyramids of Egypt are a remarkable engineering feat. The size, grandeur, and age of the pyramids excites the human imagination. Science fiction authors create stories about aliens building them. Pyramid design, however, is a story about human engineering in a design process that incorporates an intuitive under- standing of material strength. Before pyramids were built, Egyptians kings and nobles were buried in tombs called mastaba (Figure 1.14a). Mastaba have underground chambers that are blocked off by dropping heavy stones down vertical shafts. On top of these underground burial chambers are rectangular structures with inward-sloping, tapered brick mud walls. The ancient Egyptians had learned by experience that inward-sloping walls that taper towards the top do not crumble as quickly as straight walls of uniform thickness (see problem 1.20). Imhotep, the world’s first renowned engineer-architect, took many of the design elements of mastaba to a very large scale in building the world’s first Step pyramid (Figure 1.14b) for his pharaoh Djozer (2667- 2648 BCE). By building it on a bedrock, Imhotep intuitively understood the importance of bearing stresses which were not properly accounted for in building of the leaning tower of Pisa 4000 years later. The Step pyramid rose in six steps to a height of 197 ft with a base of 397 ft x 358 ft. A 92-ft deep central shaft was dug beneath the base for the granite burial chamber. The slopes of the faces of the Step pyramid varied from 72o to 78o . Several pharaohs after Djozer tried to build their own step pyramids but were unsuccessful. The next development in pyramid design took place in the reign of pharaoh Sneferu (2613-2589 BCE). Sneferu architects started by building a step pyramid but abandoned it because he wanted a pyramid with smooth sides. The pyramid shown in Figure 1.14c was started with a base of 617 ft x 617 ft and an initial slope of approximately 54o . Signs of structural problem convinced the builders to change the slope to 43o resulting in the unique bent shape seen in Figure 1.14c (see problem 1.22). Sneferu then ordered a third pyr- amid built. This pyramid had an initial slope of 43o , stood on a base of 722 ft x722 ft, rose to a height of 345 ft, and had smooth sides. This experience was used by architects in the reign of Khufu (2589-2566 BCE) to build the largest pyramid in the world called the Great pyramid of Giza (Figure 1.14d). The Great Pyramid (see problem 1.21) stands on a base of 756.7 ft x 756.7 ft and has a height of 481 ft. The ancient Egyptians did not have a formal definition of stress, but they had an intuitive understanding of the concept of strength. As happens often in engineering design they were able to design and construct pyramids through trial and error. Modern engineering can reduce this costly and time consuming process by developing rigorous methodologies and formulas. In this book we will be developing formulas for strength and stiffness design of structures and machine elements. Figure 1.14 Pyramids of Egypt (a) Mastaba (b) Step pyramid (c) Bent pyramid (d) Great pyramid of Giza. (a) (b) (c) (d)
  • 23. 1 23 Printedfrom:http://www.me.mtu.edu/~mavable/MoM2nd Mechanics of Materials: StressM. Vable January 2014 1.1.4 Internally Distributed Force Systems In Sections 1.1.1 and 1.1.2 the normal stress and the shear stress were introduced as the average intensity of an internal normal and shear force distribution, respectively. But what if there are internal moments at a cross section? Would there be normal and shear stresses at such sections? How are the normal and shear stresses related to internal moments? To answer these questions and to get a better understanding of the character of normal stress and shear stress, we now consider an alternative and more fundamental view. The forces of attraction and repulsion between two particles (atoms or molecules) in a body are assumed to act along the line that joins the two particles.1 The forces vary inversely as an exponent of the radial distance separating the two particles. Thus every particle exerts a force on every other particle, as shown symbolically in Figure 1.15a on an imaginary surface of a body. These forces between particles hold the body together and are referred to as internal forces. The shape of the body changes when we apply external forces thus changing distance between particles and hence changing the forces between the particles (internal forces). The body breaks when the change in the internal forces exceeds some characteristic material value. Thus the strength of the material can be characterized by the measure of change in the intensity of internal forces. This mea- sure of change in the intensity of internal forces is what we call stress. In Figure 1.15b we replace all forces that are exerted on any single particle by the resultants of these forces on that parti- cle. The magnitude and direction of these resultant forces will vary with the location of the particle (point) implying that this is an internal distributed force system. The intensity of internally distributed forces on an imaginary cut surface of a body is called the stress on the surface. The internally distributed forces (stress on a surface) can be resolved into normal (perpendic- ular to the surface) and tangential (parallel to the surface) distribution. The intensity of an internally distributed force that is normal to the surface of an imaginary cut is called the normal stress on the surface. The intensity of an internally distributed force that is parallel to the surface of an imaginary cut surface is called the shear stress on the surface. Normal stress on a surface may be viewed as the internal forces that develop due to the material resistance to the pulling apart or pushing together of two adjoining planes of an imaginary cut. Like pressure, normal stress is always perpendicular to the surface of the imaginary cut. But unlike pressure, which can only be compressive, normal stress can be tensile. 1 Forces that act along the line joining two particles are called central forces. The concept of central forces started with Newton’s universal gravitation law, which states: “the force between two particles is inversely proportional to the square of the radial distance between two particles and acts along the line joining the two particles.” At atomic levels the cen- tral forces do not vary with the square of the radial distance but with an exponent, which is a power of 8 or 10. A B C D E (a) F ␶A Normal to plane (a) FB FC FE FD FA␴A ␶A B E D C A Tangent in plane (b) Normal to plane Figure 1.15 Internal forces between particles on two sides of an imaginary cut. (a) Forces between particles in a body, shown on par- ticle A. (b) Resultant force on each particle.
  • 24. 1 24 Printedfrom:http://www.me.mtu.edu/~mavable/MoM2nd Mechanics of Materials: StressM. Vable January 2014 Shear stress on a surface may be viewed as the internal forces that develop due to the material resistance to the sliding of two adjoining planes along the imaginary cut. Like friction, shear stresses act tangent to the plane in the direction opposite to the impending motion of the surface. But unlike friction, shear stress is not related to the normal forces (stresses). Now that we have established that the stress on a surface is an internally distributed force system, we are in a position to answer the questions raised at the beginning of the section. If the normal and shear stresses are constant in magnitude and direction across the cross section, as shown in Figure 1.16a and b, then these can be replaced by statically equivalent normal and shear forces. [We obtain the equivalent forms of Equations (1.1) and (1.2).] But if either the magnitude or the direction of the normal and shear stresses changes across the cross section, then internal bending moments My, Mz and the internal torque T may be necessary for static equivalency, as shown in Figure 1.16c, d, and e. Figure 1.16 shows some of the stress distribu- tions we will see in this book. But how do we deduce the variation of stress on a surface when stress is an internal quantity that cannot be measured directly? The theories in this book that answer this question were developed over a long period of time using experimental observations, intuition, and logical deduction in an iterative manner. Assumptions have to be made regarding loading, geometry, and material properties of the structural member in the development of the theory. If the theoret- ical predictions do not conform to experimental observations, then assumptions have to be modified to include added com- plexities until the theoretical predictions are consistent with experimental observations. In Section 3.2, we will see the logic whose two links are shown in Figure 1.2. This logic with assumptions regarding loading, geometry, and material properties will be used to develop the simplified theories in Chapters 4 through 6. EXAMPLE 1.4 Figure 1.17 shows a fiber pull-out test that is conducted to determine the shear strength of the interface between the fiber and the resin matrix in a composite material (see Section 3.12.3). Assuming a uniform shear stress τ at the interface, derive a formula for the shear stress in terms of the applied force P, the length of fiber L, and the fiber diameter D. PLAN The shear stress is acting on the cylindrical surface area of the embedded fiber. The shear stress is uniform and hence can be replaced by an equivalent shear force V, which we can equate to P. (a) (b) (c) (d) (e) Figure 1.16 Static equivalency. x y z x y z x y z x y z Mz T My Normal stress linear in y Normal stress linear in z Uniform shear stress in tangential direction.Uniform Normal Stress σavg N σ avg A= V τ avg A= Uniform Shear Stress τavg P L D Resin Fiber Figure 1.17 Fiber pull-out test.
  • 25. 1 25 Printedfrom:http://www.me.mtu.edu/~mavable/MoM2nd Mechanics of Materials: StressM. Vable January 2014 SOLUTION Figure 1.18a shows the cylindrical surface of the fiber with the uniform shear stress on the surface. The surface area A is equal to the cir- cumference multiplied by the fiber length L as shown by the Equation (E1). (E1) The shear force is the shear stress multiplied by the surface area, (E2) By equilibrium of forces in Figure 1.18b (E3) ANS. COMMENTS 1. First, we replaced an internal distributed force system (shear stress) by an equivalent shear force. Second, we related the internal shear force to external force by equilibrium. 2. In the preceding test it is implicitly assumed that the strength of the fiber is greater than the interface strength. Otherwise the fiber would break before it gets pulled out. 3. In a test the force P is increased slowly until the fiber is pulled out. The pull-out force is recorded, and the shear strength can be calcu- lated. 4. Suppose we have determined the shear strength from our formula for specific dimensions D and L of the fiber. Now we should be able to predict the force P that a fiber with different dimensions would support. If on conducting the test the experimental value of P is sig- nificantly different from the value predicted, then our assumption of uniform shear stress in the interface is most likely incorrect. EXAMPLE 1.5 Figure 1.19 shows a test to determine the shear strength of an adhesive. A torque (a moment along the axis) is applied to two thin cylin- ders joined together with the adhesive. Assuming a uniform shear stress τ in the adhesive, develop a formula for the adhesive shear stress τ in terms of the applied torque Text, the cylinder radius R, and the cylinder thickness t. PLAN A free body diagram can be constructed after making an imaginary cut through the adhesive layer. On a differential area the internal shear force can be found and the moment from the internal shear force on the differential area obtained. By integrating we can find the total internal moment acting on the adhesive, which we can equate to the applied external moment Text. A πDL= P D L Figure 1.18 Free body diagrams of the fiber in Example 1.4 (a) with shear stresses, (b) with equivalent internal shear force. P V (a) (b) V τA πDL( )τ= = V P= or πDL( )τ P= τ P πDL( )⁄= R T T t Adhesive Figure 1.19 Adhesive shear strength test. Text Text
  • 26. 1 26 Printedfrom:http://www.me.mtu.edu/~mavable/MoM2nd Mechanics of Materials: StressM. Vable January 2014 SOLUTION We make an imaginary cut through the adhesive and draw the shear stress in the tangential direction, as shown in Figure 1.20a. The differential area is the differential arc length ds multiplied by the thickness t. The differential tangential shear force dV is the shear stress multiplied by the differential area. The differential internal torque (moment) is the moment arm R multiplied by dV, that is, Noting that , we obtain the total internal torque by integrating over the entire circumference. (E1) By equilibrium of moment in Figure 1.20b (E2) ANS. COMMENTS 1. By recording the value of the torque at which the top half of the cylinder separates from the bottom half, we can calculate the shear strength of the adhesive. 2. The assumption of uniform shear stress can only be justified for thin cylinders. In Chapter 5 we will see that shear stress for thicker cyl- inders varies linearly in the radial direction. 3. First, we replaced an internal distributed force system (shear stress) by an equivalent internal torque. Second, we related the internal torque to external torque by equilibrium. EXAMPLE 1.6 Figure 1.21 shows a drill being used to make a L = 12-in.-deep hole for placing explosive charges in a granite rock. The shear strength of the granite is τ = 5 ksi. Determine the minimum torque T that must be applied to a drill of radius R = 1-in., assuming a uniform shear stress along the length of the drill. Neglect the taper at the end. dV ␶( ) ds t T ␶ ␶ ␶dsss Figure 1.20 Free-body diagrams in Example 1.5 (a) with shear stress, (b) with equivalent internal torque. Text (a) (b) Text T dT RdV Rτtds= = ds Rdθ=[ ] T R dV∫ R τt( )R θd∫ τtR 2 θ τtR 2 2π( )=d 0 2π ∫= = = T Text= or 2πR 2 tτ Text= τ Text 2πR 2 t ---------------= Figure 1.21 Torque on a drill. 12 in A ␶ TText
  • 27. 1 27 Printedfrom:http://www.me.mtu.edu/~mavable/MoM2nd Mechanics of Materials: StressM. Vable January 2014 PLAN The imaginary cut surface is the surface of the hole in the granite. The shear stress on the surface of the hole would act like a distributed frictional force on the cylindrical surface of the drill bit. We can find the moment from this frictional force and relate it to the applied torque. SOLUTION The shear stress acts tangential to the cylindrical surface of the drill bit, as shown in Figure 1.22a. Multiplying the shear stress by the differential surface area ds dx we obtain the differential tangential shear force dV. Multiplying dV by the moment arm R, we obtain the internal torque , which is due to the shear stress over the differential surface area. Integrating over the circumference and the length of the drill, we obtain the total internal torque. or (E1) By equilibrium of moment in Figure 1.22b (E2) ANS. COMMENTS 1. In this example and in Example 1.4 shear stress acted on the outside cylindrical surface. In Example 1.4 we replaced the shear stresses by just an internal shear force, whereas in this example we replaced the shear stresses by an internal torque. The difference comes from the direction of the shear stress. 2. In Example 1.5 and in this example the surfaces on which the shear stresses are acting are different. Yet in both examples we replaced the shear stresses by the equivalent internal torque. 3. The two preceding comments emphasize that before we can define which internal force or which internal moment is statically equiv- alent to the internal stress distribution, we must specify the direction of stress and the orientation of the surface on which the stress is acting. We shall develop this concept further in Section 1.2. T A dx ds x R ␶ dV ϭ ␶ dx ds Figure 1.22 Free body diagram of drill bit in Example 1.6 (a) with shear stress, (b) with equivalent internal torque. Text (a) (b) x A T Text dT RdV Rτdsdx= = ds Rdθ= T R dV∫ R τ( )R θd dx 0 2π ∫0 L ∫ τR 2 θd dx 0 2π ∫0 L ∫ τR 2 2π xd 0 L ∫ 2π 2πτR 2 L= = = = = = T 2π 5 ksi( ) 1 in.( ) 2 12 in.( ) 120π in.·kips= = Text T= Text 377 in.·kips= Consolidate your knowledge 1. In your own words describe stress on a surface.
  • 28. 1 28 Printedfrom:http://www.me.mtu.edu/~mavable/MoM2nd Mechanics of Materials: StressM. Vable January 2014 PROBLEM SET 1.2 Internally Distributed Force Systems 1.73 The post shown in Figure P1.73 has a rectangular cross section of 2 in. × 4 in. The length L of the post buried in the ground is 12 in. and the average shear strength of the soil is 2 psi. Determine the force P needed to pull the post out of the ground. 1.74 The post shown in Figure P1.73 has a circular cross section of 100-mm diameter. The length L of the post buried in the ground is 400 mm. It took a force of 1250 N to pull the post out of the ground. What was the average shear strength of the soil? 1.75 The cross section of the post shown in Figure P1.73 is an equilateral triangle with each side of dimension a. If the average shear strength of the soil is τ, determine the force P needed to pull the post out of the ground in terms of τ, L, and a. QUICK TEST 1.1 Time: 15 minutes Total: 20 points Answer true or false and justify each answer in one sentence. Grade yourself with the answers given in Appendix E. Give yourself one point for each correct answer (true or false) and one point for every correct explanation. 1. You can measure stress directly with an instrument the way you measure temperature with a thermometer. 2. There can be only one normal stress component acting on the surface of an imaginary cut. 3. If a shear stress component on the left surface of an imaginary cut is upward, then on the right surface it will be downward. 4. If a normal stress component puts the left surface of an imaginary cut in tension, then the right surface will be in compression. 5. The correct way of reporting shear stress is τ = 70 kips. 6. The correct way of reporting positive axial stress is σ = +15 MPa. 7. 1 GPa equals 106 Pa. 8. 1 psi is approximately equal to 7 Pa. 9. A common failure stress value for metals is 10,000 Pa. 10. Stress on a surface is the same as pressure on a surface as both quantities have the same units. P Ground Post L Figure P1.73
  • 29. 1 29 Printedfrom:http://www.me.mtu.edu/~mavable/MoM2nd Mechanics of Materials: StressM. Vable January 2014 1.76 A force P = 10 lb is applied to the handle of a hammer in an effort to pull a nail out of the wood, as shown in Figure P1.76. The nail has a diameter of and is buried in wood to a depth of 2 in. Determine the average shear stress acting on the nail. 1.77 Two cast-iron pipes are adhesively bonded together over a length of 200 mm as shown in Figure P1.77. The outer diameters of the two pipes are 50 mm and 70 mm, and the wall thickness of each pipe is 10 mm. The two pipes separated while transmitting a force of 100 kN. What was the average shear stress in the adhesive just before the two pipes separated? 1.78 Two cast-iron pipes are adhesively bonded together over a length of 200 mm (Figure P1.78). The outer diameters of the two pipes are 50 mm and 70 mm, and the wall thickness of each pipe is 10 mm. The two pipes separated while transmitting a torque of What was the aver- age shear stress in the adhesive just before the two pipes separated? 1.79 Two cast-iron pipes are held together by a bolt, as shown in Figure P1.79. The outer diameters of the two pipes are 50 mm and 70 mm, and the wall thickness of each pipe is 10 mm. The diameter of the bolt is 15 mm. The bolt broke while transmitting a torque of On what sur- face(s) did the bolt break? What was the average shear stress in the bolt on the surface where it broke? 1.80 The can lid in Figure P1.80a gets punched on two sides AB and AC of an equilateral triangle ABC. Figure P1.80b is the top view showing relative location of the points. The thickness of the lid is t = 1/64 in. and the lid material can at most support a shear stress of 1800 psi. Assume a uniform shear stress during punching and point D acts like a pin joint. Use a= 1/2 in., b = 3 in. and c =1/4 in. Determine the minimum force F that must be applied to the can opener. 1 8 --- in. Figure P1.76 2 in. P 12 in. P P Figure P1.77 2 kN m.⋅ T T Figure P1.78 2 kN·m. T T Figure P1.79 Figure P1.80 (a) (b)B A C D F E a AA B C B C D Ea a c b
  • 30. 1 30 Printedfrom:http://www.me.mtu.edu/~mavable/MoM2nd Mechanics of Materials: StressM. Vable January 2014 1.81 It is proposed to use diameter bolts in a 10-in.-diameter coupling for transferring a torque of 100 in. · kips from one 4-in.-diameter shaft onto another (Figure P1.81). The maximum average shear stress in the bolts is to be limited to 20 ksi. How many bolts are needed, and at what radius should the bolts be placed on the coupling? (Note there are multiple answers.) 1.82 A human hand can comfortably apply a torsional moment of 15 in.·lb (Figure P1.82). (a) What should be the breaking shear strength of a seal between the lid and the bottle, assuming the lid has a diameter of in. and a height of in.? (b) If the same sealing strength as in part (a) is used on a lid that is 1 in. in diameter and in. in height, what would be the torque needed to open the bottle? 1.83 The torsional moment on the lid is applied by hand exerting a force F on the handle of bottle opener as shown in Figure P1.83. Assume the average shear strength of the bond between the lid and the bottle is 10 psi. Determine the minimum force F needed to open the bottle. Use t = 3/ 8 in. d = 2 1/2 in. and a = 4 in. 1.2 STRESS AT A POINT The breaking of a structure starts at the point where the internal force intensity—that is, where stress exceeds some material characteristic value. This implies that we need to refine our definition of stress on a surface to that of Stress at a Point. But an infinite number of planes (surfaces) can pass through a point. Which imaginary surface do we shrink to zero? And when we shrink the surface area to zero, which equation should we use, (1.1) or (1.2)? Both difficulties can be addressed by assigning an orientation to the imaginary surface and to the internal force on this surface. We label these directions with subscripts for the stress components, in the same way that subscripts x, y, and z describe the components of vectors. Figure 1.23 shows a body cut by an imaginary plane that has an outward normal in the i direction. On this surface we have a differential area ΔAi on which a resultant force acts. ΔFj is the component of the force in the j direction. A component 1 2 ----in. T T Figure P1.81 11 2 --- 1 2 --- 1 2 --- Figure P1.82 Figure P1.83 t d F a
  • 31. 1 31 Printedfrom:http://www.me.mtu.edu/~mavable/MoM2nd Mechanics of Materials: StressM. Vable January 2014 of average stress is ΔFj /ΔAi. If we shrink ΔAi to zero we get the definition of a stress component at a point as shown by the Equation (1.3). (1.3) Now when we look at a stress component, the first subscript tells us the orientation of the imaginary surface and the second the direction of the internal force. In three dimensions each subscript i and j can refer to an x, y, or z direction. In other words, there are nine possible com- binations of the two subscripts. This is shown in the stress matrix in Equation (1.4). The diagonal elements in the stress matrix are the normal stresses and all off-diagonal elements represent the shear stresses. (1.4) To specify the stress at a point, we need a magnitude and two directions. In three dimensions we need nine components of stress, and in two dimensions we need four components of stress to completely define stress at a point. Table 1.3 shows the number of components needed to specify a scalar, a vector, and stress. Now force, moment, velocity, and acceleration are all different quantities, but they all are called vectors. In a similar manner, stress belongs to a category called tensors. More spe- cifically, stress is a second-order tensor,2 where ‘second order’ refers to the exponent in the last row. In this terminology, a vector is a tensor of order 1, and a scalar is a tensor of order 0. 1.2.1 Sign convention To obtain the sign of a stress component in Equation (1.3) we establish the following sign convention. Sign Convention: Differential area ΔAi will be considered positive if the outward normal to the surface is in the positive i direction. If the outward normal is in the negative i direction, then ΔAi will be considered negative. We can now deduce the sign for stress. A stress component can be positive in two ways. Both the numerator and the denomina- tor are positive or both the numerator and the denominator are negative in Equation (1.3). Alternatively, if numerator and the 2 To be labeled as tensor, a quantity must also satisfy certain coordinate transformation properties, which will be discussed briefly in Chapter 8. TABLE 1.3 Comparison of number of components Quantity One Dimension Two Dimensions Three Dimensions Scalar 1 = 10 1 = 20 1 = 30 Vector 1 = 11 2 = 21 3 = 31 Stress 1 = 12 4 = 22 9 = 32 σij ΔFj ΔAi --------- ⎝ ⎠ ⎛ ⎞ ΔAi 0→ lim= direction of outward normal to imaginary cut surface direction of internal force component i ⌬Ai ⌬Fj Internal force Outward normal Figure 1.23 Stress at a point. σxx τxy τxz τyx σyy τyz τzx τzy σzz
  • 32. 1 32 Printedfrom:http://www.me.mtu.edu/~mavable/MoM2nd Mechanics of Materials: StressM. Vable January 2014 denominator in Equation (1.3) have: the same sign the stress component is positive; if they have opposite signs the stress com- ponent is negative. We conclude this section with the following points to remember. • Stress is an internal quantity that has units of force per unit area. • A stress component at a point is specified by a magnitude and two directions. Stress at a point is a second-order tensor. • Stress on a surface is specified by a magnitude and only one direction. Stress on a surface thus is a vector. • The first subscript on stress gives the direction of the outward normal of the imaginary cut surface. The second sub- script gives the direction of the internal force. • The sign of a stress component is determined from the direction of the internal force and the direction of the outward normal to the imaginary cut surface. 1.3 STRESS ELEMENTS The previous section showed that stress at a point is an abstract quantity. Stress on a surface, however, is easier to visualize as the intensity of a distributed force on a surface. A stress element is an imaginary object that helps us visualize stress at a point by constructing surfaces that have outward normals in the coordinate directions. In Cartesian coordinates the stress element is a cube; in cylindrical or a spherical coordinates the stress element is a fragment of a cylinder or a sphere, respectively. We start our discussion with the construction of a stress element in Cartesian coordinates to emphasize the basic construction principles. We can use a similar process to draw stress elements in cylindrical and spherical coordinate systems as demonstrated in Exam- ple 1.9. 1.3.1 Construction of a Stress Element for Axial Stress Suppose we wish to visualize a positive stress component σxx at a point that may be generated in an bar under axial forces shown in Figure 1.24a. Around this point imagine an object that has sides with outward normals in the coordinate direction. The cube has six surfaces with outward normals that are either in the positive or in the negative coordinate direction, as shown in Figure 1.24. The first subscript of σxx tells us it must be on the surface that has an outward normal in the x direction. Thus, the two surfaces on which σxx will be shown are at A and B. The direction of the outward normal on surface A is in the positive x direction [the denominator is positive in Equation (1.3)]. For the stress component to be positive on surface A, the force must be in the positive x direction [the numerator must be positive in Equation (1.3)], as shown in Figure 1.24b. The direction of the outward normal on surface B is in the negative x direction [the denominator is negative in Equation (1.3)]. For the stress component to be positive on surface B, the force must be in the negative x direction [the numerator must be negative in Equation (1.3)], as shown in Figure 1.24b. The positive stress component σxx are pulling the cube in opposite directions; that is, the cube is in tension due to a posi- tive normal stress component. We can use this information to draw normal stresses in place of subscripts. A tensile normal stress will pull the surface away from the interior of the element and a compressive normal stress will push the surface into the element. As mentioned earlier, normal stresses are usually reported as tension or compression and not as positive or negative. It should be emphasized that the single arrow used to show the stress component does not imply that the stress component is a force. Showing the stress components as distributed forces on surfaces A and B as in Figure 1.25 is visually more accurate Figure 1.24 (a) Axial bar. (b) Stress element for axial stress. (a) (b) x y z PP y A σxx B x z σxx
  • 33. 1 33 Printedfrom:http://www.me.mtu.edu/~mavable/MoM2nd Mechanics of Materials: StressM. Vable January 2014 but very tedious to draw every time we need to visualize stress. We will show stress components using single arrows as in Fig- ure 1.24, but visualize them as shown in Figure 1.25. 1.3.2 Construction of a Stress Element for Plane Stress Plane stress is one of the two types of two-dimensional simplifications used in mechanics of materials. In Chapter 2 we will study the other type, plane strain. In Chapter 3 we will study the difference between the two types. By two dimensional we imply that one of the coordinates does not play a role in the description of the problem. If we choose z to be the coordinate, we set all stresses with subscript z to zero to get (1.5) We assume that the stress components in Equation (1.5) are positive. Let us consider the first row. The first subscript gives us the direction of the outward normal, which is the x direction. Surfaces A and B in Figure 1.26a have outward normals in the x direction, and it is on these surfaces that the stress component of the first row will be shown. The direction of the outward normal on surface A is in the positive x direction [the denominator is positive in Equation (1.3)]. For the stress component to be positive on surface A, the force must be in the positive direction [the numerator must be positive in Equation (1.3)], as shown in Figure 1.26a. The direction of the outward normal on surface B is in the negative x direction [the denominator is negative in Equation (1.3)]. For the stress component to be positive on surface B, the force must be in the negative direction [the numerator must be negative in Equation (1.3)], as shown in Figure 1.26a. Now consider row 2 in the stress matrix in Equation (1.5). From the first subscript we know that the normal to the surface is in the y direction. Surface C has an outward normal in the positive y direction, therefore all forces on surface C are in the positive direction of the second subscript, as shown in Figure 1.26a. Surface D has an outward normal in the negative y direc- tion, therefore all forces on surface D are in the negative direction of the second subscript, as shown in Figure 1.26a. We note that the plane with outward normal in the z direction is stress-free. Stress-free surfaces are also called free sur- faces, and these surfaces play an important role in stress analysis. Figure 1.26b shows the two-dimensional representation of the stress element that will be seen looking down the z axis. y Figure 1.25 Stress components are distributed forces on a surface. σxx x z σxx σxx τxy 0 τyx σyy 0 0 0 0 x z y dz dy ␴xx␴␴xx␴ ␶xy␶ ␴yy␴␴ ␴yy␴␴ ␶yx␶␶ dx Figure 1.26 Plane stress: (a) 3-dimensional element (b) 2-dimensional element. A B C D A B C D x y σxx σxx σyy σyy τxy τxy τyx τyx dy dx
  • 34. 1 34 Printedfrom:http://www.me.mtu.edu/~mavable/MoM2nd Mechanics of Materials: StressM. Vable January 2014 1.4 SYMMETRIC SHEAR STRESSES If a body is in equilibrium, then all points on the body are in equilibrium. Is the stress element that represents a point on the body in equilibrium? To answer this question we need to convert the stresses into forces by multiplying by the surface area. We take a simple problem of plane stress and assume that the cube in Figure 1.26 has lengths of dx, dy, and dz in the coordinate directions. We draw a two-dimensional picture of the stress cube after multiplying each stress component by the surface area and get the force diagram of Figure 1.27.3 In Figure 1.27 we note that the equations of force equilibrium are satisfied by the assumed state of stress at a point. We consider the moment about point O and obtain (1.6) We cancel the differential volume (dx dy dz) on both sides to obtain (1.7a) In a similar manner we can show that (1.7b) (1.7c) Equations (1.7a) through (1.7c) emphasize that shear stress is symmetric. The symmetry of shear stress implies that in three dimensions there are only six independent stress components out of the nine components necessary to specify stress at a point. In two dimensions there are only three independent stress components out of the four components necessary to specify stress at a point. In Figure 1.26 notice that the shear stress components τxy and τyx point either toward the corners or away from the cor- ners. This observation can be used in drawing the symmetric pair of shear stresses after drawing the shear stress on one of the surfaces of the stress cube. EXAMPLE 1.7 Show the non-zero stress components on the surfaces of the two cubes shown in different coordinate systems in Figure 1.28. PLAN We can identify the surface with the outward normal in the direction of the first subscript. Using the sign convention and Equation (1.3) we draw the force in the direction of the second subscript. 3 Figure 1.27 is only valid if we assume that the stresses are varying very slowly with the x and y coordinates. If this were not true, we would have to account for the increase in stresses over a differential element. But a more rigorous analysis will also reveal that shear stresses are symmetric, see Problem 1.105. Figure 1.27 Force diagram for plane stress. ␴yy␴␴ (dx dz) ␴xx␴ (dy dz) ␶yx␶␶ (dx dz) ␶yx␶␶ (dx dz) ␶xy␶ (dy dz) ␴yy␴␴ (dx dz) ␴xx␴ (dy dz) ␶xy␶ (dy dz) O dx dy τxy dy dz( )dx τyx dx dz( )dy= τxy τyx= τyz τzy= τzx τxz= y z x Cube 1 Cube 2 Figure 1.28 Cubes in different coordinate systems in Example 1.7. z y x σxx 80MPa T( )= τxy 30MPa= 0 τyx 30MPa= σyy 40MPa C( )= 0 0 0 0
  • 35. 1 35 Printedfrom:http://www.me.mtu.edu/~mavable/MoM2nd Mechanics of Materials: StressM. Vable January 2014 SOLUTION Cube 1: The first subscript of σxx and τxy shows that the outward normal is in the x direction; hence these components will be shown on surfaces C and D in Figure 1.29a. The outward normal on surface C is in the negative x direction; hence the denominator in Equation (1.3) is negative. Therefore on Figure 1.29a: • The internal force has to be in the negative x direction to produce a positive (tensile) σxx. • The internal force has to be in the negative y direction to produce a positive τxy. The outward normal on surface D is in the positive x direction; hence the denominator in Equation (1.3) is positive. Therefore on Figure 1.29a: • The internal force has to be in the positive x direction to produce a positive (tensile) σxx. • The internal force has to be in the positive y direction to produce a positive τxy. The first subscript of τyx and σyy shows that the outward normal is in the y direction; hence this component will be shown on surfaces A and B. The outward normal on surface A is in the positive y direction; hence the denominator in Equation (1.3) is positive. Therefore on Figure 1.29a: • The internal force has to be in the positive x direction to produce a positive τyx. • The internal force has to be in the negative y direction to produce a negative (compressive) σyy. The outward normal on surface B is in the negative y direction; hence the denominator in Equation (1.3) is negative. Therefore on Figure 1.29a: • The internal force has to be in the negative x direction to produce a positive τyx. • The internal force has to be in the positive y direction to produce a negative (compressive) σyy. Cube 2: The first subscript of σxx and τxy shows that the outward normal is in the x direction; hence these components will be shown on surfaces E and F. The outward normal on surface E is in the negative x direction; hence the denominator in Equation (1.3) is negative. Therefore on Figure 1.29a: • The internal force has to be in the negative x direction to produce a positive (tensile) σxx. • The internal force has to be in the negative y direction to produce a positive τxy. The outward normal on surface F is in the positive x direction; hence the denominator in Equation (1.3) is positive. Therefore on Figure 1.29a: • The internal force has to be in the positive x direction to produce a positive (tensile) σxx. • The internal force has to be in the positive y direction to produce a positive τxy. The first subscript of τyx and σyy shows that the outward normal is in the y direction; hence this component will be shown on surfaces A and B. The outward normal on surface A is in the negative y direction; hence the denominator in Equation (1.3) is negative. Therefore on Figure 1.29a: • The internal force has to be in the negative x direction to produce a positive τyx. • The internal force has to be in the positive y direction to produce a negative (compressive) σyy. The outward normal on surface B is in the positive y direction; hence the denominator in Equation (1.3) is positive. Therefore on Figure 1.29a: • The internal force has to be in the positive x direction to produce a positive τyx. • The internal force has to be in the negative y direction to produce a negative (compressive) σyy. COMMENTS 1. Figure 1.30 shows the two-dimensional representations of stress cubes shown in Figure 1.29. These two-dimensional representations are easier to draw but it must be kept in mind that the point is in three-dimensional space with surfaces with outward normals in the z direction being stress free. Figure 1.29 Solution of Example 1.7.(a) Cube 1. (b) Cube 2. 80 (a) (b) z y x D A C B 80 30 3030 4040 30 E F y z x A D C B 40 30 80 80 30 30 40 E F Figure 1.30 Two-dimensional depiction of the solution of Example 1.7.(a) Cube 1. (b) Cube 2. (a) (b) z y x A C 80 80 30 30 30 40 40 30 B D y z x A 40 30 80 80 30 30 40 E F
  • 36. 1 36 Printedfrom:http://www.me.mtu.edu/~mavable/MoM2nd Mechanics of Materials: StressM. Vable January 2014 2. We note that σxx pulls the surfaces outwards and σyy pushes the surfaces inwards in Figures 1.29 and 1.30 as these are tensile and com- pressive stresses, respectively. Hence, we can use this information to draw these stress components without using the subscripts. 3. The shear stress τxx and τyx either point towards the corner or away from the corner as seen in Figures 1.29 and 1.30. Using this infor- mation we can draw the shear stress on the appropriate surfaces after obtaining the direction on one surface using subscripts. 1.5* CONSTRUCTION OF A STRESS ELEMENT IN 3-DIMENSION We once more visualize a cube with outward normals in the coordinate direction around the point we wish to show our stress components. The cube has six surfaces with outward normals that are either in the positive or in the negative coordinate direc- tion, as shown in Figure 1.31. In other words, we have now accounted for the first subscript in our stress definition. We know that force is in the positive or negative direction of the second subscript. We use our sign convention to show the stress in the direction of the force on each of the six surfaces. To demonstrate the construction of the stress element we will assume that all nine stress components in the stress matrix shown in Figure 1.31a are positive. Let us consider the first row. The first subscript gives us the direction of the outward nor- mal, which is the x direction. Surfaces A and B in Figure 1.31b have outward normals in the x direction, and it is on these sur- faces that the stress component of the first row will be shown. The direction of the outward normal on surface A is in the positive x direction [the denominator is positive in Equation (1.3)]. For the stress component to be positive on surface A, the force must be in the positive direction [the numerator must be positive in Equation (1.3)], as shown in Figure 1.31b. The direction of the outward normal on surface B is in the negative x direction [the denominator is negative in Equation (1.3)]. For the stress component to be positive on surface B, the force must be in the negative direction [the numerator must be negative in Equation (1.3)], as shown in Figure 1.31b. Now consider row 2 in the stress matrix in Figure 1.31a. From the first subscript we know that the normal to the surface is in the y direction. Surface C has an outward normal in the positive y direction, therefore all forces on surface C are in the positive direction of the second subscript, as shown in Figure 1.31b. Surface D has an outward normal in the negative y direc- tion, therefore all forces on surface D are in the negative direction of the second subscript, as shown in Figure 1.31b. By the same logic, the components of row 3 in the stress matrix are shown on surfaces E and F in Figure 1.31b. A ␴xx␴ xy ␶xz␶ ␶yx␶␶ ␶yz␶␶ ␴yy␴␴ ␶ ␶ ␶zx␶ ␶zy␶ yy yz␶ ␶ C x y z F Figure 1.31 Stress cube showing all positive stress components in three dimensions. σxx τyx τzx τxy σyy τzy τxz τyz σzz (a) (b)
  • 37. 1 37 Printedfrom:http://www.me.mtu.edu/~mavable/MoM2nd Mechanics of Materials: StressM. Vable January 2014 EXAMPLE 1.8 Show the nonzero stress components on surfaces A, B, and C of the two cubes shown in different coordinate systems in Figure 1.32. PLAN We can identify the surface with the outward normal in the direction of the first subscript. Using the sign convention and Equation (1.3) we draw the force in the direction of the second subscript. SOLUTION Cube 1: The first subscript of σxx, τxy, and τxz shows that the outward normal is in the x direction; hence these components will be shown on surface C. The outward normal on surface C is in the negative x direction; hence the denominator in Equation (1.3) is negative. There- fore on Figure 1.33a: • The internal force has to be in the negative x direction to produce a positive (tensile) σxx. • The internal force has to be in the negative y direction to produce a positive τxy. • The internal force has to be in the positive z direction to produce a negative τxz. The first subscript of τyx shows that the outward normal is in the y direction; hence this component will be shown on surface B. The out- ward normal on surface B is in the positive y direction; hence the denominator in Equation (1.3) is positive. Therefore on Figure 1.33a: • The internal force has to be in the positive x direction to produce a positive τyx. The first subscript of τzx, σzz shows that the outward normal is in the z direction; hence these components will be shown on surface A. The outward normal on surface A is in the positive z direction; hence the denominator in Equation (1.3) is positive. Therefore on Figure 1.33a: • The internal force has to be in the negative x direction to produce a negative τzx. • The internal force has to be in the negative z direction to produce a negative (compressive) σzz. Cube 2: The first subscript of σxx, τxy, and τxz shows that the outward normal is in the x direction; hence these components will be shown on surface A. The outward normal on surface A is in the negative x direction; hence the denominator in Equation (1.3) is negative. There- fore in Figure 1.33b: • The internal force has to be in the negative x direction to produce a positive (tensile) σxx. • The internal force has to be in the negative y direction to produce a positive τxy. • The internal force has to be in the positive z direction to produce a negative τxz. The first subscript of τyx shows that the outward normal is in the y direction; hence this component will be shown on surface B. The out- ward normal on surface B is in the negative y direction; hence the denominator in Equation (1.3) is negative. Therefore in Figure 1.33b: • The internal force has to be in the negative y direction to produce a positive τyx. The first subscript of τzx, σzz shows that the outward normal is in the z direction; hence these components will be shown on surface C. The outward normal on surface C is in the positive z direction; hence the denominator in Equation (1.3) is positive. Therefore in Figure 1.33b: • The internal force has to be in the negative x direction to produce a negative τzx. • The internal force has to be in the negative z direction to produce a negative (compressive) σzz. COMMENTS 1. In drawing the normal stresses we could have made use of the fact that σxx is tensile and hence pulls the surface outward. σzz is com- pressive and hence pushes the surface inward. This is a quicker way of getting the directions of these stress components than the argu- ments based on signs and subscripts. Cube 1 z x yA B C Figure 1.32 Cubes in different coordinate systems. x z y Cube 2 A B C σxx 80 MPa (T)= τxy 30 MPa= τxz 70 MPa–= τyx 30 MPa= σyy 0= τyz 0= τzx 70 MPa–= τzy 0= σzz 40 MPa (C)= z x y A 803033 30 70 70 40 B C (a)Figure 1.33 Solution of Example 1.8. x z A B y 70 30 30 80 70 40 C (b)
  • 38. 1 38 Printedfrom:http://www.me.mtu.edu/~mavable/MoM2nd Mechanics of Materials: StressM. Vable January 2014 2. Once we have drawn τxy and τxz using the subscripts, we could draw τyx and τzx using the observation that the pair of symmetric shear stresses point towards or away from the corner formed by the two adjoining surfaces, thus saving some effort in the construction of the stress element. EXAMPLE 1.9 Show the following positive stress components on a stress element drawn in the spherical coordinate system shown in Figure 1.34. PLAN We construct a stress element with surfaces that have outward normals in the r, θ, and φ directions. The first subscript will identify the surface on which the row of stress components is to be shown. The second subscript then will show the direction of the stress component on the surface. SOLUTION We draw a stress element with lines in the directions of r, θ, and φ, as shown in Figure 1.35. The stresses σrr, τrθ, and τrφ will be on surface A in Figure 1.35. The outward normal on surface A is in the positive r direction. Thus the forces have to be in the positive r, θ, and φ directions to result in positive σrr, τrθ, and τrφ. The stresses τθr, σθθ, and τθφ will be on surface B in Figure 1.35. The outward normal on surface B is in the negative θ direction. Thus the forces have to be in the negative r, θ, and φ directions to result in positive τθr, σθθ, and τθφ. The stresses τφr, τφθ, and σφφ will be on surface C in Figure 1.35. The outward normal on surface C is in the positive φ direction. Thus the forces have to be in the positive r, θ, and φ directions to result in positive τφr, τφθ, and σφφ. COMMENT 1. This example demonstrates that use of subscripts in determining the direction of stress components follows the same procedure as in cartesian coordinates even though the stress element is a fragment of a sphere. z r y x ␪ ␾ Figure 1.34 Stresses in spherical coordinates. σrr τrθ τrφ τθr σθθ τθφ τφr τφθ σφφ r ␪ ␾ ␪␪ ␶␪␾␶ ␶␪␶␶ r ␴␪␪␴ Figure 1.35 Stress element in spherical coordinates. Consolidate your knowledge 1. In your own words describe stress at a point and how it differs from stress on a surface
  • 39. 1 39 Printedfrom:http://www.me.mtu.edu/~mavable/MoM2nd Mechanics of Materials: StressM. Vable January 2014 PROBLEM SET 1.3 Plane Stress: Cartesian Coordinates 1.84 Show the stress components of a point in plane stress on the square in Figure P1.84. 1.85 Show the stress components of a point in plane stress on the square in Figure P1.85. 1.86 Show the stress components of a point in plane stress on the square in Figure P1.86. 1.87 Show the stress components of a point in plane stress on the square in Figure P1.87. QUICK TEST 1.2 Time: 15 minutes/Total: 20 points Answer true or false and justify each answer in one sentence. Grade yourself with the answers given in Appendix E. Give yourself one point for every correct answer (true or false) and one point for every correct explanation. 1. Stress at a point is a vector like stress on a surface. 2. In three dimensions stress has nine components. 3. In three dimensions stress has six independent components. 4. At a point in plane stress there are three independent stress components. 5. At a point in plane stress there are always six zero stress components. 6. If the shear stress on the left surface of an imaginary cut is upward and defined as positive, then on the right surface of the imaginary cut it is downward and negative. 7. A stress element can be drawn to any scale. 8. A stress element can be drawn at any orientation. 9. Stress components are opposite in direction on the two surfaces of an imaginary cut. 10. Stress components have opposite signs on the two surfaces of an imaginary cut. y x Figure P1.84 σxx 100 MPa (T) τxy 75 MPa–== τyx 75– MPa σyy 85 MPa (T)== y x Figure P1.85 σxx 85 MPa (C) τxy 75 MPa== τyx 75 MPa σyy 100 MPa (T)== y x Figure P1.86 σxx 27 ksi (C) τxy 18 ksi== τyx 18 ksi σyy 85 ksi (T)== y x Figure P1.87 σxx 27 ksi (C) τxy 18 ksi== τyx 18 ksi σyy 85 ksi (T)==
  • 40. 1 40 Printedfrom:http://www.me.mtu.edu/~mavable/MoM2nd Mechanics of Materials: StressM. Vable January 2014 1.88 Show the nonzero stress components on the A, B, and C faces of the cube in Figure P1.88. 1.89 Show the nonzero stress components on the A, B, and C faces of the cube in Figure P1.89. Plane Stress: Polar Coordinates 1.90 Show the stress components of a point in plane stress on the stress element in polar coordinates in Figure P1.90. 1.91 Show the stress components of a point in plane stress on the stress element in polar coordinates in Figure P1.91. 1.92 Show the stress components of a point in plane stress on the stress element in polar coordinates in Figure P1.92. 1.93 Show the stress components of a point in plane stress on the stress element in polar coordinates in Figure P1.93. z x yA B C Figure P1.88 σxx 70 MPa (T) τxy 40– MPa τxz 0=== τyx 40– MPa σyy 85 MPa (C) τyz 0=== τzx 0 τzy 0 σzz 0=== x y zA B C Figure P1.89 σxx 70 MPa (T) τxy 40– MPa τxz 0=== τyx 40– MPa σyy 85 MPa (C) τyz 0=== τzx 0 τzy 0 σzz 0=== ␪ y r xFigure P1.90 σrr 125 MPa (T) τrθ 65 MPa–== τθr 65– MPa σθθ 90 MPa (C)== ␪ y r x Figure P1.91 σrr 125 MPa (T) τrθ 65 MPa–== τθr 65– MPa σθθ 90 MPa (C)== ␪ y r xFigure P1.92 σrr 18 ksi (T) τrθ 12– ksi== τθr 12– ksi σθθ 25 ksi (C)== ␪ y r x Figure P1.93 σrr 25 ksi (C) τrθ 12 ksi== τθr 12 ksi σθθ 18 ksi (T)==
  • 41. 1 41 Printedfrom:http://www.me.mtu.edu/~mavable/MoM2nd Mechanics of Materials: StressM. Vable January 2014 Stress Element in 3-dimensions 1.94 Show the nonzero stress components on the A, B, and C faces of the cube in Figure P1.94. 1.95 Show the nonzero stress components on the A, B, and C faces of the cube in Figure P1.95. 1.96 Show the nonzero stress components on the A, B, and C faces of the cube in Figure P1.96. 1.97 Show the nonzero stress components on the A, B, and C faces of the cube in Figure P1.97. 1.98 Show the nonzero stress components in the r, θ, and x cylindrical coordinate system on the A, B, and C faces of the stress elements shown in Figures P1.98. z y xA B C Figure P1.94 σxx 100 MPa (T) τxy 200 MPa= τxz 125 MPa–== τyx 200 MPa σyy 175 MPa (C)= τyz 225 MPa== τzx 125– MPa τzy 225 MPa σzz 150 MPa (T)=== y x zA B C Figure P1.95 σxx 90 MPa (T) τxy 200 MPa τxz 0=== τyx 200 MPa σyy 175 MPa (T) τyz 225– MPa=== τzx 0 τzy 225– MPa σzz 150 MPa (C)=== z y x A B C Figure P1.96 σxx 0 τxy 15ksi τxz 0=== τyx 15 ksi σyy 10 ksi (T) τyz 25– ksi=== τzx 0 τzy 25– ksi σzz 20 ksi (C)=== x z y A B C Figure P1.97 σxx 0 τxy 15– ksi τxz 0=== τyx 15– ksi σyy 10 ksi (C) τyz 25 ksi=== τzx 0 τzy 25 ksi σzz 20 ksi (T)=== A B C ␪ r x Figure P1.98 σrr 150 MPa (T) τrθ 100– MPa τrx 125 MPa=== τθr 100– MPa σθθ 160 MPa (C) τθx 165 MPa=== τxr 125 MPa τxθ 165 MPa σxx 145 MPa (C)===
  • 42. 1 42 Printedfrom:http://www.me.mtu.edu/~mavable/MoM2nd Mechanics of Materials: StressM. Vable January 2014 1.99 Show the nonzero stress components in the r, θ, and x cylindrical coordinate system on the A, B, and C faces of the stress elements shown in P1.99. 1.100 Show the nonzero stress components in the r, θ, and φ spherical coordinate system on the A, B, and C faces of the stress elements shown in Figure P1.100. 1.101 Show the nonzero stress components in the r, θ, and φ spherical coordinate system on the A, B, and C faces of the stress elements shown in P1.101. Stretch yourself 1.102 Show that the normal stress σxx on a surface can be replaced by the equivalent internal normal force N and internal bending moments My and Mz as shown in Figure P1.102 and given by the equations (1.8a) through (1.8c). r x CCC A Figure P1.99 σrr 10 ksi (C) τrθ 22 ksi τrx 32 ksi=== τθr 22 ksi σθθ 0 τθx 25 ksi=== τxr 32 ksi τxθ 25 ksi σxx 20 ksi (T)=== z r y x AAAFigure P1.100 σrr 150 MPa (T) τrθ 100 MPa τrφ 125 MPa=== τθr 100 MPa σθθ 160 MPa (C) τθφ 175– MPa=== τφr 125 MPa τφθ 175– MPa σφφ 135 MPa (C)=== z r y x ABFigure P1.101 σrr 0 τrθ 18– ksi τrφ 0=== τθr 18– ksi σθθ 10 ksi (C) τθφ 25 ksi=== τφr 0 τφθ 25 ksi σφφ 20 ksi (T)=== y z x O Mz My N Figure P1.102 (1.8a) (1.8b) (1.8c) N σxx Ad A ∫= My zσxx Ad A ∫–= Mz yσxx Ad A ∫–=