1. Daily Technical Outlook
10th January 2012
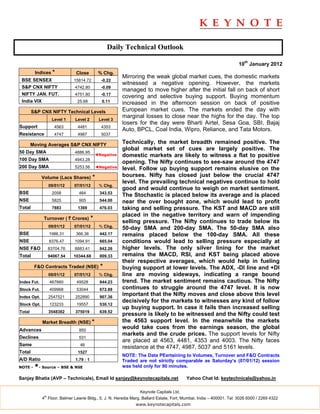
Indices * Close % Chg.
Mirroring the weak global market cues, the domestic markets
BSE SENSEX 15814.72 -0.22
witnessed a negative opening. However, the markets
S&P CNX NIFTY 4742.80 -0.09
managed to move higher after the initial fall on back of short
NIFTY JAN. FUT. 4751.80 -0.17
covering and selective buying support. Buying momentum
India VIX 25.68 0.11 increased in the afternoon session on back of positive
S&P CNX NIFTY Technical Levels European market cues. The markets ended the day with
marginal losses to close near the highs for the day. The top
Level 1 Level 2 Level 3
losers for the day were Bharti Airtel, Sesa Goa, SBI, Bajaj
Support 4563 4481 4353
Auto, BPCL, Coal India, Wipro, Reliance, and Tata Motors.
Resistance 4747 4987 5037
Moving Averages S&P CNX NIFTY
Technically, the market breadth remained positive. The
global market set of cues are largely positive. The
50 Day SMA 4886.95
◄Negative domestic markets are likely to witness a flat to positive
100 Day SMA 4943.28
opening. The Nifty continues to see-saw around the 4747
200 Day SMA 5253.56 ◄Negative level. Follow up buying support remains elusive on the
Volume (Lacs Shares) * bourses. Nifty has closed just below the crucial 4747
level. The prevailing technical negatives continue to hold
09/01/12 07/01/12 % Chg.
good and would continue to weigh on market sentiment.
BSE 2058 464 343.53
The Stochastic is placed below its average and is placed
NSE 5825 905 544.00 near the over bought zone, which would lead to profit
Total 7883 1369 476.03 taking and selling pressure. The KST and MACD are still
placed in the negative territory and warn of impending
Turnover ( ` Crores) *
selling pressure. The Nifty continues to trade below its
09/01/12 07/01/12 % Chg. 50-day SMA and 200-day SMA. The 50-day SMA also
BSE 1986.31 366.36 442.17 remains placed below the 100-day SMA. All these
NSE 8376.47 1094.91 665.04 conditions would lead to selling pressure especially at
NSE F&O 83704.76 8883.41 842.26 higher levels. The only silver lining for the market
Total 94067.54 10344.68 809.33 remains the MACD, RSI, and KST being placed above
their respective averages, which would help in fueling
F&O Contracts Traded (NSE) * buying support at lower levels. The ADX, -DI line and +DI
09/01/12 07/01/12 % Chg. line are moving sideways, indicating a range bound
Index Fut. 467660 49528 844.23 trend. The market sentiment remains cautious. The Nifty
Stock Fut. 409968 53044 672.88 continues to struggle around the 4747 level. It is now
Index Opt. 2547521 252890 907.36
important that the Nifty moves and close above this level
decisively for the markets to witnesses any kind of follow
Stock Opt. 123233 19557 530.12
up buying support. In case it fails then increased selling
Total 3548382 375019 639.52
pressure is likely to be witnessed and the Nifty could test
Market Breadth (NSE) * the 4563 support level. In the meanwhile the markets
Advances 950
would take cues from the earnings season, the global
markets and the crude prices. The support levels for Nifty
Declines 531
are placed at 4563, 4481, 4353 and 4003. The Nifty faces
Same 46
resistance at the 4747, 4987, 5037 and 5161 levels.
Total 1527
NOTE: The Data PEertaining to Volumes, Turnover and F&O Contracts
A/D Ratio 1.79 : 1 Traded are not strictly comparable as Saturday’s (07/01/12) session
NOTE - *- Source – BSE & NSE was held only for 90 minutes.
Sanjay Bhatia (AVP – Technicals), Email Id sanjay@keynotecapitals.net Yahoo Chat Id: keytechnicals@yahoo.in
Keynote Capitals Ltd.
th
4 Floor, Balmer Lawrie Bldg., 5, J. N. Heredia Marg, Ballard Estate, Fort, Mumbai, India – 400001. Tel: 3026 6000 / 2269 4322
www.keynotecapitals.com
2. Short Term Trading Ideas Based On Technical Analysis (5 - 7 Days)
Stop
Initiation Stop Loss Target
Stock Close Action Price Loss * (%) Target (%) Remarks
Bharti Airtel 320.45 Sell Below 319.00 326.00 2.19 303 5.02
Dabur 97.75 Sell Below 97.50 99.10 1.64 94 3.59
Oil India 1110.10 Sell Below 1107.00 1124.00 1.54 1070 3.34
* Stop Losses are to be considered strictly on Closing basis.
Intra-day Resistance Intra-day Support
Indices Close Pivot Point R1 R2 R3 S1 S2 S3
BSE SENSEX 15815 15788 15898 15981 16175 15705 15595 15402
S&P CNX NIFTY 4743 4732 4769 4796 4859 4706 4669 4606
NIFTY JAN. FUT. 4752 4745 4785 4818 4891 4712 4672 4599
Keynote Capitals Ltd.
th
4 Floor, Balmer Lawrie Bldg., 5, J. N. Heredia Marg, Ballard Estate, Fort, Mumbai, India – 400001. Tel: 3026 6000 / 2269 4322
www.keynotecapitals.com
3. Disclaimer
This document is not for public distribution and has been furnished to you solely for your information and must not be
reproduced or redistributed to any other person. Persons into whose possession this document may come are
required to observe these restrictions.
This material is for the personal information of the authorized recipient, and we are not soliciting any action based
upon it. This report is not to be construed as an offer to sell or the solicitation of an offer to buy any security in any
jurisdiction where such an offer or solicitation would be illegal. It is for the general information of clients of Keynote
Capitals Ltd. It does not constitute a personal recommendation or take into account the particular investment
objectives, financial situations, or needs of individual clients.
We have reviewed the report, and in so far as it includes current or historical information, it is believed to be reliable
though its accuracy or completeness cannot be guaranteed. Neither Keynote Capitals Ltd., nor any person connected
with it, accepts any liability arising from the use of this document. The recipients of this material should rely on their
own investigations and take their own professional advice. Price and value of the investments referred to in this
material may go up or down. Past performance is not a guide for future performance. Certain transactions -including
those involving futures, options and other derivatives as well as non-investment grade securities - involve substantial
risk and are not suitable for all investors. Reports based on technical analysis centers on studying charts of a stock’s
price movement and trading volume, as opposed to focusing on a company’s fundamentals and as such, may not
match with a report on a company’s fundamentals.
Opinions expressed are our current opinions as of the date appearing on this material only. While we endeavor to
update on a reasonable basis the information discussed in this material, there may be regulatory, compliance, or
other reasons that prevent us from doing so. Prospective investors and others are cautioned that any forward-looking
statements are not predictions and may be subject to change without notice. Our proprietary trading and investment
businesses may make investment decisions that are inconsistent with the recommendations expressed herein.
We and our affiliates, officers, directors, and employees world wide may: (a) from time to time, have long or short
positions in, and buy or sell the securities thereof, of company (ies) mentioned herein or (b) be engaged in any other
transaction involving such securities and earn brokerage or other compensation or act as a market maker in the
financial instruments of the company (ies) discussed herein or act as advisor or lender / borrower to such company
(ies) or have other potential conflict of interest with respect to any recommendation and related information and
opinions.
The analyst for this report certifies that all of the views expressed in this report accurately reflect his or her personal
views about the subject company or companies and its or their securities, and no part of his or her compensation
was, is or will be, directly or indirectly related to specific recommendations or views expressed in this report.
No part of this material may be duplicated in any form and/or redistributed without Keynote Capitals Ltd’s., prior
written consent.
Keynote Capitals Ltd.
th
4 Floor, Balmer Lawrie Bldg., 5, J. N. Heredia Marg, Ballard Estate, Fort, Mumbai, India – 400001. Tel: 3026 6000 / 2269 4322
www.keynotecapitals.com