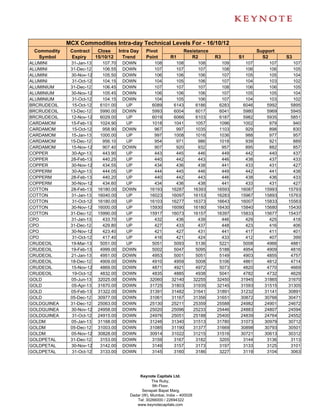
2. MCX Commodities Intra-day Technical Levels For - 16/10/12
Commodity Contract Close Intra Day Pivot Resistance Support
Symbol Expiry 15/10/12 Trend Point R1 R2 R3 S1 S2 S3
GOLDPTLDEL 31-Oct-12 3243.00 DOWN 3246 3260 3278 3310 3228 3214 3182
GOLDPTLDEL 31-Dec-12 3217.00 UP 3210 3232 3248 3286 3194 3172 3134
GOLDPTLDEL 30-Nov-12 3195.00 DOWN 3195 3204 3213 3231 3186 3177 3159
KAPAS 30-Apr-13 947.10 UP 942 956 966 990 932 918 894
KAPAS 30-Mar-13 923.60 UP 919 932 941 963 910 896 874
KAPASKHALI 30-Apr-13 1490.00 DOWN 1490 1490 1490 1490 1490 1490 1490
KAPASKHALI 30-Mar-13 1484.00 DOWN 1484 1484 1484 1484 1484 1484 1484
KAPASKHALI 28-Feb-13 1465.00 UP 1454 1481 1498 1541 1438 1411 1367
KAPASKHALI 31-Jan-13 1443.50 UP 1434 1461 1478 1522 1417 1390 1346
KAPASKHALI 31-Dec-12 1430.00 UP 1421 1450 1470 1519 1401 1372 1323
LEAD 31-Jan-13 113.05 DOWN 113 114 114 115 113 112 111
LEAD 31-Dec-12 112.50 DOWN 113 113 114 116 112 111 110
LEAD 31-Oct-12 112.10 DOWN 113 113 114 116 111 111 109
LEAD 30-Nov-12 112.30 DOWN 113 113 114 116 112 111 109
LEADMINI 31-Jan-13 112.60 DOWN 113 114 115 116 112 112 110
LEADMINI 30-Nov-12 112.30 DOWN 113 113 115 116 112 111 109
LEADMINI 31-Dec-12 112.50 DOWN 113 114 115 116 112 111 110
LEADMINI 31-Oct-12 112.10 DOWN 113 113 114 116 111 111 109
MENTHAOIL 31-Jan-13 1226.20 UP 1224 1237 1247 1270 1214 1201 1178
MENTHAOIL 31-Dec-12 1227.50 UP 1223 1240 1253 1282 1210 1193 1164
MENTHAOIL 30-Nov-12 1218.10 UP 1213 1231 1244 1275 1200 1182 1151
MENTHAOIL 31-Oct-12 1203.00 UP 1199 1218 1234 1268 1184 1165 1130
NATURALGAS 26-Dec-12 208.10 DOWN 209 212 215 221 206 203 197
NATURALGAS 27-Nov-12 201.00 DOWN 202 205 208 214 198 196 189
NATURALGAS 26-Oct-12 185.50 DOWN 187 190 194 202 182 179 172
NICKEL 31-Jan-13 930.40 DOWN 931 938 945 958 924 917 903
NICKEL 31-Dec-12 927.50 UP 926 934 941 957 919 910 895
NICKEL 30-Nov-12 919.70 UP 918 927 935 952 911 901 885
NICKEL 31-Oct-12 912.40 UP 911 920 928 945 903 894 877
NICKELM 31-Jan-13 931.80 UP 931 938 945 959 925 918 904
NICKELM 31-Dec-12 927.80 UP 926 935 942 958 919 909 893
NICKELM 30-Nov-12 920.10 UP 919 928 936 953 911 901 884
NICKELM 31-Oct-12 912.50 UP 911 920 928 945 903 894 877
POTATO 15-Oct-12 903.40 UP 848 896 888 928 856 808 768
POTATO 15-Mar-13 732.50 DOWN 733 735 737 742 730 728 724
POTATO 15-Apr-13 699.60 UP 697 703 706 715 694 688 679
POTATOTRWR 15-Oct-12 850.20 DOWN 865 870 889 913 846 841 817
SILVER 04-May-13 63252.00 DOWN 63501 63834 64415 65329 62920 62587 61673
SILVER 05-Mar-13 61700.00 DOWN 62033 62467 63233 64433 61267 60833 59633
SILVER 05-Dec-12 59959.00 DOWN 60294 60731 61502 62710 59523 59086 57878
SILVER1000 31-Dec-12 60725.00 UP 60725 61149 61574 62423 60300 59876 59027
SILVER1000 30-Nov-12 59922.00 DOWN 60224 60598 61274 62324 59548 59174 58124
SILVER1000 31-Oct-12 59506.00 DOWN 59945 60630 61754 63563 58821 58136 56327
SILVERM 30-Apr-13 63265.00 DOWN 63588 63977 64688 65788 62877 62488 61388
SILVERM 28-Feb-13 61724.00 DOWN 62044 62490 63257 64470 61277 60831 59618
SILVERM 30-Nov-12 59982.00 DOWN 60313 60770 61559 62805 59524 59067 57821
Keynote Capitals Ltd.
The Ruby,
9th Floor,
Senapati Bapat Marg,
Dadar (W), Mumbai, India – 400028
Tel: 30266000 / 22694322
www.keynotecapitals.com
3. MCX Commodities Intra-day Technical Levels For - 16/10/12
Commodity Contract Close Intra Day Pivot Resistance Support
Symbol Expiry 15/10/12 Trend Point R1 R2 R3 S1 S2 S3
SILVERMIC 30-Apr-13 63267.00 DOWN 63583 63984 64701 65819 62866 62465 61347
SILVERMIC 28-Feb-13 61721.00 DOWN 62047 62494 63267 64487 61274 60827 59607
SILVERMIC 30-Nov-12 59981.00 DOWN 60343 60808 61636 62929 59515 59050 57757
ZINC 31-Jan-13 103.75 DOWN 104 104 104 105 104 103 103
ZINC 31-Dec-12 102.70 DOWN 103 103 104 105 102 102 101
ZINC 30-Nov-12 101.90 DOWN 102 103 103 105 101 101 99
ZINC 31-Oct-12 100.45 DOWN 101 101 102 104 100 99 97
ZINCMINI 31-Jan-13 103.60 DOWN 104 104 105 106 103 103 102
ZINCMINI 31-Dec-12 102.90 DOWN 103 104 104 106 102 102 101
ZINCMINI 30-Nov-12 101.90 DOWN 102 103 103 105 101 101 99
ZINCMINI 31-Oct-12 100.45 DOWN 101 101 102 104 100 99 97
Sanjay Bhatia (AVP – Technical Research),
Email Id sanjay@keynotecapitals.net
Pivot Point: Intra- Day Trading Tool. - The key to the use of this tool is the use of Stop Loss
Intra Day Trend: It is valid only till the point where Price trades above Pivot Point. For Eg. “UP” would be valid till Price
remains above Pivot Point. It would become “DOWN” in event Price trades below Pivot Point.
Pivot Point (PP): This is a trigger point for Intra Day Buy / Sell based on the price range of the previous day.
R1: Resistance 1: 1st Resistance level over Pivot Point, R2: Resistance 2: Next Resistance level after R1.
R3: Resistance 3: Next Resistance level after R2.
S1: Support 1: 1st Support level after Pivot Point, S2: Support 2: Next Support level after S1.
S3: Support 3: Next Support level after S2.
Note: As per this tool, the trader should take BUY position just above the Pivot Point and keep the Pivot Point level as stop
loss and the first target would be R1 level (Resistance 1). If R1 is crossed then R2 (Resistance 2) becomes the next target
with the stop loss placed at R1 level. If R2 is crossed then R3 (Resistance 3) becomes the next target with the stop loss
placed at R2 level.
Similarly if price goes below the Pivot Point the trader should take a SELL position and keep the Pivot Point level as the
stop loss and the first target would be S1 level (Support 1). If S1 level is breached then S2 level (Support 2) becomes the
next target with the stop loss placed at S1 level. If S2 level is breached then S3 level (Support 3) becomes the next target
with the stop loss placed at S2 level.
Disclaimer: This document is not for public distribution and has been furnished to you solely for your information and must not be reproduced or
redistributed to any other person. Persons into whose possession this document may come are required to observe these restrictions. This material is
for the personal information of the authorized recipient, and we are not soliciting any action based upon it. This report is not to be construed as an offer
to sell or the solicitation of an offer to buy any security in any jurisdiction where such an offer or solicitation would be illegal. It is for the general
information of clients of Keynote Capitals Ltd. It does not constitute a personal recommendation or take into account the particular investment
objectives, financial situations, or needs of individual clients. We have reviewed the report, and in so far as it includes current or historical information,
it is believed to be reliable though its accuracy or completeness cannot be guaranteed. Neither Keynote Capitals Ltd., nor any person connected with
it, accepts any liability arising from the use of this document. The recipients of this material should rely on their own investigations and take their own
professional advice. Price and value of the investments referred to in this material may go up or down. Past performance is not a guide for future
performance. Certain transactions -including those involving futures, options and other derivatives as well as non-investment grade securities - involve
substantial risk and are not suitable for all investors. Reports based on technical analysis centers on studying charts of a stock’s price movement and
trading volume, as opposed to focusing on a company’s fundamentals and as such, may not match with a report on a company’s fundamentals.
Opinions expressed are our current opinions as of the date appearing on this material only. While we endeavor to update on a reasonable basis the
information discussed in this material, there may be regulatory, compliance, or other reasons that prevent us from doing so. Prospective investors and
others are cautioned that any forward-looking statements are not predictions and may be subject to change without notice. Our proprietary trading and
investment businesses may make investment decisions that are inconsistent with the recommendations expressed herein. We and our affiliates,
officers, directors, and employees world wide may: (a) from time to time, have long or short positions in, and buy or sell the securities thereof, of
company (ies) mentioned herein or (b) be engaged in any other transaction involving such securities and earn brokerage or other compensation or act
as a market maker in the financial instruments of the company (ies) discussed herein or act as advisor or lender / borrower to such company (ies) or
have other potential conflict of interest with respect to any recommendation and related information and opinions. The analyst for this report certifies
that all of the views expressed in this report accurately reflect his or her personal views about the subject company or companies and its or their
securities, and no part of his or her compensation was, is or will be, directly or indirectly related to specific recommendations or views expressed in this
report. No part of this material may be duplicated in any form and/or redistributed without Keynote Capitals Ltd’s., prior written consent.
Keynote Capitals Ltd.
The Ruby,
9th Floor,
Senapati Bapat Marg,
Dadar (W), Mumbai, India – 400028
Tel: 30266000 / 22694322
www.keynotecapitals.com