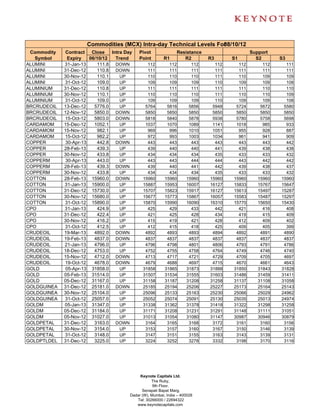
2. Commodities (MCX) Intra-day Technical Levels For
08/10/12 _
Commodity Contract Close Intra Day Pivot Resistance Support
Symbol Expiry 06/10/12 Trend Point R1 R2 R3 S1 S2 S3
GOLDPTLDEL 30-Nov-12 3193.0 DOWN 3199 3213 3233 3267 3179 3165 3131
GOLDPTLDEL 31-Oct-12 3250.0 DOWN 3256 3281 3313 3370 3224 3199 3142
KAPAS 30-Apr-13 910.0 DOWN 910 915 921 931 905 900 890
KAPAS 30-Mar-13 886.6 UP 886 891 896 906 881 876 866
KAPASKHALI 30-Apr-13 1465.0 UP 1463 1472 1478 1493 1457 1448 1433
KAPASKHALI 30-Mar-13 1438.0 UP 1438 1440 1443 1448 1435 1433 1428
KAPASKHALI 28-Feb-13 1422.0 UP 1421 1429 1435 1449 1415 1407 1393
KAPASKHALI 31-Jan-13 1406.5 UP 1403 1412 1418 1433 1397 1388 1373
KAPASKHALI 31-Dec-12 1393.5 UP 1390 1400 1406 1422 1384 1374 1358
LEAD 31-Jan-13 118.9 DOWN 119 119 119 119 119 119 119
LEAD 31-Dec-12 118.8 UP 119 119 119 119 119 118 118
LEAD 30-Nov-12 118.6 UP 119 119 119 119 118 118 118
LEAD 31-Oct-12 118.5 UP 118 119 119 120 118 118 117
LEADMINI 31-Jan-13 118.9 DOWN 119 119 119 119 119 119 118
LEADMINI 31-Dec-12 118.8 DOWN 119 119 119 119 119 118 118
LEADMINI 30-Nov-12 118.6 UP 119 119 119 120 118 118 117
LEADMINI 31-Oct-12 118.5 UP 118 119 119 120 118 118 117
MENTHAOIL 31-Jan-13 1156.9 DOWN 1165 1177 1196 1228 1145 1133 1101
MENTHAOIL 31-Dec-12 1151.5 DOWN 1156 1171 1190 1225 1137 1122 1087
MENTHAOIL 30-Nov-12 1136.3 DOWN 1148 1168 1200 1252 1116 1096 1044
MENTHAOIL 31-Oct-12 1121.6 DOWN 1127 1142 1163 1198 1107 1092 1057
NATURALGAS 26-Dec-12 200.3 UP 200 201 201 202 200 199 198
NATURALGAS 27-Nov-12 191.9 UP 192 192 193 194 191 191 190
NATURALGAS 26-Oct-12 176.7 UP 176 178 178 181 175 174 172
NICKEL 31-Jan-13 973.6 DOWN 974 974 974 975 973 973 972
NICKEL 31-Dec-12 968.5 UP 968 969 970 972 968 967 965
NICKEL 30-Nov-12 961.3 UP 961 962 963 965 960 959 956
NICKEL 31-Oct-12 954.7 UP 954 956 957 961 953 950 947
NICKELM 31-Jan-13 975.1 UP 975 976 978 980 974 972 970
NICKELM 31-Dec-12 968.4 DOWN 968 969 970 971 968 967 966
NICKELM 30-Nov-12 961.4 UP 961 963 964 967 960 958 955
NICKELM 31-Oct-12 954.6 UP 954 956 957 960 953 951 948
POTATO 15-Apr-13 691.1 UP 686 701 710 734 676 661 637
POTATO 15-Mar-13 725.1 UP 723 728 731 739 720 715 708
POTATO 15-Oct-12 828.4 DOWN 830 834 840 850 824 820 810
POTATOTRWR 15-Oct-12 885.2 DOWN 885 885 885 885 885 885 885
SILVER 04-May-13 65024.0 DOWN 65025 65049 65075 65125 64999 64975 64925
SILVER 05-Mar-13 63506.0 UP 63497 63544 63582 63667 63459 63412 63327
SILVER 05-Dec-12 61800.0 UP 61788 61861 61922 62056 61727 61654 61520
SILVER1000 30-Nov-12 61818.0 DOWN 61823 61841 61865 61907 61799 61781 61739
SILVER1000 31-Oct-12 61338.0 DOWN 61449 61629 61919 62389 61159 60979 60509
SILVERM 30-Apr-13 65074.0 UP 65072 65102 65130 65188 65044 65014 64956
SILVERM 28-Feb-13 63532.0 UP 63526 63580 63629 63732 63477 63423 63320
SILVERM 30-Nov-12 61816.0 UP 61806 61914 62011 62216 61709 61601 61396
Keynote Capitals Ltd.
The Ruby,
9th Floor,
Senapati Bapat Marg,
Dadar (W), Mumbai, India – 400028
Tel: 30266000 / 22694322
www.keynotecapitals.com
3. Commodities (MCX) Intra-day Technical Levels For
08/10/12 _
Commodity Contract Close Intra Day Pivot Resistance Support
Symbol Expiry 06/10/12 Trend Point R1 R2 R3 S1 S2 S3
SILVERMIC 30-Apr-13 65085.0 UP 65081 65118 65150 65219 65049 65012 64943
SILVERMIC 28-Feb-13 63526.0 DOWN 63548 63658 63789 64030 63417 63307 63066
SILVERMIC 30-Nov-12 61820.0 UP 61815 61905 61990 62165 61730 61640 61465
ZINC 31-Jan-13 109.3 UP 109 109 109 110 109 109 109
ZINC 31-Dec-12 108.7 DOWN 109 109 109 109 109 109 108
ZINC 30-Nov-12 108.2 UP 108 108 109 109 108 107 107
ZINC 31-Oct-12 107.3 UP 107 108 108 108 107 107 106
ZINCMINI 31-Jan-13 109.2 DOWN 109 109 109 110 109 109 109
ZINCMINI 31-Dec-12 108.7 UP 109 109 109 109 109 108 108
ZINCMINI 30-Nov-12 108.1 UP 108 108 108 109 108 108 107
ZINCMINI 31-Oct-12 107.3 UP 107 108 108 108 107 107 106
Sanjay Bhatia (AVP – Technical Research),
Email Id sanjay@keynotecapitals.net
Pivot Point: Intra- Day Trading Tool. - The key to the use of this tool is the use of Stop Loss
Intra Day Trend: It is valid only till the point where Price trades above Pivot Point. For Eg. “UP” would be valid till Price
remains above Pivot Point. It would become “DOWN” in event Price trades below Pivot Point.
Pivot Point (PP): This is a trigger point for Intra Day Buy / Sell based on the price range of the previous day.
R1: Resistance 1: 1st Resistance level over Pivot Point, R2: Resistance 2: Next Resistance level after R1.
R3: Resistance 3: Next Resistance level after R2.
S1: Support 1: 1st Support level after Pivot Point, S2: Support 2: Next Support level after S1.
S3: Support 3: Next Support level after S2.
Note: As per this tool, the trader should take BUY position just above the Pivot Point and keep the Pivot Point level as stop
loss and the first target would be R1 level (Resistance 1). If R1 is crossed then R2 (Resistance 2) becomes the next target
with the stop loss placed at R1 level. If R2 is crossed then R3 (Resistance 3) becomes the next target with the stop loss
placed at R2 level.
Similarly if price goes below the Pivot Point the trader should take a SELL position and keep the Pivot Point level as the
stop loss and the first target would be S1 level (Support 1). If S1 level is breached then S2 level (Support 2) becomes the
next target with the stop loss placed at S1 level. If S2 level is breached then S3 level (Support 3) becomes the next target
with the stop loss placed at S2 level.
Disclaimer: This document is not for public distribution and has been furnished to you solely for your information and must not be reproduced or
redistributed to any other person. Persons into whose possession this document may come are required to observe these restrictions. This material is
for the personal information of the authorized recipient, and we are not soliciting any action based upon it. This report is not to be construed as an offer
to sell or the solicitation of an offer to buy any security in any jurisdiction where such an offer or solicitation would be illegal. It is for the general
information of clients of Keynote Capitals Ltd. It does not constitute a personal recommendation or take into account the particular investment
objectives, financial situations, or needs of individual clients. We have reviewed the report, and in so far as it includes current or historical information, it
is believed to be reliable though its accuracy or completeness cannot be guaranteed. Neither Keynote Capitals Ltd., nor any person connected with it,
accepts any liability arising from the use of this document. The recipients of this material should rely on their own investigations and take their own
professional advice. Price and value of the investments referred to in this material may go up or down. Past performance is not a guide for future
performance. Certain transactions -including those involving futures, options and other derivatives as well as non-investment grade securities - involve
substantial risk and are not suitable for all investors. Reports based on technical analysis centers on studying charts of a stock’s price movement and
trading volume, as opposed to focusing on a company’s fundamentals and as such, may not match with a report on a company’s fundamentals.
Opinions expressed are our current opinions as of the date appearing on this material only. While we endeavor to update on a reasonable basis the
information discussed in this material, there may be regulatory, compliance, or other reasons that prevent us from doing so. Prospective investors and
others are cautioned that any forward-looking statements are not predictions and may be subject to change without notice. Our proprietary trading and
investment businesses may make investment decisions that are inconsistent with the recommendations expressed herein. We and our affiliates,
officers, directors, and employees world wide may: (a) from time to time, have long or short positions in, and buy or sell the securities thereof, of
company (ies) mentioned herein or (b) be engaged in any other transaction involving such securities and earn brokerage or other compensation or act
as a market maker in the financial instruments of the company (ies) discussed herein or act as advisor or lender / borrower to such company (ies) or
have other potential conflict of interest with respect to any recommendation and related information and opinions. The analyst for this report certifies
that all of the views expressed in this report accurately reflect his or her personal views about the subject company or companies and its or their
securities, and no part of his or her compensation was, is or will be, directly or indirectly related to specific recommendations or views expressed in this
report. No part of this material may be duplicated in any form and/or redistributed without Keynote Capitals Ltd’s., prior written consent.
Keynote Capitals Ltd.
The Ruby,
9th Floor,
Senapati Bapat Marg,
Dadar (W), Mumbai, India – 400028
Tel: 30266000 / 22694322
www.keynotecapitals.com