SlideShare a Scribd company logo
1 of 23
Download to read offline
Merrill Lynch does and seeks to do business with companies covered in its research reports. As a result, investors should be aware that the firm may
have a conflict of interest that could affect the objectivity of this report. Investors should consider this report as only a single factor in making their
investment decision. Customers of Merrill Lynch in the US can receive independent, third-party research on companies covered in this report, at no cost
to them, if such research is available. Customers can access this independent research at http://www.ml.com/independentresearch or can call 1-800-637-
7455 to request a copy of this research.
Refer to important disclosures on page 22 to 23. Analyst Certification on page 21. Price Objective Basis & Risk on page 21 10671171
Asset Management
Defensive, but not immune
Historical view – defensive, but only up to a point
Asset managers have been relatively defensive within financials this year, but we
would not assume this will last forever. That’s because their business model is
well designed to withstand short, sharp shocks to the economy like the 1994
Mexican peso devaluation and the LTCM crisis, in our opinion, but they tend to
sag during more serious economic declines.
Asset managers tend to under-perform in long downdrafts
Given recent economic data pointing to a potential slowing – and weakness in the
shares in recent days -- we examined the group’s behavior in 1990, 1995, 1998,
and 2001. In 2 of 4 slowdowns, they under-performed the S&P, particularly in
1990 recession. Multiple compression was responsible for much of the
under-performance, as their forward P/E fell by an average of 2x, or 11%. Net
flows (which often drive multiples) declined as well. During the declines, fixed
income managers fared the best. Afterward, most managers bounced back
quickly with equity markets, however.
Should a long downturn occur, we see potential downside given the group is
trading at a 27% premium vs. S&P 500, greater than usual. In addition, managers
are more equity-focused: Their assets under management average 70% equity
vs. 40% in 1990 and 63% in 2001. On the positive side, asset managers have
become much more global, both in terms of distribution and what they invest in,
which might buffer a U.S. slowdown.
Should there be a major economic slowdown, past patterns would suggest a 10-
25% decline in the group, mostly due to multiple compression. We are not
anticipating this, though, so for now maintain our positive but selective outlook.
We have Buy ratings on 4 of 14 asset managers in our universe: Growth
managers Calamos and Waddell & Reed (benefiting from the growth vs. value
rotation, and their key funds continue to out-perform); AllianceBernstein, trading at
a 23% discount, with a 7%+ projected yield; and AMG, an acquirer which has
survived past downturns well by acquiring. Although we like T. Rowe Price and
Janus, we think they are fairly valued.
Industry Overview
Equity | Americas | Asset Management
12 November 2007
Cynthia Mayer +1 212 449 5130
Research Analyst
MLPF&S
cynthia_mayer@ml.com
Guy Moszkowski, CFA +1 212 449 7800
Research Analyst
MLPF&S
guy_moszkowski@ml.com
Kevin Cheng +1 212 449 1167
Research Analyst
MLPF&S
kevin_cheng@ml.com
Chart 1: Asset Manager Index, 1988-present
0
2000
4000
6000
8000
10000
12000
14000
16000
12/'87 12/'89 12/'91 12/'93 12/'95 12/'97 12/'99 12/'01 12/'03 12/'05
0
200
400
600
800
1000
1200
1400
1600
1800
Recession bars ML AM Index (LHS) S&P 500 (RHS)
Source: Factset, Merrill Lynch
Asset Management
12 November 2007
2
Defensive, but only up to a point
Asset managers have been a relatively good place to hide in financials so far this
year. They are up about 13% while banks and brokers are down 22%. We think
this reflects their lower sensitivity to yield curves, credit risk, and relatively little
direct exposure to sub-prime issues.
In addition, asset managers tend to out-perform in up markets and under-perform
in down markets. Their r-squared vs. the S&P 500 since 1996 is .38, and so far
this year they are out-performing, as expected in an up year (Chart 2 below).
Chart 2: Annual performance of asset manager group and S&P 500 since 2000
23%
18%
21%
13%
37%
-40%
-30%
-20%
-10%
0%
10%
20%
30%
40%
50%
60%
2000 2001 2002 2003 2004 2005 2006 YTD
Asset Managers S&P 500
Source: Merrill Lynch
Longer downturns a threat
But longer economic slowdowns are another matter, because the average assets
gradually sag, lower employment may mean lower 401(k) contributions, and in
consumer-led recessions, retail investors tend to slow sales or even redeem.
Given recent economic data pointing to a potential slowing, we examined the
group’s behavior in 1990, 1995, 1998, and 2001. We concluded that asset
managers tend to under-perform in market declines connected to economic
slowdowns, but not as badly as some other financials including brokers.
The classic asset manager model –
earning fees on average assets -– is ideal
for riding through short, sharp shocks…
..but longer economic slowdowns are
another matter, because the average
assets gradually sag, and sales slow,
which can hurt multiples.
Asset Management
12 November 2007
3
In 2 of 4 slowdowns, they under-performed the S&P, particularly in 1990
recession. Asset managers out-performed in 1995-6 however, suggesting
resiliency during short shocks in rising markets; they also out-performed as the
tech bubble burst in 2000-2002, though in real terms they declined 20%.
Table 1: Asset manager performance during economic slowdowns (ML indices as measured
from S&P 500 peak to trough)
ML AM ML Broker
Time Frame Index S&P 500 Index
May '90 - Oct '90 (including
recession) -24.4% -15.8% -28.9%
Jul '95 - Jul '96 26.9 14.6 6.8
Jul '98 - Oct '98 -11.4 -4.3 -35.7
Dec '00 - Dec '02 (including
recession) -20.3 -33.4 -40.4
Source: Factset and Merrill Lynch
Table 2: Multiple compression for group during equity market weakness coinciding with
economic slowdowns (ML indices measured at nearest quarter-end)
Forward four quarter P/E
Date Starting Ending Change % decline
1Q90 - 3Q90 13.8x 9.5x 4.3x -31%
2Q95 - 2Q96 13.7 13.7 0.0 0%
2Q98 - 3Q98 19.3 14.8 4.5 -23%
4Q00 - 4Q02 17.9 16.4 1.5 -8%
Average 16.2 13.6 2.6 -16%
2Q07 - present 19.7x 18.1x 1.6 -8.1%
Source: Factset and Merrill Lynch
Multiple compression was responsible for much of the under-performance during
their declining periods, as their forward P/E fell by an average of 2x, or 11%.
Net flows -- which often drive multiples --declined as well.
Strong balance sheets probably helped, but weren’t a complete defense against
the declines either. T. Rowe Price and Franklin began 1Q90 with $5 and $7 per
share in net cash and investments respectively. This was equivalent to 19% and
10% of their market capitalization, similar to current levels of 10% and 12%. The
cash came in handy -- T. Rowe Price used some of its cash to make whole an
investment, and Franklin had increased charge-offs in its banking business – but
it did not stop their share prices from declining. In the 4 sections ahead, we look
in detail at the group’s performance in 1990, 1995, 1998, and 2001.
Multiple compression was responsible for
much of the under-performance, as their
forward P/E fell by an average of 2x, or 11%.
Asset Management
12 November 2007
4
1990 – a time to avoid asset managers
Asset managers under-performed the broader market at the start of the 1990
recession. For those who believe current economic conditions most resemble
1990 (including ML strategist Richard Bernstein) this is obviously a bad sign.
There are similarities: In 1990, growth was slowing, and credit and housing were
issues. The June 1990 Federal Reserve Beige book sounded similar warnings,
noting for instance that “[retail] sales have been slow in recent months, and are
expected to remain so in the short term…Lenders are reported to have tightened
standards especially for real estate loans, but there is still little information that
suggests credit restraint is spreading into other markets.”
Asset managers directionally followed the market up, then down
The asset managers rose strongly ahead of the July 1990 recession, but as the
Fed cut rates and the 8-month recession began, they fell hard (Chart 3).
Chart 3: Asset manager index vs. S&P 500 1989-1991 (actual recession was 7/90 – 3/91)
80
130
180
230
280
330
380
430
480
12/30/88 6/30/89 12/30/89 6/30/90 12/30/90 6/30/91 12/30/91
200
250
300
350
400
450
Recession bars ML AM Index (LHS) S&P 500 (RHS)
First Fed rate cut
(6/6/89)
Fed rate cuts
1989 - 1991
Second series of
Fed rate cuts (7/13/90)
Source: Federal Reserve Board, Merrill Lynch Economics
As equity markets declined, equity fund flows also declined, and the industry had
equity fund outflows briefly in 3Q90. Equity fund inflows recovered in 1991, but
bond funds remained more popular (Chart 4).
Asset Management
12 November 2007
5
Chart 4: Mutual fund net flows for equity and bond funds (industry-wide, $MM); equity fund
flows were weak during market declines, including the first half of the recession
-$10,000
$0
$10,000
$20,000
$30,000
$40,000
Q1'89
Q2'89
Q3'89
Q4'89
Q1'90
Q2'90
Q3'90
Q4'90
Q1'91
Q2'91
Q3'91
Q4'91
Equity
Bond
Source: Strategic Insight Simfund
As the S&P 500 declined, asset managers declined more
The asset managers under-performed, even though their businesses continued to
grow. There were only a handful of small, relatively fast-growing public asset
managers at the time. When the S&P 500 declined about 16% from peak in May
to trough in October 1990, the group collectively declined an average of 27%.
Even fixed income managers under-performed (Table 3).
Table 3: Performance of asset managers in 1990 (operating changes from 1989 to 1990; share price declines from broad market peak to trough)
% change 1989 - 1990 Stock price AUM % equity AUM % equity
Assets under management Revenues EPS May 90 - Oct 90 at Dec '89 at Dec '90
Alliance Capital 5.7% 18.5% 33.3% -14.1% 64% 66%
Franklin* 8.9 13.6 14.0 -30.2 14 12
T. Rowe Price*** 8.7 6.6 -7.2 -42.5 59 61
Legg Mason* 20.0 14.2 88.6 -23.4 34 43
Eaton Vance** 2.8 46.2 23.0 -23.5 29 25
Average 9.2 19.8 30.3 -26.7 40 41
S&P 500 -15.8
Source: Company Reports and Merrill Lynch
*Note: BEN - data reflects FY 9/'89 to 9/'90; LM - FY 3/'90 to 3/'91
** EV - FY 10/'89 to 10/'90; revenues include mutual fund acquired from Bank of New England; EPS ex-unrealized losses on gold-mining partnership.
*** TROW EPS adjusted for MRT losses.
Asset Management
12 November 2007
6
Share decline mostly due to multiple contraction…
Most of the decline was due to multiple contraction, as the group average fell
from 13.8x forward four quarter estimates to 9.5x in the space of two quarters
(Chart 5, see highlighted bars). Asset manager multiples often follow net flows,
and equity fund flows turned negative in 3Q90 and 4Q90 for most managers.
Chart 5: Forward P/e of asset managers on absolute basis (1Q90 –
3Q90 highlighted)
Asset Manager Composite Forward P/E
18.1x
16.1x
0.0x
5.0x
10.0x
15.0x
20.0x
25.0x
1Q90
1Q91
1Q92
1Q93
1Q94
1Q95
1Q96
1Q97
1Q98
1Q99
1Q00
1Q01
1Q02
1Q03
1Q04
1Q05
1Q06
1Q07
Average:
13.8x
9.5x
Source: FactSet, First Call and Merrill Lynch
Chart 6: Relative forward P/e of asset managers vs. the S&P 500 (1Q90
– 3Q90 highlighted)
Forward Multiple of Asset Managers vs. S&P 500, 1990-Present
127%88%
0%
10%
20%
30%
40%
50%
60%
70%
80%
90%
100%
110%
120%
130%
140%
150%
1Q90
1Q91
1Q92
1Q93
1Q94
1Q95
1Q96
1Q97
1Q98
1Q99
1Q00
1Q01
1Q02
1Q03
1Q04
1Q05
1Q06
1Q07
Average =
94%
66%
Source: FactSet, First Call and Merrill Lynch
Asset Management
12 November 2007
7
Over full 1990-91 recession, asset managers actually did well
Interestingly, while asset managers under-performed during the beginning of the
1990 recession, they out-performed over the full recession (Chart 7).
Chart 7: Asset manager price performance during actual recession 7/90 – 3/91
60
70
80
90
100
110
120
130
140
150
Jul-90 Aug-90 Sep-90 Oct-90 Nov-90 Dec-90 Jan-91 Feb-91 Mar-91
asset managers S&P 500 brokers
S&P 500 +4%
asset mgrs +24%
brokers +42%
(July 1, 1990 = 100)
Source: Factset and Merrill Lynch
Lessons learned
- The onset of recessions don’t seem to be good times to own asset managers,
judging by 1990. A single rate cut didn’t seem to help them or the market.
- Asset managers do out-perform in up markets, however, even those which
occur mid-recession. When a series of rate cuts revived the market in 1990, asset
managers snapped back too, eventually out-performing.
Asset managers under-performed at the
beginning of the 1990 recession, but out-
performed over the full recession.
Asset Management
12 November 2007
8
1995-1996 – asset managers led the market up
Asset managers were rattled by economic setbacks in 1995-1996, but only
briefly. In this case, the problems were short-lived, and the companies’ net flows
were not particularly affected. The broader market was rising, and the asset
manager stocks ultimately out-performed the equity market.
The Fed cut rates in July 1995 were precipitated by a few specific events:
- a temporary monetary squeeze in December 1994 (marked by the
Orange County bankruptcy);
- the December 1994 devaluation of the Mexican peso;
- sluggish economic conditions: Retail sales were weak, unemployment
claims were rising, and real wages were flat.
Asset manager shares were weak immediately following both Fed rate cuts, but
eventually went up with the market. In the roughly 13 months which followed the
first Fed rate cut, the S&P 500 rose 15% and the asset managers rose 27%. (Chart
9 and Table 4). Equity fund flows barely registered any change during the period,
though bond fund flows were pressured (especially munis) throughout (Chart 8).
Chart 9: Asset manager index vs. the S&P 500, 1995 – 1996 (with Fed easings marked)
560
660
760
860
960
1060
1160
1260
1/3/1995 5/3/1995 9/3/1995 1/3/1996 5/3/1996 9/3/1996
400
450
500
550
600
650
700
750
ML AM Index (LHS) S&P 500 (RHS)
First Fed cut (7/6/95)
Fed rate cuts
1995 - 1996
Source: Federal Reserve Board, Merrill Lynch
Chart 8: Equity and bond fund flows 1995-96
-$10,000
$0
$10,000
$20,000
$30,000
$40,000
$50,000
$60,000
$70,000
$80,000
Q1'95 Q2'95 Q3'95 Q4'95 Q1'96 Q2'96 Q3'96 Q4'96
Equity
Bond
Source: Strategic Insight Simfund and Merrill Lynch
Asset Management
12 November 2007
9
Multiple started low, so didn’t contract
Unlike 1990, there was no multiple contraction in 1995-6. The group’s average
started at a low 13.7x forward four quarters and stayed there (Chart 10), though
their relative P/E did lose ground (Chart 11).
Lessons learned:
- the asset manager model is designed well to withstand short, sharp
shocks. Because they bill on average assets under management, there
is a delay before the impact to earnings is felt, during which time the
economy and equity markets may recover, supporting multiples again.
- A low multiple is the best defense against multiple contraction
Table 4: Asset manager index returns vs. S&P 500 and brokers in 1995-6
ML AM ML Broker
Time Frame Index S&P 500 Index
Jul '95 - Jul '96 26.9% 14.6% 6.8%
Source: Factset and Merrill Lynch
Chart 10: Asset managers forward four quarter P/E, 2Q95 and 2Q96
highlighted
Asset Manager Composite Forward P/E
18.1x
16.1x
0.0x
5.0x
10.0x
15.0x
20.0x
25.0x
1Q90
1Q91
1Q92
1Q93
1Q94
1Q95
1Q96
1Q97
1Q98
1Q99
1Q00
1Q01
1Q02
1Q03
1Q04
1Q05
1Q06
1Q07
Average:
13.7x 13.7x
Source: FactSet, First Call and Merrill Lynch
Chart 11: Asset managers forward four quarter P/E vs. S&P 500, 2Q95
and 2Q96 highlighted
Forward Multiple of Asset Managers vs. S&P 500, 1990-Present
127%88%
0%
10%
20%
30%
40%
50%
60%
70%
80%
90%
100%
110%
120%
130%
140%
150%
1Q90
1Q91
1Q92
1Q93
1Q94
1Q95
1Q96
1Q97
1Q98
1Q99
1Q00
1Q01
1Q02
1Q03
1Q04
1Q05
1Q06
1Q07
Average =
88% 79%
Source: FactSet, First Call and Merrill Lynch
Asset Management
12 November 2007
10
1998 – trouble for international managers
The 1998 period was another one in which asset manager stocks were briefly
rattled by shocks, but recovered. However this time they did not recover to the
same extent as the broader market, perhaps because the Russian default had
direct bearing on the popularity of emerging markets and other international
funds. Franklin Resources, with its large Templeton unit, remained below its stock
price highs for almost 6 years before recovering (Chart 12).
Chart 13: Asset manager index and the S&P 500 during 1997 – 1998
560
1060
1560
2060
2560
3060
3560
12/31/1996 4/30/1997 8/31/1997 12/31/1997 4/30/1998 8/31/1998 12/31/1998
600
700
800
900
1000
1100
1200
1300
ML AM Index (LHS) S&P 500 (RHS)
First Fed cut (9/29/98)
Fed rate cuts
1997 - 1998
Source: Federal Reserve Board, Merrill Lynch
Initially, asset manager stocks followed the market down (Chart 13). But while the
broader market recovered, asset managers and brokers did not fully recover in line.
Net flows to equity and bond funds also did not recover in 4Q98, or even 1999
(Chart 14). Overall, the asset managers under-performed the S&P 500 (Table 5).
Table 5: 1998 returns of the ML asset management index, S&P 500, and ML broker index
ML AM ML Broker
Time Frame Index S&P 500 Index
Jul '98 - Oct '98 -11.4% -4.3% -35.7%
Source: Factset and Merrill Lynch
Chart 12: BEN stock price — A long recovery
20
25
30
35
40
45
50
55
60
Jan-98 Jan-99 Jan-00 Jan-01 Jan-02 Jan-03 Jan-04
BEN
Source: Bloomberg, Merrill Lynch
Chart 14: Equity and bond fund flows ($MM)
0
10,000
20,000
30,000
40,000
50,000
60,000
70,000
Q1'97 Q2'97 Q3'97 Q4'97 Q1'98 Q2'98 Q3'98 Q4'98
Equity
Bond
Source: Strategic Insight Simfund and Merrill Lynch
Asset Management
12 November 2007
11
Rapid multiple contraction
The group’s average multiple contracted rapidly, reflecting the impact of sudden
news, falling from 19.3x to 14.8x in one quarter (Chart 15). This was also
arguably the beginning of the end to the tech bubble, and asset managers
remained at a discount to the tech-heavy S&P 500 for several years (Chart 16).
Lessons learned
- When an asset class falls out of favor, asset manager specialists in that
area may be challenged for years
- Asset managers don’t always out-perform in an up market, for instance if
net flows are weak
Chart 15: Asset managers forward four quarter P/E, 2Q98 and 3Q98
highlighted
Asset Manager Composite Forward P/E
18.1x
16.1x
0.0x
5.0x
10.0x
15.0x
20.0x
25.0x
1Q90
1Q91
1Q92
1Q93
1Q94
1Q95
1Q96
1Q97
1Q98
1Q99
1Q00
1Q01
1Q02
1Q03
1Q04
1Q05
1Q06
1Q07
Average:
19.3x
14.8x
Source: FactSet, First Call and Merrill Lynch
Chart 16: Asset managers forward four quarter P/E vs. S&P 500, 2Q98
and 3Q98 highlighted
Forward Multiple of Asset Managers vs. S&P 500, 1990-Present
127%88%
0%
10%
20%
30%
40%
50%
60%
70%
80%
90%
100%
110%
120%
130%
140%
150%
1Q90
1Q91
1Q92
1Q93
1Q94
1Q95
1Q96
1Q97
1Q98
1Q99
1Q00
1Q01
1Q02
1Q03
1Q04
1Q05
1Q06
1Q07
Average =
78%
65%
Source: FactSet, First Call and Merrill Lynch
Asset Management
12 November 2007
12
The 2001-2002 bear market
The 2001-2002 bear market was the most prolonged test of asset managers, and
they all declined with the exception of Nuveen. However, they out-performed the
S&P 500, which had the disadvantage of being weighed down by tech.
Chart 17: Asset manager index and the S&P 500 during 2000 – 2002
3500
4000
4500
5000
5500
6000
6500
7000
7500
12/29/00 3/29/01 6/29/01 9/29/01 12/29/01 3/29/02 6/29/02 9/29/02 12/29/02
700
800
900
1000
1100
1200
1300
1400
Recession bars ML AM Index (LHS) S&P 500 (RHS)
First Fed cut (1/3/01)
Fed rate cuts
2000 - 2002
Source: Federal Reserve Board, Merrill Lynch
Asset Management
12 November 2007
13
Contrary to popular belief, there were not large equity outflows during the bear
market, but rather a decline in sales which led to softer flows and 2 quarters of
outflows (Chart 18). Bond funds grew in popularity and picked up some of the
slack, especially government and short-term bond funds in those quarters with
equity outflows.
Chart 18: Equity and bond fund flows 2000 through 2002 ($MM)
-80,000
-60,000
-40,000
-20,000
0
20,000
40,000
60,000
80,000
100,000
120,000
140,000
Q1'00
Q2'00
Q3'00
Q4'00
Q1'01
Q2'01
Q3'01
Q4'01
Q1'02
Q2'02
Q3'02
Q4'02
Equity
Bond
Source: Strategic Insight Simfund and Merrill Lynch
Asset Management
12 November 2007
14
Fixed income managers held up better
Fixed income managers out-performed equity managers. Nuveen’s assets even
rose 29% during this period, mostly through the sale of muni closed-end funds.
Other fixed income managers lost assets, but at a much slower rate.
Affiliated Managers Group (AMG) and Legg Mason, the two managers with
acquisition / revenue-sharing models (and therefore less operating leverage) also
seemed to do better than average. AMG survived relatively well thanks to several
acquisitions. In all it acquired assets worth 20% of its starting AUM. This kept its
EPS relatively flat during the period (-1%), and limited its share price downside
(-8%). However, AMG declined in 2003 when acquisitions paused for a year.
Table 6: Asset Manager bear market performance (2000 – 2002)
% change '02/'00
AUM Revenues EPS Stock price AUM % equity AUM % equity
(Dec'00 - Dec'02) (Dec'00 - Dec'02) at Dec '00 at Dec '02
Equity focus
AB -14.8% -25.0% -29.4% -38.8% 60% 55%
AMG -8.6 3.5 -1.2 -8.3 74 84
BEN 7.4 4.2 -30.6 -10.6 66 47
JNS -46.3 -52.4 -85.9 -66.9 94 83
TROW -15.7 -24.1 -26.9 -35.5 74 67
WDR -23.4 -15.7 -33.3 -47.7 88 76
WPL -24.8 -32.5 -44.6 -31.1 100 100
Equity manager average -18.0 -20.3 -36.0 -34.1 79.4% 73.1%
Fixed income focus
BLK 33.9 21.1 51.1 -6.2 13 7
FII 54.7 9.2 37.0 -12.9 15 10
LM 58.3 8.5 9.2 -10.9 33 38
EV 23.4 21.4 8.0 -12.4 45 42
JNC 28.6 7.8 23.0 32.3 38 29
Fixed income manager average 39.8 13.6 25.7 -2.0 29% 25%
Group Average 6.1 -6.2 -10.3 -20.7 58% 53%
S&P 500 -33.4
Source: Company Reports, Factset and Merrill Lynch
Asset Management
12 November 2007
15
In relative terms, group out-performed S&P 500, but it wasn’t hard
Relative to the S&P 500, asset managers actually out-performed during the bear
market. One of the oddities of asset manager history is that the group hit its
relative valuation trough (48%) during the tech bubble, when many assume it
should have done well. We attribute this to the fact that the group had lost traction
to index funds in the 1990s, investors were buying a limited number of funds
heavily, and that toward the end of the bull market, the S&P 500 was distorted by
its heavy tech weighting.
As a result, the group entered 2001 trading at a 28% discount to the S&P 500.
After the S&P 500 declined 33% in the next two years, asset managers ended the
bear market on a relative par (Chart 20 below).
Lessons learned:
- Fixed income managers survive equity downturns better, but may also
decline.
- A tech-heavy index is easier to beat in a downturn. However, now the
S&P 500 is more weighted toward financials, so asset managers are
less likely to out-perform, because they would have to in a sense out-
perform themselves.
Chart 19: Asset manager forward P/E on absolute basis in bear
market, 4Q00 and 4Q02 multiples highlighted
Asset Manager Composite Forward P/E
18.1x
16.1x
0.0x
5.0x
10.0x
15.0x
20.0x
25.0x
1Q90
1Q91
1Q92
1Q93
1Q94
1Q95
1Q96
1Q97
1Q98
1Q99
1Q00
1Q01
1Q02
1Q03
1Q04
1Q05
1Q06
1Q07
Average:
17.9x
16.4x
Source: First Call, FactSet and Merrill Lynch
Chart 20: Asset manager forward P/E vs. S&P 500 in bear market,
4Q00 and 4Q02 highlighted
Forward Multiple of Asset Managers vs. S&P 500, 1990-Present
127%88%
0%
10%
20%
30%
40%
50%
60%
70%
80%
90%
100%
110%
120%
130%
140%
150%
1Q90
1Q91
1Q92
1Q93
1Q94
1Q95
1Q96
1Q97
1Q98
1Q99
1Q00
1Q01
1Q02
1Q03
1Q04
1Q05
1Q06
1Q07
Average =
72%
96%
Source: First Call, FactSet and Merrill Lynch
Asset Management
12 November 2007
16
Current situation – out-performing
Asset managers are out-performing the S&P 500 this year, as is to be expected in
an overall up market. They are up 14%, ahead of the S&P 500 (+4%) (Chart 21).
They are trouncing other financials, particularly banks (-22%).
Chart 21: Asset manager index and the S&P 500 – 2007 YTD
90
95
100
105
110
115
120
125
12/29 1/29 2/28 3/29 4/29 5/29 6/29 7/29 8/29 9/29 10/29
S&P 500 ML AM Index
+4.0%
+14.2%
Fed rate cut
Source: Federal Reserve Board, Merrill Lynch
Fed-inspired rally helped out-performance, and is typical
Some of the out-performance followed the Fed’s 50bps rate cut. This has been
their pattern in the past as well (Tables 8 and 9).
Table 7: Sector average relative price performance following the last four Fed easing cycles
(initiating in 1990, 1995, 1998, 2000, as measured from previous month)
Relative Price Performance Following Cut
3-mths 6-mths 12-mths 18-mths 24-mths
Consumer Discretionary 1.5% 3.7% -0.6% 0.3% 0.5%
Consumer Staples 1.6 -0.7 4.0 5.8 7.7
Energy 0.1 -0.4 3.9 1.2 2.6
Financials -0.5 -0.5 -8.0 -1.5 5.1
Health Care 0.3 2.1 6.2 4.1 12.2
Industrials -0.1 2.4 1.3 -1.3 0.8
Information Technology -1.3 -1.9 3.2 16.5 7.8
Materials 1.0 -2.6 -1.2 -1.0 -4.7
Telecommunication Services 4.8 4.7 0.3 -12.9 -19.8
Utilities -0.7 -6.5 -11.5 -19.5 -18.7
Asset Manager performance 2.7 8.1 26.0 53.7 84.0
S&P 500 (absolute performance) 2.7 7.5 6.9 16.1 21.3
Source: Merrill Lynch Sector Strategy
Asset Management
12 November 2007
17
Table 8: Asset Manager index performance following the last four Fed easing cycles
(initiating in 1989 (& 1990), 1995, 1998, 2000, as measured from previous day)
Rate cut dates: 1-month later 3-months later 6-months later 1-year later
Jul-89 -0.2% 15.7% 20.1% 30.4%
Jul-90 -7.6 -27.7 -10.5 35.8
Jul-95 7.4 14.1 15.4 35.2
Sep-98 4.7 19.3 20.4 27.0
Jan-01 11.0 -9.5 7.7 9.3
Average return: 3.1 2.4 10.6 27.5
Source: Federal Reserve Board and Merrill Lynch
Summer decline – asset managers declined much more than S&P 500
Also to be expected, the asset managers under-performed during the decline in
the S&P over the summer (Table 7, left). The group declined nearly 17% in under
a month, close to twice the decline of the S&P 500. Those declining the most
were mostly smaller sized managers whose AUM is weighted toward equity, as
well as the REIT manager, Cohen & Steers. Given confusion over sub-prime,
commercial paper, and widening spreads, money market manager Federated
also declined. Least affected was T. Rowe Price, which has strong performance,
a growing brand, and a sticky 401(k) business.
Table 9: Asset Manager: Q3 peak to trough and
YTD performance
Change from YTD % AUM
Ticker peak to trough* (%) performance equity
WPL -26.7 -64.8 100%
CLMS -25.9 24.7 68%
CNS -23.1 -19.0 90%
WDR -21.5 23.4 87%
FII -20.0 13.8 17%
AMG -18.5 16.4 95%
GBL -17.5 41.8 97%
JNS -17.0 67.7 88%
BLK -16.9 25.7 38%
BEN -16.4 8.0 69%
EV -16.3 38.9 65%
IVZ -15.4 12.7 55%
LM -14.7 -22.3 34%
AB -13.6 -4.7 76%
TROW -11.1 38.5 81%
BPFH -8.2 -4.3 76%
AM ML Index -16.8 14.2
SPX Index -9.4 4.0
*July 19 and Aug 15 was Q3 peak and trough respectively
for the S&P 500
Source: Bloomberg and Merrill Lynch
Asset Management
12 November 2007
18
Valuation remains at premium, but not at an all-time high
Currently, asset managers are trading at 18.1x forward four quarter estimates, a
27% premium vs. the S&P 500. While valuations remain at a premium, they still
remain only 2x above to their long-term average of 16.1x. Assuming a healthy
market, the group could continue to grow faster than the broader market, and
possibly even expand their multiples as they grow globally.
Chart 22: Asset manager forward P/E – current
Asset Manager Composite Forward P/E
18.1x
16.1x
0.0x
5.0x
10.0x
15.0x
20.0x
25.0x
1Q90
1Q91
1Q92
1Q93
1Q94
1Q95
1Q96
1Q97
1Q98
1Q99
1Q00
1Q01
1Q02
1Q03
1Q04
1Q05
1Q06
1Q07
Average:
Source: First Call, FactSet and Merrill Lynch
Chart 23: Asset manager forward P/E vs. S&P 500 – current
Forward Multiple of Asset Managers vs. S&P 500, 1990-Present
127%88%
0%
10%
20%
30%
40%
50%
60%
70%
80%
90%
100%
110%
120%
130%
140%
150%
1Q90
1Q91
1Q92
1Q93
1Q94
1Q95
1Q96
1Q97
1Q98
1Q99
1Q00
1Q01
1Q02
1Q03
1Q04
1Q05
1Q06
1Q07
Average =
Source: First Call, FactSet and Merrill Lynch
Asset Management
12 November 2007
19
What is potential downside, if past repeats?
But what if we enter a long slowdown? We think the asset managers will hold up
relatively well as long as there is no drawn out consumer recession. But a long
slowdown could cause multiple compression.
If we apply past patterns to the current situation, we can imagine a few scenarios,
which together imply a potential 11% - 25% decline:
Scenario 1: Reversion to mean implies 9% downside
A return to their long-term average of 16.1x forward four quarter estimates would
imply about 11% downside, assuming no change to estimates.
Scenario 2: Replay of 1990, managers have beta of 2 = 25% downside
Another hypothetical is that in a recession the S&P 500 declines 15%, similar to
1990, and the asset managers suffer multiple compression in same proportion as
1990 – equivalent to a 30% decline. (Then, they went from 13.8x to 9.5x – which
would translate into a current drop from 18.1x to 12.7x). With some offset for
earnings growth, this might be equivalent to a 25% decline.
Scenario 3: Contraction similar to average of last 4 episodes
If asset managers were to contract at a rate similar to the 4 slowings we
examined, their multiples would fall about 2x, representing 11% downside.
Table 10: Multiple compression for group during equity market weakness coinciding with
economic slowdowns (ML indices measured at nearest quarter-end)
Forward four quarter P/E
Date Starting Ending Change % decline
1Q90 - 3Q90 13.8x 9.5x 4.3x -31%
2Q95 - 2Q96 13.7 13.7 0.0 0%
2Q98 - 3Q98 19.3 14.8 4.5 -23%
4Q00 - 4Q02 17.9 16.4 1.5 -8%
Average 16.2 13.6 2.6 -16%
2Q07 - present 19.7x 18.1x 1.6 -8.1%
Source: Factset and Merrill Lynch
A repeat of past patterns would suggest a 10-
25% decline in the group, mostly due to
multiple compression
Asset Management
12 November 2007
20
We remain selective, with 4 Buys and 1 Sell
Because we are not yet convinced of a long slowdown, we maintain our
cautiously positive outlook, but we are selective: We have Buy ratings on 4 of 14
asset managers in our universe: Growth managers Calamos and Waddell & Reed
(because we think the growth vs. value rotation will continue, and their funds
continue to out-perform); AllianceBernstein, which is trading at a 23% discount,
with a 7% projected yield; and AMG, an acquirer which has in the past survived
downturns well by acquiring.
Although we like T. Rowe Price and Janus, we think they are fairly valued. We
have a Sell rating on Eaton Vance because, although we think highly of
management, some of its product specialties (closed-end funds, bank loan funds,
high yield, and value equity) may not attract strong flows in this environment,
suggesting it should not trade at its current 22% premium.
Table 11: Coverage Universe
Price
Company Ticker Rating 11/9/2007
INVESCO IVZ C-2-7 $27.05
AllianceBernstein AB B-1-7 74.55
BlackRock BLK RSTR** 191.20
Franklin Resources BEN B-2-7 117.23
Legg Mason LM B-2-7 72.49
T. Rowe Price TROW B-2-7 58.60
Affiliated Managers Group AMG B-1-9 120.57
Calamos CLMS C-1-7 32.25
Eaton Vance EV B-3-7 44.78
Federated Investors FII B-2-7 39.97
Janus Capital Group JNS B-2-7 35.00
Nuveen Investments JNC 6 64.8
Boston Private Holdings BPFH C-2-7 27.10
Cohen & Steers CNS C-2-7 32.25
GAMCO GBL C-2-7 54.71
Waddell & Reed WDR B-1-7 32.65
W.P. Stewart WPL C-2-9 5.27
*RESTRICTED. SOLICITATION OF COMMISSION ORDERS IS PROHIBITED.
Source: Company Reports and Merrill Lynch
Asset Management
12 November 2007
21
Price Objective Basis & Risk
AllianceBernstein (AB)
Our $97 price objective is based on a relative P/E and a DCF valuation, and
assumes it should trade in line with the group’s long-term averages. Because
Alliance is a Master Limited Partnership, total potential return includes a 6%
estimated dividend yield based on earnings. The risks to our price objective are
market depreciation, similar to other asset managers, and an unpredictable yield
since it is based on earnings rather than fixed. Although we do not believe
AllianceBernstein is likely to lose its MLP status, recent legislation proposed by
the Senate addressing this issue vis a vis other companies also introduces some
risk. Because MLPs have unique tax characteristics, investors should consult with
their advisors.
Affiliated Mgrs. (AMG)
Our P.O. of $140 is based on a combination of relative P/E and DCF valuations.
We give 70% weight to our relative P/E valuation ($128), which assumes that
AMG should trade at a 10% discount on a relative P/E basis vs. peers to reflect
use of cash EPS, leverage, and lower transparency as a holding company. We
give a 30% weight to our DCF valuation of $164. Risks are market depreciation,
as ~95% of AUM is in equity products, greater leverage and associated costs,
and acquisition risk.
Calamos (CLMS)
Our $35 price objective is based on a combination of relative P/E, our DCF, and
our “core+cash” valuation. We assume Calamos should trade at a 10% discount
to peers given outflows and the large influence of the Calamos Growth fund.
Risks are underperformance of the Growth fund, equity market depreciation, and
margin pressure due to continued investment in infrastructure, staff and products
at a time of outflows.
Waddell & Reed (WDR)
Our $34 price objective is based on a combination of relative P/E and a DCF
valuation, which we use as a proxy for acquisition value. Our relative P/E target
assumes that Waddell shares should trade in line vs. the group’s long-term average
relative P/E, based on above-average organic growth offset by below-average
operating margins. Risks to our price objective are market depreciation and
investment under-performance, as for all asset managers, and an industry shift
away from proprietary sales networks such as Waddell’s Advisors channel. In
addition Waddell has concentration risk, as the Ivy Global Natural Resources fund
comprises about 13% of AUM, and its other funds contain energy positions as well.
Analyst Certification
I, Cynthia Mayer, hereby certify that the views expressed in this research report
accurately reflect my personal views about the subject securities and issuers.
I also certify that no part of my compensation was, is, or will be, directly or
indirectly, related to the specific recommendations or view expressed in this
research report.
Asset Management
12 November 2007
22
Important Disclosures
Investment Rating Distribution: Financial Services Group (as of 01 Oct 2007)
Coverage Universe Count Percent Inv. Banking Relationships* Count Percent
Buy 108 38.85% Buy 45 44.55%
Neutral 156 56.12% Neutral 67 45.27%
Sell 14 5.04% Sell 4 28.57%
Investment Rating Distribution: Global Group (as of 01 Oct 2007)
Coverage Universe Count Percent Inv. Banking Relationships* Count Percent
Buy 1701 47.03% Buy 437 29.15%
Neutral 1611 44.54% Neutral 425 29.11%
Sell 305 8.43% Sell 58 21.09%
* Companies in respect of which MLPF&S or an affiliate has received compensation for investment banking services within the past 12 months.
FUNDAMENTAL EQUITY OPINION KEY: Opinions include a Volatility Risk Rating, an Investment Rating and an Income Rating. VOLATILITY RISK
RATINGS, indicators of potential price fluctuation, are: A - Low, B - Medium, and C - High. INVESTMENT RATINGS, indicators of expected total return
(price appreciation plus yield) within the 12-month period from the date of the initial rating, are: 1 - Buy (10% or more for Low and Medium Volatility Risk
Securities - 20% or more for High Volatility Risk securities); 2 - Neutral (0-10% for Low and Medium Volatility Risk securities - 0-20% for High Volatility
Risk securities); 3 - Sell (negative return); and 6 - No Rating. INCOME RATINGS, indicators of potential cash dividends, are: 7 - same/higher (dividend
considered to be secure); 8 - same/lower (dividend not considered to be secure); and 9 - pays no cash dividend.
Price charts for the equity securities referenced in this research report are available at http://www.ml.com/research/pricecharts.asp, or call 1-888-ML-CHART to
have them mailed.
MLPF&S or one of its affiliates acts as a market maker for the securities recommended in the report: AllianceBernstein, AMG., Calamos, Eaton Vance, Janus
Capital, T. Rowe Price, Waddell & Reed.
MLPF&S or an affiliate was a manager of a public offering of securities of this company within the last 12 months: Eaton Vance, Janus Capital.
The company is or was, within the last 12 months, an investment banking client of MLPF&S and/or one or more of its affiliates: AllianceBernstein, AMG.,
Calamos, Eaton Vance, Janus Capital, Waddell & Reed.
MLPF&S or an affiliate has received compensation from the company for non-investment banking services or products within the past 12 months:
AllianceBernstein, AMG., Calamos, Eaton Vance, Janus Capital, T. Rowe Price, Waddell & Reed.
The company is or was, within the last 12 months, a non-securities business client of MLPF&S and/or one or more of its affiliates: AllianceBernstein, AMG.,
Calamos, Eaton Vance, Janus Capital, T. Rowe Price, Waddell & Reed.
MLPF&S or an affiliate has received compensation for investment banking services from this company within the past 12 months: AllianceBernstein, AMG.,
Calamos, Eaton Vance, Janus Capital, Waddell & Reed.
MLPF&S or an affiliate expects to receive or intends to seek compensation for investment banking services from this company within the next three months:
AllianceBernstein, AMG., Calamos, Eaton Vance, Janus Capital, Waddell & Reed.
MLPF&S together with its affiliates beneficially owns one percent or more of the common stock of this company. If this report was issued on or after the 10th day
of the month, it reflects the ownership position on the last day of the previous month. Reports issued before the 10th day of a month reflect the ownership position at
the end of the second month preceding the date of the report: AllianceBernstein, AMG., Waddell & Reed.
MLPF&S or one of its affiliates is willing to sell to, or buy from, clients the common equity of the company on a principal basis: AllianceBernstein, AMG.,
Calamos, Eaton Vance, Janus Capital, T. Rowe Price, Waddell & Reed.
The company is or was, within the last 12 months, a securities business client (non-investment banking) of MLPF&S and/or one or more of its affiliates:
AllianceBernstein, AMG., Calamos, Eaton Vance, Janus Capital, T. Rowe Price, Waddell & Reed.
The analyst(s) responsible for covering the securities in this report receive compensation based upon, among other factors, the overall profitability of Merrill
Lynch, including profits derived from investment banking revenues.
Asset Management
12 November 2007
23
Other Important Disclosures
UK readers: MLPF&S or an affiliate is a liquidity provider for the securities discussed in this report.
MLPF&S or one of its affiliates has a significant financial interest in the fixed income instruments of the issuer. If this report was issued on or after the 10th day of
a month, it reflects a significant financial interest on the last day of the previous month. Reports issued before the 10th day of a month reflect a significant financial
interest at the end of the second month preceding the date of the report: Eaton Vance, Janus Capital.
Information relating to Non-U.S. affiliates of Merrill Lynch, Pierce, Fenner & Smith Incorporated (MLPF&S):
MLPF&S distributes research reports of the following non-US affiliates in the US (short name: legal name): Merrill Lynch (France): Merrill Lynch Capital Markets
(France) SAS; Merrill Lynch (Frankfurt): Merrill Lynch International Bank Ltd, Frankfurt Branch; Merrill Lynch (South Africa): Merrill Lynch South Africa (Pty) Ltd;
Merrill Lynch (Milan): Merrill Lynch International Bank Limited; MLPF&S (UK): Merrill Lynch, Pierce, Fenner & Smith Limited; Merrill Lynch (Australia): Merrill Lynch
Equities (Australia) Limited; Merrill Lynch (Hong Kong): Merrill Lynch (Asia Pacific) Limited; Merrill Lynch (Singapore): Merrill Lynch (Singapore) Pte Ltd; Merrill
Lynch (Canada): Merrill Lynch Canada Inc; Merrill Lynch (Mexico): Merrill Lynch Mexico, SA de CV, Casa de Bolsa; Merrill Lynch (Argentina): Merrill Lynch
Argentina SA; Merrill Lynch (Japan): Merrill Lynch Japan Securities Co, Ltd; Merrill Lynch (Seoul): Merrill Lynch International Incorporated (Seoul Branch); Merrill
Lynch (Taiwan): Merrill Lynch Global (Taiwan) Limited; DSP Merrill Lynch (India): DSP Merrill Lynch Limited; PT Merrill Lynch (Indonesia): PT Merrill Lynch
Indonesia; Merrill Lynch (KL) Sdn. Bhd.: Merrill Lynch (Malaysia); Merrill Lynch (Israel): Merrill Lynch Israel Limited; Merrill Lynch (Russia): Merrill Lynch CIS Limited,
Moscow; Merrill Lynch (Turkey): Merrill Lynch Yatirim Bankasi A.S.; Merrill Lynch (Dubai): Merrill Lynch International Bank Ltd, Dubai Branch.
This research report has been prepared and issued by MLPF&S and/or one or more of its non-U.S. affiliates. MLPF&S is the distributor of this research report in
the U.S. and accepts full responsibility for research reports of its non-U.S. affiliates distributed in the U.S. Any U.S. person receiving this research report and wishing
to effect any transaction in any security discussed in the report should do so through MLPF&S and not such foreign affiliates.
This research report has been approved for publication in the United Kingdom by Merrill Lynch, Pierce, Fenner & Smith Limited, which is authorized and
regulated by the Financial Services Authority; has been considered and distributed in Japan by Merrill Lynch Japan Securities Co, Ltd, a registered securities dealer
under the Securities and Exchange Law in Japan; is distributed in Hong Kong by Merrill Lynch (Asia Pacific) Limited, which is regulated by the Hong Kong SFC; is
issued and distributed in Taiwan by Merrill Lynch Global (Taiwan) Ltd or Merrill Lynch, Pierce, Fenner & Smith Limited (Taiwan Branch); is issued and distributed in
Malaysia by Merrill Lynch (KL) Sdn. Bhd., a licensed investment adviser regulated by the Malaysian Securities Commission; is issued and distributed in India by DSP
Merrill Lynch Limited; and is issued and distributed in Singapore by Merrill Lynch International Bank Limited (Merchant Bank) and Merrill Lynch (Singapore) Pte Ltd
(Company Registration No.’s F 06872E and 198602883D respectively). Merrill Lynch International Bank Limited (Merchant Bank) and Merrill Lynch (Singapore) Pte
Ltd. are regulated by the Monetary Authority of Singapore. Merrill Lynch Equities (Australia) Limited, (ABN 65 006 276 795), AFS License 235132, provides this
report in Australia. No approval is required for publication or distribution of this report in Brazil.
Merrill Lynch (Frankfurt) distributes this report in Germany. Merrill Lynch (Frankfurt) is regulated by BaFin.
Copyright, User Agreement and other general information related to this report:
Copyright 2007 Merrill Lynch, Pierce, Fenner & Smith Incorporated. All rights reserved. This research report is prepared for the use of Merrill Lynch clients and
may not be redistributed, retransmitted or disclosed, in whole or in part, or in any form or manner, without the express written consent of Merrill Lynch. Merrill Lynch
research reports are distributed simultaneously to internal and client websites eligible to receive such research prior to any public dissemination by Merrill Lynch of
the research report or information or opinion contained therein. Any unauthorized use or disclosure is prohibited. Receipt and review of this research report
constitutes your agreement not to redistribute, retransmit, or disclose to others the contents, opinions, conclusion, or information contained in this report (including
any investment recommendations, estimates or price targets) prior to Merrill Lynch's public disclosure of such information. The information herein (other than
disclosure information relating to Merrill Lynch and its affiliates) was obtained from various sources and we do not guarantee its accuracy. Merrill Lynch makes no
representations or warranties whatsoever as to the data and information provided in any third party referenced website and shall have no liability or responsibility
arising out of or in connection with any such referenced website.
This research report provides general information only. Neither the information nor any opinion expressed constitutes an offer or an invitation to make an offer,
to buy or sell any securities or other investment or any options, futures or derivatives related to such securities or investments. It is not intended to provide personal
investment advice and it does not take into account the specific investment objectives, financial situation and the particular needs of any specific person who may
receive this report. Investors should seek financial advice regarding the appropriateness of investing in any securities, other investment or investment strategies
discussed or recommended in this report and should understand that statements regarding future prospects may not be realized. Investors should note that income
from such securities or other investments, if any, may fluctuate and that price or value of such securities and investments may rise or fall. Accordingly, investors may
receive back less than originally invested. Past performance is not necessarily a guide to future performance. Any information relating to the tax status of financial
instruments discussed herein is not intended to provide tax advice or to be used by anyone to provide tax advice. Investors are urged to seek tax advice based on
their particular circumstances from an independent tax professional.
Foreign currency rates of exchange may adversely affect the value, price or income of any security or related investment mentioned in this report. In addition,
investors in securities such as ADRs, whose values are influenced by the currency of the underlying security, effectively assume currency risk.
Officers of MLPF&S or one or more of its affiliates (other than research analysts) may have a financial interest in securities of the issuer(s) or in related
investments.
Merrill Lynch Research policies relating to conflicts of interest are described at http://www.ml.com/media/43347.pdf.
Fundamental equity reports are produced on a regular basis as necessary to keep the investment recommendation current.

More Related Content

What's hot

2Q09 Asset Allocation
2Q09 Asset Allocation2Q09 Asset Allocation
2Q09 Asset Allocationcoterieternal
 
2007 01 white presentation at barclays capital in florida 28 30 january 2007 ...
2007 01 white presentation at barclays capital in florida 28 30 january 2007 ...2007 01 white presentation at barclays capital in florida 28 30 january 2007 ...
2007 01 white presentation at barclays capital in florida 28 30 january 2007 ...William White
 
15-12-29 MMM Oct Issue Extract
15-12-29 MMM Oct Issue Extract15-12-29 MMM Oct Issue Extract
15-12-29 MMM Oct Issue ExtractSean Corrigan
 
Thomas Mayer - The Challenges of Economic Thinking in Practice
Thomas Mayer - The Challenges of Economic  Thinking in PracticeThomas Mayer - The Challenges of Economic  Thinking in Practice
Thomas Mayer - The Challenges of Economic Thinking in PracticeDieter Meyeer
 
Chapter 14 - Great Recession
Chapter 14 - Great RecessionChapter 14 - Great Recession
Chapter 14 - Great RecessionRyan Herzog
 
Asset Managers - Recession risks, Trust Banks & Asset Mgrs
Asset Managers - Recession risks, Trust Banks & Asset MgrsAsset Managers - Recession risks, Trust Banks & Asset Mgrs
Asset Managers - Recession risks, Trust Banks & Asset MgrsKevin Cheng, CFA
 
InvestmentCommitteeResearch_AlchemyCapital_March2008
InvestmentCommitteeResearch_AlchemyCapital_March2008InvestmentCommitteeResearch_AlchemyCapital_March2008
InvestmentCommitteeResearch_AlchemyCapital_March2008Jean-Marc Bloch-Lambert
 
Eurorient ron nechemia at the epicenter where the financial system meets the ...
Eurorient ron nechemia at the epicenter where the financial system meets the ...Eurorient ron nechemia at the epicenter where the financial system meets the ...
Eurorient ron nechemia at the epicenter where the financial system meets the ...EurOrientF
 
Thomas Pally - 'financialization: what it is and why it matters"
Thomas Pally - 'financialization: what it is and why it matters"Thomas Pally - 'financialization: what it is and why it matters"
Thomas Pally - 'financialization: what it is and why it matters"Conor McCabe
 
Does Risk Management Create Value - Dec 2007
Does Risk Management Create Value - Dec 2007Does Risk Management Create Value - Dec 2007
Does Risk Management Create Value - Dec 2007Adrian Crockett, CFA
 
US Business Cycle Timing
US Business Cycle TimingUS Business Cycle Timing
US Business Cycle TimingPhilipSuttle
 
Business, People, and COVID: A Roadmap
Business, People, and COVID: A RoadmapBusiness, People, and COVID: A Roadmap
Business, People, and COVID: A RoadmapBaburaj Nair
 
The Oliver Wyman Risk Journal Volume 5
The Oliver Wyman Risk Journal Volume 5The Oliver Wyman Risk Journal Volume 5
The Oliver Wyman Risk Journal Volume 5Dr. Joachim Krotz
 
Glc Market Matters
Glc Market MattersGlc Market Matters
Glc Market MattersMartin Leduc
 
Actions You Can Take After Great Recession
Actions You Can Take After Great RecessionActions You Can Take After Great Recession
Actions You Can Take After Great Recessionbruce_gillen
 

What's hot (20)

2Q09 Asset Allocation
2Q09 Asset Allocation2Q09 Asset Allocation
2Q09 Asset Allocation
 
2007 01 white presentation at barclays capital in florida 28 30 january 2007 ...
2007 01 white presentation at barclays capital in florida 28 30 january 2007 ...2007 01 white presentation at barclays capital in florida 28 30 january 2007 ...
2007 01 white presentation at barclays capital in florida 28 30 january 2007 ...
 
15-12-29 MMM Oct Issue Extract
15-12-29 MMM Oct Issue Extract15-12-29 MMM Oct Issue Extract
15-12-29 MMM Oct Issue Extract
 
Thomas Mayer - The Challenges of Economic Thinking in Practice
Thomas Mayer - The Challenges of Economic  Thinking in PracticeThomas Mayer - The Challenges of Economic  Thinking in Practice
Thomas Mayer - The Challenges of Economic Thinking in Practice
 
Chapter 14 - Great Recession
Chapter 14 - Great RecessionChapter 14 - Great Recession
Chapter 14 - Great Recession
 
Asset Managers - Recession risks, Trust Banks & Asset Mgrs
Asset Managers - Recession risks, Trust Banks & Asset MgrsAsset Managers - Recession risks, Trust Banks & Asset Mgrs
Asset Managers - Recession risks, Trust Banks & Asset Mgrs
 
InvestmentCommitteeResearch_AlchemyCapital_March2008
InvestmentCommitteeResearch_AlchemyCapital_March2008InvestmentCommitteeResearch_AlchemyCapital_March2008
InvestmentCommitteeResearch_AlchemyCapital_March2008
 
Contagion effect
Contagion effectContagion effect
Contagion effect
 
Global Markets
Global MarketsGlobal Markets
Global Markets
 
Olympian Sep2012
Olympian Sep2012Olympian Sep2012
Olympian Sep2012
 
Eurorient ron nechemia at the epicenter where the financial system meets the ...
Eurorient ron nechemia at the epicenter where the financial system meets the ...Eurorient ron nechemia at the epicenter where the financial system meets the ...
Eurorient ron nechemia at the epicenter where the financial system meets the ...
 
Thomas Pally - 'financialization: what it is and why it matters"
Thomas Pally - 'financialization: what it is and why it matters"Thomas Pally - 'financialization: what it is and why it matters"
Thomas Pally - 'financialization: what it is and why it matters"
 
Does Risk Management Create Value - Dec 2007
Does Risk Management Create Value - Dec 2007Does Risk Management Create Value - Dec 2007
Does Risk Management Create Value - Dec 2007
 
US Business Cycle Timing
US Business Cycle TimingUS Business Cycle Timing
US Business Cycle Timing
 
Business, People, and COVID: A Roadmap
Business, People, and COVID: A RoadmapBusiness, People, and COVID: A Roadmap
Business, People, and COVID: A Roadmap
 
The Oliver Wyman Risk Journal Volume 5
The Oliver Wyman Risk Journal Volume 5The Oliver Wyman Risk Journal Volume 5
The Oliver Wyman Risk Journal Volume 5
 
Glc Market Matters
Glc Market MattersGlc Market Matters
Glc Market Matters
 
credit-suisse Quarterly Review Q3/2001
credit-suisse Quarterly Review Q3/2001credit-suisse Quarterly Review Q3/2001
credit-suisse Quarterly Review Q3/2001
 
Actions You Can Take After Great Recession
Actions You Can Take After Great RecessionActions You Can Take After Great Recession
Actions You Can Take After Great Recession
 
Thought for the week 276
Thought for the week   276Thought for the week   276
Thought for the week 276
 

Similar to Merrill Lynch Report Addresses Potential Conflicts of Interest

Mercer Capital's Investment Management Industry Newsletter | Q1 2019 | Focus:...
Mercer Capital's Investment Management Industry Newsletter | Q1 2019 | Focus:...Mercer Capital's Investment Management Industry Newsletter | Q1 2019 | Focus:...
Mercer Capital's Investment Management Industry Newsletter | Q1 2019 | Focus:...Mercer Capital
 
Mercer Capital's Investment Management Industry Newsletter | Q3 2022 | Focus:...
Mercer Capital's Investment Management Industry Newsletter | Q3 2022 | Focus:...Mercer Capital's Investment Management Industry Newsletter | Q3 2022 | Focus:...
Mercer Capital's Investment Management Industry Newsletter | Q3 2022 | Focus:...Mercer Capital
 
Mercer Capital's Asset Management Industry Newsletter | Q1 2018 | Focus: Asse...
Mercer Capital's Asset Management Industry Newsletter | Q1 2018 | Focus: Asse...Mercer Capital's Asset Management Industry Newsletter | Q1 2018 | Focus: Asse...
Mercer Capital's Asset Management Industry Newsletter | Q1 2018 | Focus: Asse...Mercer Capital
 
When The Market Speaks, Listen
When The Market Speaks, ListenWhen The Market Speaks, Listen
When The Market Speaks, ListenAnindya Banerjee
 
Mercer Capital's Investment Management Industry Newsletter | Q4 2021 | Focus:...
Mercer Capital's Investment Management Industry Newsletter | Q4 2021 | Focus:...Mercer Capital's Investment Management Industry Newsletter | Q4 2021 | Focus:...
Mercer Capital's Investment Management Industry Newsletter | Q4 2021 | Focus:...Mercer Capital
 
Mercer Capital's Investment Management Industry Newsletter | Q1 2020 | Focus:...
Mercer Capital's Investment Management Industry Newsletter | Q1 2020 | Focus:...Mercer Capital's Investment Management Industry Newsletter | Q1 2020 | Focus:...
Mercer Capital's Investment Management Industry Newsletter | Q1 2020 | Focus:...Mercer Capital
 
BMO-TCH-Mid-Q3-Update_FINAL
BMO-TCH-Mid-Q3-Update_FINALBMO-TCH-Mid-Q3-Update_FINAL
BMO-TCH-Mid-Q3-Update_FINALAdam Phillips
 
10 key trends changing investment management
10 key trends changing investment management10 key trends changing investment management
10 key trends changing investment managementtessat97
 
Michael Durante Western Reserve Blackwall Partners 2011 outlook primer- final
Michael Durante Western Reserve Blackwall Partners   2011 outlook primer- finalMichael Durante Western Reserve Blackwall Partners   2011 outlook primer- final
Michael Durante Western Reserve Blackwall Partners 2011 outlook primer- finalMichael Durante
 
Mercer Capital's Investment Management Industry Newsletter | Q3 2020 | Focus:...
Mercer Capital's Investment Management Industry Newsletter | Q3 2020 | Focus:...Mercer Capital's Investment Management Industry Newsletter | Q3 2020 | Focus:...
Mercer Capital's Investment Management Industry Newsletter | Q3 2020 | Focus:...Mercer Capital
 
Can Small Cap Stocks Weather the Storm?
Can Small Cap Stocks Weather the Storm?Can Small Cap Stocks Weather the Storm?
Can Small Cap Stocks Weather the Storm?Susan Langdon
 
Merrill Lynch\'s Valuation
Merrill Lynch\'s ValuationMerrill Lynch\'s Valuation
Merrill Lynch\'s Valuationszrehman
 
Lehman Brothers - Analysis of Failure.pdf
Lehman Brothers - Analysis of Failure.pdfLehman Brothers - Analysis of Failure.pdf
Lehman Brothers - Analysis of Failure.pdfahmed_cal
 
Mercer Capital's Asset Management Industry Newsletter | Q2 2018 | Focus: Weal...
Mercer Capital's Asset Management Industry Newsletter | Q2 2018 | Focus: Weal...Mercer Capital's Asset Management Industry Newsletter | Q2 2018 | Focus: Weal...
Mercer Capital's Asset Management Industry Newsletter | Q2 2018 | Focus: Weal...Mercer Capital
 
Mercer Capital's Investment Management Industry Newsletter | Q2 2021 | Focus:...
Mercer Capital's Investment Management Industry Newsletter | Q2 2021 | Focus:...Mercer Capital's Investment Management Industry Newsletter | Q2 2021 | Focus:...
Mercer Capital's Investment Management Industry Newsletter | Q2 2021 | Focus:...Mercer Capital
 
Capital Markets Industry Insights - Q1 2016
Capital Markets Industry Insights - Q1 2016Capital Markets Industry Insights - Q1 2016
Capital Markets Industry Insights - Q1 2016Duff & Phelps
 
2009 - February (Spring)
2009 - February (Spring)2009 - February (Spring)
2009 - February (Spring)Greg Meier
 

Similar to Merrill Lynch Report Addresses Potential Conflicts of Interest (20)

Mercer Capital's Investment Management Industry Newsletter | Q1 2019 | Focus:...
Mercer Capital's Investment Management Industry Newsletter | Q1 2019 | Focus:...Mercer Capital's Investment Management Industry Newsletter | Q1 2019 | Focus:...
Mercer Capital's Investment Management Industry Newsletter | Q1 2019 | Focus:...
 
AlpineII
AlpineIIAlpineII
AlpineII
 
Mercer Capital's Investment Management Industry Newsletter | Q3 2022 | Focus:...
Mercer Capital's Investment Management Industry Newsletter | Q3 2022 | Focus:...Mercer Capital's Investment Management Industry Newsletter | Q3 2022 | Focus:...
Mercer Capital's Investment Management Industry Newsletter | Q3 2022 | Focus:...
 
Mercer Capital's Asset Management Industry Newsletter | Q1 2018 | Focus: Asse...
Mercer Capital's Asset Management Industry Newsletter | Q1 2018 | Focus: Asse...Mercer Capital's Asset Management Industry Newsletter | Q1 2018 | Focus: Asse...
Mercer Capital's Asset Management Industry Newsletter | Q1 2018 | Focus: Asse...
 
When The Market Speaks, Listen
When The Market Speaks, ListenWhen The Market Speaks, Listen
When The Market Speaks, Listen
 
Mercer Capital's Investment Management Industry Newsletter | Q4 2021 | Focus:...
Mercer Capital's Investment Management Industry Newsletter | Q4 2021 | Focus:...Mercer Capital's Investment Management Industry Newsletter | Q4 2021 | Focus:...
Mercer Capital's Investment Management Industry Newsletter | Q4 2021 | Focus:...
 
Mercer Capital's Investment Management Industry Newsletter | Q1 2020 | Focus:...
Mercer Capital's Investment Management Industry Newsletter | Q1 2020 | Focus:...Mercer Capital's Investment Management Industry Newsletter | Q1 2020 | Focus:...
Mercer Capital's Investment Management Industry Newsletter | Q1 2020 | Focus:...
 
BMO-TCH-Mid-Q3-Update_FINAL
BMO-TCH-Mid-Q3-Update_FINALBMO-TCH-Mid-Q3-Update_FINAL
BMO-TCH-Mid-Q3-Update_FINAL
 
Ow db-wealth-management-running-faster-to-stand-still
Ow db-wealth-management-running-faster-to-stand-stillOw db-wealth-management-running-faster-to-stand-still
Ow db-wealth-management-running-faster-to-stand-still
 
10 key trends changing investment management
10 key trends changing investment management10 key trends changing investment management
10 key trends changing investment management
 
Michael Durante Western Reserve Blackwall Partners 2011 outlook primer- final
Michael Durante Western Reserve Blackwall Partners   2011 outlook primer- finalMichael Durante Western Reserve Blackwall Partners   2011 outlook primer- final
Michael Durante Western Reserve Blackwall Partners 2011 outlook primer- final
 
Dec2005
Dec2005Dec2005
Dec2005
 
Mercer Capital's Investment Management Industry Newsletter | Q3 2020 | Focus:...
Mercer Capital's Investment Management Industry Newsletter | Q3 2020 | Focus:...Mercer Capital's Investment Management Industry Newsletter | Q3 2020 | Focus:...
Mercer Capital's Investment Management Industry Newsletter | Q3 2020 | Focus:...
 
Can Small Cap Stocks Weather the Storm?
Can Small Cap Stocks Weather the Storm?Can Small Cap Stocks Weather the Storm?
Can Small Cap Stocks Weather the Storm?
 
Merrill Lynch\'s Valuation
Merrill Lynch\'s ValuationMerrill Lynch\'s Valuation
Merrill Lynch\'s Valuation
 
Lehman Brothers - Analysis of Failure.pdf
Lehman Brothers - Analysis of Failure.pdfLehman Brothers - Analysis of Failure.pdf
Lehman Brothers - Analysis of Failure.pdf
 
Mercer Capital's Asset Management Industry Newsletter | Q2 2018 | Focus: Weal...
Mercer Capital's Asset Management Industry Newsletter | Q2 2018 | Focus: Weal...Mercer Capital's Asset Management Industry Newsletter | Q2 2018 | Focus: Weal...
Mercer Capital's Asset Management Industry Newsletter | Q2 2018 | Focus: Weal...
 
Mercer Capital's Investment Management Industry Newsletter | Q2 2021 | Focus:...
Mercer Capital's Investment Management Industry Newsletter | Q2 2021 | Focus:...Mercer Capital's Investment Management Industry Newsletter | Q2 2021 | Focus:...
Mercer Capital's Investment Management Industry Newsletter | Q2 2021 | Focus:...
 
Capital Markets Industry Insights - Q1 2016
Capital Markets Industry Insights - Q1 2016Capital Markets Industry Insights - Q1 2016
Capital Markets Industry Insights - Q1 2016
 
2009 - February (Spring)
2009 - February (Spring)2009 - February (Spring)
2009 - February (Spring)
 

More from Kevin Cheng, CFA

Equity Strategy - Consumer Staples
Equity Strategy - Consumer StaplesEquity Strategy - Consumer Staples
Equity Strategy - Consumer StaplesKevin Cheng, CFA
 
Brookfield Office Properties - BPO - Quarterly Earnings
Brookfield Office Properties - BPO - Quarterly EarningsBrookfield Office Properties - BPO - Quarterly Earnings
Brookfield Office Properties - BPO - Quarterly EarningsKevin Cheng, CFA
 
First Capital Realty - FCR
First Capital Realty - FCRFirst Capital Realty - FCR
First Capital Realty - FCRKevin Cheng, CFA
 
CXP initiation - Office REIT
CXP initiation - Office REITCXP initiation - Office REIT
CXP initiation - Office REITKevin Cheng, CFA
 
Canadian Asset Managers - Initiation Report
Canadian Asset Managers - Initiation ReportCanadian Asset Managers - Initiation Report
Canadian Asset Managers - Initiation ReportKevin Cheng, CFA
 
Equity Strategy - Staying Defensive
Equity Strategy - Staying DefensiveEquity Strategy - Staying Defensive
Equity Strategy - Staying DefensiveKevin Cheng, CFA
 

More from Kevin Cheng, CFA (12)

Equity Strategy - Consumer Staples
Equity Strategy - Consumer StaplesEquity Strategy - Consumer Staples
Equity Strategy - Consumer Staples
 
Brookfield Office Properties - BPO - Quarterly Earnings
Brookfield Office Properties - BPO - Quarterly EarningsBrookfield Office Properties - BPO - Quarterly Earnings
Brookfield Office Properties - BPO - Quarterly Earnings
 
First Capital Realty - FCR
First Capital Realty - FCRFirst Capital Realty - FCR
First Capital Realty - FCR
 
Equity Strategy - TSX
Equity Strategy - TSXEquity Strategy - TSX
Equity Strategy - TSX
 
Focus - Economic Research
Focus - Economic ResearchFocus - Economic Research
Focus - Economic Research
 
DEA Initiation Report
DEA Initiation ReportDEA Initiation Report
DEA Initiation Report
 
CXP initiation - Office REIT
CXP initiation - Office REITCXP initiation - Office REIT
CXP initiation - Office REIT
 
Canadian Asset Managers - Initiation Report
Canadian Asset Managers - Initiation ReportCanadian Asset Managers - Initiation Report
Canadian Asset Managers - Initiation Report
 
Agf market outlook
Agf market outlookAgf market outlook
Agf market outlook
 
Equity Strategy - Staying Defensive
Equity Strategy - Staying DefensiveEquity Strategy - Staying Defensive
Equity Strategy - Staying Defensive
 
Market Strategy
Market StrategyMarket Strategy
Market Strategy
 
U.S. Real Rates
U.S. Real RatesU.S. Real Rates
U.S. Real Rates
 

Recently uploaded

Stock Market Brief Deck for 4/24/24 .pdf
Stock Market Brief Deck for 4/24/24 .pdfStock Market Brief Deck for 4/24/24 .pdf
Stock Market Brief Deck for 4/24/24 .pdfMichael Silva
 
Andheri Call Girls In 9825968104 Mumbai Hot Models
Andheri Call Girls In 9825968104 Mumbai Hot ModelsAndheri Call Girls In 9825968104 Mumbai Hot Models
Andheri Call Girls In 9825968104 Mumbai Hot Modelshematsharma006
 
High Class Call Girls Nashik Maya 7001305949 Independent Escort Service Nashik
High Class Call Girls Nashik Maya 7001305949 Independent Escort Service NashikHigh Class Call Girls Nashik Maya 7001305949 Independent Escort Service Nashik
High Class Call Girls Nashik Maya 7001305949 Independent Escort Service NashikCall Girls in Nagpur High Profile
 
VIP Call Girls Thane Sia 8617697112 Independent Escort Service Thane
VIP Call Girls Thane Sia 8617697112 Independent Escort Service ThaneVIP Call Girls Thane Sia 8617697112 Independent Escort Service Thane
VIP Call Girls Thane Sia 8617697112 Independent Escort Service ThaneCall girls in Ahmedabad High profile
 
Call Girls In Yusuf Sarai Women Seeking Men 9654467111
Call Girls In Yusuf Sarai Women Seeking Men 9654467111Call Girls In Yusuf Sarai Women Seeking Men 9654467111
Call Girls In Yusuf Sarai Women Seeking Men 9654467111Sapana Sha
 
Q3 2024 Earnings Conference Call and Webcast Slides
Q3 2024 Earnings Conference Call and Webcast SlidesQ3 2024 Earnings Conference Call and Webcast Slides
Q3 2024 Earnings Conference Call and Webcast SlidesMarketing847413
 
Independent Call Girl Number in Kurla Mumbai📲 Pooja Nehwal 9892124323 💞 Full ...
Independent Call Girl Number in Kurla Mumbai📲 Pooja Nehwal 9892124323 💞 Full ...Independent Call Girl Number in Kurla Mumbai📲 Pooja Nehwal 9892124323 💞 Full ...
Independent Call Girl Number in Kurla Mumbai📲 Pooja Nehwal 9892124323 💞 Full ...Pooja Nehwal
 
20240429 Calibre April 2024 Investor Presentation.pdf
20240429 Calibre April 2024 Investor Presentation.pdf20240429 Calibre April 2024 Investor Presentation.pdf
20240429 Calibre April 2024 Investor Presentation.pdfAdnet Communications
 
call girls in Nand Nagri (DELHI) 🔝 >༒9953330565🔝 genuine Escort Service 🔝✔️✔️
call girls in  Nand Nagri (DELHI) 🔝 >༒9953330565🔝 genuine Escort Service 🔝✔️✔️call girls in  Nand Nagri (DELHI) 🔝 >༒9953330565🔝 genuine Escort Service 🔝✔️✔️
call girls in Nand Nagri (DELHI) 🔝 >༒9953330565🔝 genuine Escort Service 🔝✔️✔️9953056974 Low Rate Call Girls In Saket, Delhi NCR
 
Best VIP Call Girls Noida Sector 18 Call Me: 8448380779
Best VIP Call Girls Noida Sector 18 Call Me: 8448380779Best VIP Call Girls Noida Sector 18 Call Me: 8448380779
Best VIP Call Girls Noida Sector 18 Call Me: 8448380779Delhi Call girls
 
(DIYA) Bhumkar Chowk Call Girls Just Call 7001035870 [ Cash on Delivery ] Pun...
(DIYA) Bhumkar Chowk Call Girls Just Call 7001035870 [ Cash on Delivery ] Pun...(DIYA) Bhumkar Chowk Call Girls Just Call 7001035870 [ Cash on Delivery ] Pun...
(DIYA) Bhumkar Chowk Call Girls Just Call 7001035870 [ Cash on Delivery ] Pun...ranjana rawat
 
VIP Call Girls LB Nagar ( Hyderabad ) Phone 8250192130 | ₹5k To 25k With Room...
VIP Call Girls LB Nagar ( Hyderabad ) Phone 8250192130 | ₹5k To 25k With Room...VIP Call Girls LB Nagar ( Hyderabad ) Phone 8250192130 | ₹5k To 25k With Room...
VIP Call Girls LB Nagar ( Hyderabad ) Phone 8250192130 | ₹5k To 25k With Room...Suhani Kapoor
 
06_Joeri Van Speybroek_Dell_MeetupDora&Cybersecurity.pdf
06_Joeri Van Speybroek_Dell_MeetupDora&Cybersecurity.pdf06_Joeri Van Speybroek_Dell_MeetupDora&Cybersecurity.pdf
06_Joeri Van Speybroek_Dell_MeetupDora&Cybersecurity.pdfFinTech Belgium
 
Malad Call Girl in Services 9892124323 | ₹,4500 With Room Free Delivery
Malad Call Girl in Services  9892124323 | ₹,4500 With Room Free DeliveryMalad Call Girl in Services  9892124323 | ₹,4500 With Room Free Delivery
Malad Call Girl in Services 9892124323 | ₹,4500 With Room Free DeliveryPooja Nehwal
 
How Automation is Driving Efficiency Through the Last Mile of Reporting
How Automation is Driving Efficiency Through the Last Mile of ReportingHow Automation is Driving Efficiency Through the Last Mile of Reporting
How Automation is Driving Efficiency Through the Last Mile of ReportingAggregage
 
02_Fabio Colombo_Accenture_MeetupDora&Cybersecurity.pptx
02_Fabio Colombo_Accenture_MeetupDora&Cybersecurity.pptx02_Fabio Colombo_Accenture_MeetupDora&Cybersecurity.pptx
02_Fabio Colombo_Accenture_MeetupDora&Cybersecurity.pptxFinTech Belgium
 
Vip B Aizawl Call Girls #9907093804 Contact Number Escorts Service Aizawl
Vip B Aizawl Call Girls #9907093804 Contact Number Escorts Service AizawlVip B Aizawl Call Girls #9907093804 Contact Number Escorts Service Aizawl
Vip B Aizawl Call Girls #9907093804 Contact Number Escorts Service Aizawlmakika9823
 
Bladex Earnings Call Presentation 1Q2024
Bladex Earnings Call Presentation 1Q2024Bladex Earnings Call Presentation 1Q2024
Bladex Earnings Call Presentation 1Q2024Bladex
 
(ANIKA) Budhwar Peth Call Girls Just Call 7001035870 [ Cash on Delivery ] Pun...
(ANIKA) Budhwar Peth Call Girls Just Call 7001035870 [ Cash on Delivery ] Pun...(ANIKA) Budhwar Peth Call Girls Just Call 7001035870 [ Cash on Delivery ] Pun...
(ANIKA) Budhwar Peth Call Girls Just Call 7001035870 [ Cash on Delivery ] Pun...ranjana rawat
 
High Class Call Girls Nagpur Grishma Call 7001035870 Meet With Nagpur Escorts
High Class Call Girls Nagpur Grishma Call 7001035870 Meet With Nagpur EscortsHigh Class Call Girls Nagpur Grishma Call 7001035870 Meet With Nagpur Escorts
High Class Call Girls Nagpur Grishma Call 7001035870 Meet With Nagpur Escortsranjana rawat
 

Recently uploaded (20)

Stock Market Brief Deck for 4/24/24 .pdf
Stock Market Brief Deck for 4/24/24 .pdfStock Market Brief Deck for 4/24/24 .pdf
Stock Market Brief Deck for 4/24/24 .pdf
 
Andheri Call Girls In 9825968104 Mumbai Hot Models
Andheri Call Girls In 9825968104 Mumbai Hot ModelsAndheri Call Girls In 9825968104 Mumbai Hot Models
Andheri Call Girls In 9825968104 Mumbai Hot Models
 
High Class Call Girls Nashik Maya 7001305949 Independent Escort Service Nashik
High Class Call Girls Nashik Maya 7001305949 Independent Escort Service NashikHigh Class Call Girls Nashik Maya 7001305949 Independent Escort Service Nashik
High Class Call Girls Nashik Maya 7001305949 Independent Escort Service Nashik
 
VIP Call Girls Thane Sia 8617697112 Independent Escort Service Thane
VIP Call Girls Thane Sia 8617697112 Independent Escort Service ThaneVIP Call Girls Thane Sia 8617697112 Independent Escort Service Thane
VIP Call Girls Thane Sia 8617697112 Independent Escort Service Thane
 
Call Girls In Yusuf Sarai Women Seeking Men 9654467111
Call Girls In Yusuf Sarai Women Seeking Men 9654467111Call Girls In Yusuf Sarai Women Seeking Men 9654467111
Call Girls In Yusuf Sarai Women Seeking Men 9654467111
 
Q3 2024 Earnings Conference Call and Webcast Slides
Q3 2024 Earnings Conference Call and Webcast SlidesQ3 2024 Earnings Conference Call and Webcast Slides
Q3 2024 Earnings Conference Call and Webcast Slides
 
Independent Call Girl Number in Kurla Mumbai📲 Pooja Nehwal 9892124323 💞 Full ...
Independent Call Girl Number in Kurla Mumbai📲 Pooja Nehwal 9892124323 💞 Full ...Independent Call Girl Number in Kurla Mumbai📲 Pooja Nehwal 9892124323 💞 Full ...
Independent Call Girl Number in Kurla Mumbai📲 Pooja Nehwal 9892124323 💞 Full ...
 
20240429 Calibre April 2024 Investor Presentation.pdf
20240429 Calibre April 2024 Investor Presentation.pdf20240429 Calibre April 2024 Investor Presentation.pdf
20240429 Calibre April 2024 Investor Presentation.pdf
 
call girls in Nand Nagri (DELHI) 🔝 >༒9953330565🔝 genuine Escort Service 🔝✔️✔️
call girls in  Nand Nagri (DELHI) 🔝 >༒9953330565🔝 genuine Escort Service 🔝✔️✔️call girls in  Nand Nagri (DELHI) 🔝 >༒9953330565🔝 genuine Escort Service 🔝✔️✔️
call girls in Nand Nagri (DELHI) 🔝 >༒9953330565🔝 genuine Escort Service 🔝✔️✔️
 
Best VIP Call Girls Noida Sector 18 Call Me: 8448380779
Best VIP Call Girls Noida Sector 18 Call Me: 8448380779Best VIP Call Girls Noida Sector 18 Call Me: 8448380779
Best VIP Call Girls Noida Sector 18 Call Me: 8448380779
 
(DIYA) Bhumkar Chowk Call Girls Just Call 7001035870 [ Cash on Delivery ] Pun...
(DIYA) Bhumkar Chowk Call Girls Just Call 7001035870 [ Cash on Delivery ] Pun...(DIYA) Bhumkar Chowk Call Girls Just Call 7001035870 [ Cash on Delivery ] Pun...
(DIYA) Bhumkar Chowk Call Girls Just Call 7001035870 [ Cash on Delivery ] Pun...
 
VIP Call Girls LB Nagar ( Hyderabad ) Phone 8250192130 | ₹5k To 25k With Room...
VIP Call Girls LB Nagar ( Hyderabad ) Phone 8250192130 | ₹5k To 25k With Room...VIP Call Girls LB Nagar ( Hyderabad ) Phone 8250192130 | ₹5k To 25k With Room...
VIP Call Girls LB Nagar ( Hyderabad ) Phone 8250192130 | ₹5k To 25k With Room...
 
06_Joeri Van Speybroek_Dell_MeetupDora&Cybersecurity.pdf
06_Joeri Van Speybroek_Dell_MeetupDora&Cybersecurity.pdf06_Joeri Van Speybroek_Dell_MeetupDora&Cybersecurity.pdf
06_Joeri Van Speybroek_Dell_MeetupDora&Cybersecurity.pdf
 
Malad Call Girl in Services 9892124323 | ₹,4500 With Room Free Delivery
Malad Call Girl in Services  9892124323 | ₹,4500 With Room Free DeliveryMalad Call Girl in Services  9892124323 | ₹,4500 With Room Free Delivery
Malad Call Girl in Services 9892124323 | ₹,4500 With Room Free Delivery
 
How Automation is Driving Efficiency Through the Last Mile of Reporting
How Automation is Driving Efficiency Through the Last Mile of ReportingHow Automation is Driving Efficiency Through the Last Mile of Reporting
How Automation is Driving Efficiency Through the Last Mile of Reporting
 
02_Fabio Colombo_Accenture_MeetupDora&Cybersecurity.pptx
02_Fabio Colombo_Accenture_MeetupDora&Cybersecurity.pptx02_Fabio Colombo_Accenture_MeetupDora&Cybersecurity.pptx
02_Fabio Colombo_Accenture_MeetupDora&Cybersecurity.pptx
 
Vip B Aizawl Call Girls #9907093804 Contact Number Escorts Service Aizawl
Vip B Aizawl Call Girls #9907093804 Contact Number Escorts Service AizawlVip B Aizawl Call Girls #9907093804 Contact Number Escorts Service Aizawl
Vip B Aizawl Call Girls #9907093804 Contact Number Escorts Service Aizawl
 
Bladex Earnings Call Presentation 1Q2024
Bladex Earnings Call Presentation 1Q2024Bladex Earnings Call Presentation 1Q2024
Bladex Earnings Call Presentation 1Q2024
 
(ANIKA) Budhwar Peth Call Girls Just Call 7001035870 [ Cash on Delivery ] Pun...
(ANIKA) Budhwar Peth Call Girls Just Call 7001035870 [ Cash on Delivery ] Pun...(ANIKA) Budhwar Peth Call Girls Just Call 7001035870 [ Cash on Delivery ] Pun...
(ANIKA) Budhwar Peth Call Girls Just Call 7001035870 [ Cash on Delivery ] Pun...
 
High Class Call Girls Nagpur Grishma Call 7001035870 Meet With Nagpur Escorts
High Class Call Girls Nagpur Grishma Call 7001035870 Meet With Nagpur EscortsHigh Class Call Girls Nagpur Grishma Call 7001035870 Meet With Nagpur Escorts
High Class Call Girls Nagpur Grishma Call 7001035870 Meet With Nagpur Escorts
 

Merrill Lynch Report Addresses Potential Conflicts of Interest

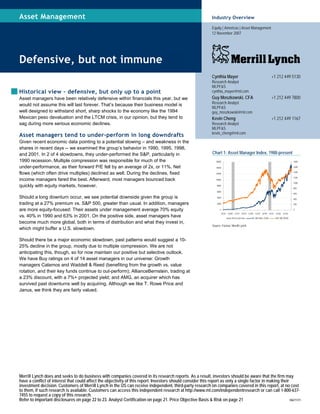
  • 1. Merrill Lynch does and seeks to do business with companies covered in its research reports. As a result, investors should be aware that the firm may have a conflict of interest that could affect the objectivity of this report. Investors should consider this report as only a single factor in making their investment decision. Customers of Merrill Lynch in the US can receive independent, third-party research on companies covered in this report, at no cost to them, if such research is available. Customers can access this independent research at http://www.ml.com/independentresearch or can call 1-800-637- 7455 to request a copy of this research. Refer to important disclosures on page 22 to 23. Analyst Certification on page 21. Price Objective Basis & Risk on page 21 10671171 Asset Management Defensive, but not immune Historical view – defensive, but only up to a point Asset managers have been relatively defensive within financials this year, but we would not assume this will last forever. That’s because their business model is well designed to withstand short, sharp shocks to the economy like the 1994 Mexican peso devaluation and the LTCM crisis, in our opinion, but they tend to sag during more serious economic declines. Asset managers tend to under-perform in long downdrafts Given recent economic data pointing to a potential slowing – and weakness in the shares in recent days -- we examined the group’s behavior in 1990, 1995, 1998, and 2001. In 2 of 4 slowdowns, they under-performed the S&P, particularly in 1990 recession. Multiple compression was responsible for much of the under-performance, as their forward P/E fell by an average of 2x, or 11%. Net flows (which often drive multiples) declined as well. During the declines, fixed income managers fared the best. Afterward, most managers bounced back quickly with equity markets, however. Should a long downturn occur, we see potential downside given the group is trading at a 27% premium vs. S&P 500, greater than usual. In addition, managers are more equity-focused: Their assets under management average 70% equity vs. 40% in 1990 and 63% in 2001. On the positive side, asset managers have become much more global, both in terms of distribution and what they invest in, which might buffer a U.S. slowdown. Should there be a major economic slowdown, past patterns would suggest a 10- 25% decline in the group, mostly due to multiple compression. We are not anticipating this, though, so for now maintain our positive but selective outlook. We have Buy ratings on 4 of 14 asset managers in our universe: Growth managers Calamos and Waddell & Reed (benefiting from the growth vs. value rotation, and their key funds continue to out-perform); AllianceBernstein, trading at a 23% discount, with a 7%+ projected yield; and AMG, an acquirer which has survived past downturns well by acquiring. Although we like T. Rowe Price and Janus, we think they are fairly valued. Industry Overview Equity | Americas | Asset Management 12 November 2007 Cynthia Mayer +1 212 449 5130 Research Analyst MLPF&S cynthia_mayer@ml.com Guy Moszkowski, CFA +1 212 449 7800 Research Analyst MLPF&S guy_moszkowski@ml.com Kevin Cheng +1 212 449 1167 Research Analyst MLPF&S kevin_cheng@ml.com Chart 1: Asset Manager Index, 1988-present 0 2000 4000 6000 8000 10000 12000 14000 16000 12/'87 12/'89 12/'91 12/'93 12/'95 12/'97 12/'99 12/'01 12/'03 12/'05 0 200 400 600 800 1000 1200 1400 1600 1800 Recession bars ML AM Index (LHS) S&P 500 (RHS) Source: Factset, Merrill Lynch
  • 2. Asset Management 12 November 2007 2 Defensive, but only up to a point Asset managers have been a relatively good place to hide in financials so far this year. They are up about 13% while banks and brokers are down 22%. We think this reflects their lower sensitivity to yield curves, credit risk, and relatively little direct exposure to sub-prime issues. In addition, asset managers tend to out-perform in up markets and under-perform in down markets. Their r-squared vs. the S&P 500 since 1996 is .38, and so far this year they are out-performing, as expected in an up year (Chart 2 below). Chart 2: Annual performance of asset manager group and S&P 500 since 2000 23% 18% 21% 13% 37% -40% -30% -20% -10% 0% 10% 20% 30% 40% 50% 60% 2000 2001 2002 2003 2004 2005 2006 YTD Asset Managers S&P 500 Source: Merrill Lynch Longer downturns a threat But longer economic slowdowns are another matter, because the average assets gradually sag, lower employment may mean lower 401(k) contributions, and in consumer-led recessions, retail investors tend to slow sales or even redeem. Given recent economic data pointing to a potential slowing, we examined the group’s behavior in 1990, 1995, 1998, and 2001. We concluded that asset managers tend to under-perform in market declines connected to economic slowdowns, but not as badly as some other financials including brokers. The classic asset manager model – earning fees on average assets -– is ideal for riding through short, sharp shocks… ..but longer economic slowdowns are another matter, because the average assets gradually sag, and sales slow, which can hurt multiples.
  • 3. Asset Management 12 November 2007 3 In 2 of 4 slowdowns, they under-performed the S&P, particularly in 1990 recession. Asset managers out-performed in 1995-6 however, suggesting resiliency during short shocks in rising markets; they also out-performed as the tech bubble burst in 2000-2002, though in real terms they declined 20%. Table 1: Asset manager performance during economic slowdowns (ML indices as measured from S&P 500 peak to trough) ML AM ML Broker Time Frame Index S&P 500 Index May '90 - Oct '90 (including recession) -24.4% -15.8% -28.9% Jul '95 - Jul '96 26.9 14.6 6.8 Jul '98 - Oct '98 -11.4 -4.3 -35.7 Dec '00 - Dec '02 (including recession) -20.3 -33.4 -40.4 Source: Factset and Merrill Lynch Table 2: Multiple compression for group during equity market weakness coinciding with economic slowdowns (ML indices measured at nearest quarter-end) Forward four quarter P/E Date Starting Ending Change % decline 1Q90 - 3Q90 13.8x 9.5x 4.3x -31% 2Q95 - 2Q96 13.7 13.7 0.0 0% 2Q98 - 3Q98 19.3 14.8 4.5 -23% 4Q00 - 4Q02 17.9 16.4 1.5 -8% Average 16.2 13.6 2.6 -16% 2Q07 - present 19.7x 18.1x 1.6 -8.1% Source: Factset and Merrill Lynch Multiple compression was responsible for much of the under-performance during their declining periods, as their forward P/E fell by an average of 2x, or 11%. Net flows -- which often drive multiples --declined as well. Strong balance sheets probably helped, but weren’t a complete defense against the declines either. T. Rowe Price and Franklin began 1Q90 with $5 and $7 per share in net cash and investments respectively. This was equivalent to 19% and 10% of their market capitalization, similar to current levels of 10% and 12%. The cash came in handy -- T. Rowe Price used some of its cash to make whole an investment, and Franklin had increased charge-offs in its banking business – but it did not stop their share prices from declining. In the 4 sections ahead, we look in detail at the group’s performance in 1990, 1995, 1998, and 2001. Multiple compression was responsible for much of the under-performance, as their forward P/E fell by an average of 2x, or 11%.
  • 4. Asset Management 12 November 2007 4 1990 – a time to avoid asset managers Asset managers under-performed the broader market at the start of the 1990 recession. For those who believe current economic conditions most resemble 1990 (including ML strategist Richard Bernstein) this is obviously a bad sign. There are similarities: In 1990, growth was slowing, and credit and housing were issues. The June 1990 Federal Reserve Beige book sounded similar warnings, noting for instance that “[retail] sales have been slow in recent months, and are expected to remain so in the short term…Lenders are reported to have tightened standards especially for real estate loans, but there is still little information that suggests credit restraint is spreading into other markets.” Asset managers directionally followed the market up, then down The asset managers rose strongly ahead of the July 1990 recession, but as the Fed cut rates and the 8-month recession began, they fell hard (Chart 3). Chart 3: Asset manager index vs. S&P 500 1989-1991 (actual recession was 7/90 – 3/91) 80 130 180 230 280 330 380 430 480 12/30/88 6/30/89 12/30/89 6/30/90 12/30/90 6/30/91 12/30/91 200 250 300 350 400 450 Recession bars ML AM Index (LHS) S&P 500 (RHS) First Fed rate cut (6/6/89) Fed rate cuts 1989 - 1991 Second series of Fed rate cuts (7/13/90) Source: Federal Reserve Board, Merrill Lynch Economics As equity markets declined, equity fund flows also declined, and the industry had equity fund outflows briefly in 3Q90. Equity fund inflows recovered in 1991, but bond funds remained more popular (Chart 4).
  • 5. Asset Management 12 November 2007 5 Chart 4: Mutual fund net flows for equity and bond funds (industry-wide, $MM); equity fund flows were weak during market declines, including the first half of the recession -$10,000 $0 $10,000 $20,000 $30,000 $40,000 Q1'89 Q2'89 Q3'89 Q4'89 Q1'90 Q2'90 Q3'90 Q4'90 Q1'91 Q2'91 Q3'91 Q4'91 Equity Bond Source: Strategic Insight Simfund As the S&P 500 declined, asset managers declined more The asset managers under-performed, even though their businesses continued to grow. There were only a handful of small, relatively fast-growing public asset managers at the time. When the S&P 500 declined about 16% from peak in May to trough in October 1990, the group collectively declined an average of 27%. Even fixed income managers under-performed (Table 3). Table 3: Performance of asset managers in 1990 (operating changes from 1989 to 1990; share price declines from broad market peak to trough) % change 1989 - 1990 Stock price AUM % equity AUM % equity Assets under management Revenues EPS May 90 - Oct 90 at Dec '89 at Dec '90 Alliance Capital 5.7% 18.5% 33.3% -14.1% 64% 66% Franklin* 8.9 13.6 14.0 -30.2 14 12 T. Rowe Price*** 8.7 6.6 -7.2 -42.5 59 61 Legg Mason* 20.0 14.2 88.6 -23.4 34 43 Eaton Vance** 2.8 46.2 23.0 -23.5 29 25 Average 9.2 19.8 30.3 -26.7 40 41 S&P 500 -15.8 Source: Company Reports and Merrill Lynch *Note: BEN - data reflects FY 9/'89 to 9/'90; LM - FY 3/'90 to 3/'91 ** EV - FY 10/'89 to 10/'90; revenues include mutual fund acquired from Bank of New England; EPS ex-unrealized losses on gold-mining partnership. *** TROW EPS adjusted for MRT losses.
  • 6. Asset Management 12 November 2007 6 Share decline mostly due to multiple contraction… Most of the decline was due to multiple contraction, as the group average fell from 13.8x forward four quarter estimates to 9.5x in the space of two quarters (Chart 5, see highlighted bars). Asset manager multiples often follow net flows, and equity fund flows turned negative in 3Q90 and 4Q90 for most managers. Chart 5: Forward P/e of asset managers on absolute basis (1Q90 – 3Q90 highlighted) Asset Manager Composite Forward P/E 18.1x 16.1x 0.0x 5.0x 10.0x 15.0x 20.0x 25.0x 1Q90 1Q91 1Q92 1Q93 1Q94 1Q95 1Q96 1Q97 1Q98 1Q99 1Q00 1Q01 1Q02 1Q03 1Q04 1Q05 1Q06 1Q07 Average: 13.8x 9.5x Source: FactSet, First Call and Merrill Lynch Chart 6: Relative forward P/e of asset managers vs. the S&P 500 (1Q90 – 3Q90 highlighted) Forward Multiple of Asset Managers vs. S&P 500, 1990-Present 127%88% 0% 10% 20% 30% 40% 50% 60% 70% 80% 90% 100% 110% 120% 130% 140% 150% 1Q90 1Q91 1Q92 1Q93 1Q94 1Q95 1Q96 1Q97 1Q98 1Q99 1Q00 1Q01 1Q02 1Q03 1Q04 1Q05 1Q06 1Q07 Average = 94% 66% Source: FactSet, First Call and Merrill Lynch
  • 7. Asset Management 12 November 2007 7 Over full 1990-91 recession, asset managers actually did well Interestingly, while asset managers under-performed during the beginning of the 1990 recession, they out-performed over the full recession (Chart 7). Chart 7: Asset manager price performance during actual recession 7/90 – 3/91 60 70 80 90 100 110 120 130 140 150 Jul-90 Aug-90 Sep-90 Oct-90 Nov-90 Dec-90 Jan-91 Feb-91 Mar-91 asset managers S&P 500 brokers S&P 500 +4% asset mgrs +24% brokers +42% (July 1, 1990 = 100) Source: Factset and Merrill Lynch Lessons learned - The onset of recessions don’t seem to be good times to own asset managers, judging by 1990. A single rate cut didn’t seem to help them or the market. - Asset managers do out-perform in up markets, however, even those which occur mid-recession. When a series of rate cuts revived the market in 1990, asset managers snapped back too, eventually out-performing. Asset managers under-performed at the beginning of the 1990 recession, but out- performed over the full recession.
  • 8. Asset Management 12 November 2007 8 1995-1996 – asset managers led the market up Asset managers were rattled by economic setbacks in 1995-1996, but only briefly. In this case, the problems were short-lived, and the companies’ net flows were not particularly affected. The broader market was rising, and the asset manager stocks ultimately out-performed the equity market. The Fed cut rates in July 1995 were precipitated by a few specific events: - a temporary monetary squeeze in December 1994 (marked by the Orange County bankruptcy); - the December 1994 devaluation of the Mexican peso; - sluggish economic conditions: Retail sales were weak, unemployment claims were rising, and real wages were flat. Asset manager shares were weak immediately following both Fed rate cuts, but eventually went up with the market. In the roughly 13 months which followed the first Fed rate cut, the S&P 500 rose 15% and the asset managers rose 27%. (Chart 9 and Table 4). Equity fund flows barely registered any change during the period, though bond fund flows were pressured (especially munis) throughout (Chart 8). Chart 9: Asset manager index vs. the S&P 500, 1995 – 1996 (with Fed easings marked) 560 660 760 860 960 1060 1160 1260 1/3/1995 5/3/1995 9/3/1995 1/3/1996 5/3/1996 9/3/1996 400 450 500 550 600 650 700 750 ML AM Index (LHS) S&P 500 (RHS) First Fed cut (7/6/95) Fed rate cuts 1995 - 1996 Source: Federal Reserve Board, Merrill Lynch Chart 8: Equity and bond fund flows 1995-96 -$10,000 $0 $10,000 $20,000 $30,000 $40,000 $50,000 $60,000 $70,000 $80,000 Q1'95 Q2'95 Q3'95 Q4'95 Q1'96 Q2'96 Q3'96 Q4'96 Equity Bond Source: Strategic Insight Simfund and Merrill Lynch
  • 9. Asset Management 12 November 2007 9 Multiple started low, so didn’t contract Unlike 1990, there was no multiple contraction in 1995-6. The group’s average started at a low 13.7x forward four quarters and stayed there (Chart 10), though their relative P/E did lose ground (Chart 11). Lessons learned: - the asset manager model is designed well to withstand short, sharp shocks. Because they bill on average assets under management, there is a delay before the impact to earnings is felt, during which time the economy and equity markets may recover, supporting multiples again. - A low multiple is the best defense against multiple contraction Table 4: Asset manager index returns vs. S&P 500 and brokers in 1995-6 ML AM ML Broker Time Frame Index S&P 500 Index Jul '95 - Jul '96 26.9% 14.6% 6.8% Source: Factset and Merrill Lynch Chart 10: Asset managers forward four quarter P/E, 2Q95 and 2Q96 highlighted Asset Manager Composite Forward P/E 18.1x 16.1x 0.0x 5.0x 10.0x 15.0x 20.0x 25.0x 1Q90 1Q91 1Q92 1Q93 1Q94 1Q95 1Q96 1Q97 1Q98 1Q99 1Q00 1Q01 1Q02 1Q03 1Q04 1Q05 1Q06 1Q07 Average: 13.7x 13.7x Source: FactSet, First Call and Merrill Lynch Chart 11: Asset managers forward four quarter P/E vs. S&P 500, 2Q95 and 2Q96 highlighted Forward Multiple of Asset Managers vs. S&P 500, 1990-Present 127%88% 0% 10% 20% 30% 40% 50% 60% 70% 80% 90% 100% 110% 120% 130% 140% 150% 1Q90 1Q91 1Q92 1Q93 1Q94 1Q95 1Q96 1Q97 1Q98 1Q99 1Q00 1Q01 1Q02 1Q03 1Q04 1Q05 1Q06 1Q07 Average = 88% 79% Source: FactSet, First Call and Merrill Lynch
  • 10. Asset Management 12 November 2007 10 1998 – trouble for international managers The 1998 period was another one in which asset manager stocks were briefly rattled by shocks, but recovered. However this time they did not recover to the same extent as the broader market, perhaps because the Russian default had direct bearing on the popularity of emerging markets and other international funds. Franklin Resources, with its large Templeton unit, remained below its stock price highs for almost 6 years before recovering (Chart 12). Chart 13: Asset manager index and the S&P 500 during 1997 – 1998 560 1060 1560 2060 2560 3060 3560 12/31/1996 4/30/1997 8/31/1997 12/31/1997 4/30/1998 8/31/1998 12/31/1998 600 700 800 900 1000 1100 1200 1300 ML AM Index (LHS) S&P 500 (RHS) First Fed cut (9/29/98) Fed rate cuts 1997 - 1998 Source: Federal Reserve Board, Merrill Lynch Initially, asset manager stocks followed the market down (Chart 13). But while the broader market recovered, asset managers and brokers did not fully recover in line. Net flows to equity and bond funds also did not recover in 4Q98, or even 1999 (Chart 14). Overall, the asset managers under-performed the S&P 500 (Table 5). Table 5: 1998 returns of the ML asset management index, S&P 500, and ML broker index ML AM ML Broker Time Frame Index S&P 500 Index Jul '98 - Oct '98 -11.4% -4.3% -35.7% Source: Factset and Merrill Lynch Chart 12: BEN stock price — A long recovery 20 25 30 35 40 45 50 55 60 Jan-98 Jan-99 Jan-00 Jan-01 Jan-02 Jan-03 Jan-04 BEN Source: Bloomberg, Merrill Lynch Chart 14: Equity and bond fund flows ($MM) 0 10,000 20,000 30,000 40,000 50,000 60,000 70,000 Q1'97 Q2'97 Q3'97 Q4'97 Q1'98 Q2'98 Q3'98 Q4'98 Equity Bond Source: Strategic Insight Simfund and Merrill Lynch
  • 11. Asset Management 12 November 2007 11 Rapid multiple contraction The group’s average multiple contracted rapidly, reflecting the impact of sudden news, falling from 19.3x to 14.8x in one quarter (Chart 15). This was also arguably the beginning of the end to the tech bubble, and asset managers remained at a discount to the tech-heavy S&P 500 for several years (Chart 16). Lessons learned - When an asset class falls out of favor, asset manager specialists in that area may be challenged for years - Asset managers don’t always out-perform in an up market, for instance if net flows are weak Chart 15: Asset managers forward four quarter P/E, 2Q98 and 3Q98 highlighted Asset Manager Composite Forward P/E 18.1x 16.1x 0.0x 5.0x 10.0x 15.0x 20.0x 25.0x 1Q90 1Q91 1Q92 1Q93 1Q94 1Q95 1Q96 1Q97 1Q98 1Q99 1Q00 1Q01 1Q02 1Q03 1Q04 1Q05 1Q06 1Q07 Average: 19.3x 14.8x Source: FactSet, First Call and Merrill Lynch Chart 16: Asset managers forward four quarter P/E vs. S&P 500, 2Q98 and 3Q98 highlighted Forward Multiple of Asset Managers vs. S&P 500, 1990-Present 127%88% 0% 10% 20% 30% 40% 50% 60% 70% 80% 90% 100% 110% 120% 130% 140% 150% 1Q90 1Q91 1Q92 1Q93 1Q94 1Q95 1Q96 1Q97 1Q98 1Q99 1Q00 1Q01 1Q02 1Q03 1Q04 1Q05 1Q06 1Q07 Average = 78% 65% Source: FactSet, First Call and Merrill Lynch
  • 12. Asset Management 12 November 2007 12 The 2001-2002 bear market The 2001-2002 bear market was the most prolonged test of asset managers, and they all declined with the exception of Nuveen. However, they out-performed the S&P 500, which had the disadvantage of being weighed down by tech. Chart 17: Asset manager index and the S&P 500 during 2000 – 2002 3500 4000 4500 5000 5500 6000 6500 7000 7500 12/29/00 3/29/01 6/29/01 9/29/01 12/29/01 3/29/02 6/29/02 9/29/02 12/29/02 700 800 900 1000 1100 1200 1300 1400 Recession bars ML AM Index (LHS) S&P 500 (RHS) First Fed cut (1/3/01) Fed rate cuts 2000 - 2002 Source: Federal Reserve Board, Merrill Lynch
  • 13. Asset Management 12 November 2007 13 Contrary to popular belief, there were not large equity outflows during the bear market, but rather a decline in sales which led to softer flows and 2 quarters of outflows (Chart 18). Bond funds grew in popularity and picked up some of the slack, especially government and short-term bond funds in those quarters with equity outflows. Chart 18: Equity and bond fund flows 2000 through 2002 ($MM) -80,000 -60,000 -40,000 -20,000 0 20,000 40,000 60,000 80,000 100,000 120,000 140,000 Q1'00 Q2'00 Q3'00 Q4'00 Q1'01 Q2'01 Q3'01 Q4'01 Q1'02 Q2'02 Q3'02 Q4'02 Equity Bond Source: Strategic Insight Simfund and Merrill Lynch
  • 14. Asset Management 12 November 2007 14 Fixed income managers held up better Fixed income managers out-performed equity managers. Nuveen’s assets even rose 29% during this period, mostly through the sale of muni closed-end funds. Other fixed income managers lost assets, but at a much slower rate. Affiliated Managers Group (AMG) and Legg Mason, the two managers with acquisition / revenue-sharing models (and therefore less operating leverage) also seemed to do better than average. AMG survived relatively well thanks to several acquisitions. In all it acquired assets worth 20% of its starting AUM. This kept its EPS relatively flat during the period (-1%), and limited its share price downside (-8%). However, AMG declined in 2003 when acquisitions paused for a year. Table 6: Asset Manager bear market performance (2000 – 2002) % change '02/'00 AUM Revenues EPS Stock price AUM % equity AUM % equity (Dec'00 - Dec'02) (Dec'00 - Dec'02) at Dec '00 at Dec '02 Equity focus AB -14.8% -25.0% -29.4% -38.8% 60% 55% AMG -8.6 3.5 -1.2 -8.3 74 84 BEN 7.4 4.2 -30.6 -10.6 66 47 JNS -46.3 -52.4 -85.9 -66.9 94 83 TROW -15.7 -24.1 -26.9 -35.5 74 67 WDR -23.4 -15.7 -33.3 -47.7 88 76 WPL -24.8 -32.5 -44.6 -31.1 100 100 Equity manager average -18.0 -20.3 -36.0 -34.1 79.4% 73.1% Fixed income focus BLK 33.9 21.1 51.1 -6.2 13 7 FII 54.7 9.2 37.0 -12.9 15 10 LM 58.3 8.5 9.2 -10.9 33 38 EV 23.4 21.4 8.0 -12.4 45 42 JNC 28.6 7.8 23.0 32.3 38 29 Fixed income manager average 39.8 13.6 25.7 -2.0 29% 25% Group Average 6.1 -6.2 -10.3 -20.7 58% 53% S&P 500 -33.4 Source: Company Reports, Factset and Merrill Lynch
  • 15. Asset Management 12 November 2007 15 In relative terms, group out-performed S&P 500, but it wasn’t hard Relative to the S&P 500, asset managers actually out-performed during the bear market. One of the oddities of asset manager history is that the group hit its relative valuation trough (48%) during the tech bubble, when many assume it should have done well. We attribute this to the fact that the group had lost traction to index funds in the 1990s, investors were buying a limited number of funds heavily, and that toward the end of the bull market, the S&P 500 was distorted by its heavy tech weighting. As a result, the group entered 2001 trading at a 28% discount to the S&P 500. After the S&P 500 declined 33% in the next two years, asset managers ended the bear market on a relative par (Chart 20 below). Lessons learned: - Fixed income managers survive equity downturns better, but may also decline. - A tech-heavy index is easier to beat in a downturn. However, now the S&P 500 is more weighted toward financials, so asset managers are less likely to out-perform, because they would have to in a sense out- perform themselves. Chart 19: Asset manager forward P/E on absolute basis in bear market, 4Q00 and 4Q02 multiples highlighted Asset Manager Composite Forward P/E 18.1x 16.1x 0.0x 5.0x 10.0x 15.0x 20.0x 25.0x 1Q90 1Q91 1Q92 1Q93 1Q94 1Q95 1Q96 1Q97 1Q98 1Q99 1Q00 1Q01 1Q02 1Q03 1Q04 1Q05 1Q06 1Q07 Average: 17.9x 16.4x Source: First Call, FactSet and Merrill Lynch Chart 20: Asset manager forward P/E vs. S&P 500 in bear market, 4Q00 and 4Q02 highlighted Forward Multiple of Asset Managers vs. S&P 500, 1990-Present 127%88% 0% 10% 20% 30% 40% 50% 60% 70% 80% 90% 100% 110% 120% 130% 140% 150% 1Q90 1Q91 1Q92 1Q93 1Q94 1Q95 1Q96 1Q97 1Q98 1Q99 1Q00 1Q01 1Q02 1Q03 1Q04 1Q05 1Q06 1Q07 Average = 72% 96% Source: First Call, FactSet and Merrill Lynch
  • 16. Asset Management 12 November 2007 16 Current situation – out-performing Asset managers are out-performing the S&P 500 this year, as is to be expected in an overall up market. They are up 14%, ahead of the S&P 500 (+4%) (Chart 21). They are trouncing other financials, particularly banks (-22%). Chart 21: Asset manager index and the S&P 500 – 2007 YTD 90 95 100 105 110 115 120 125 12/29 1/29 2/28 3/29 4/29 5/29 6/29 7/29 8/29 9/29 10/29 S&P 500 ML AM Index +4.0% +14.2% Fed rate cut Source: Federal Reserve Board, Merrill Lynch Fed-inspired rally helped out-performance, and is typical Some of the out-performance followed the Fed’s 50bps rate cut. This has been their pattern in the past as well (Tables 8 and 9). Table 7: Sector average relative price performance following the last four Fed easing cycles (initiating in 1990, 1995, 1998, 2000, as measured from previous month) Relative Price Performance Following Cut 3-mths 6-mths 12-mths 18-mths 24-mths Consumer Discretionary 1.5% 3.7% -0.6% 0.3% 0.5% Consumer Staples 1.6 -0.7 4.0 5.8 7.7 Energy 0.1 -0.4 3.9 1.2 2.6 Financials -0.5 -0.5 -8.0 -1.5 5.1 Health Care 0.3 2.1 6.2 4.1 12.2 Industrials -0.1 2.4 1.3 -1.3 0.8 Information Technology -1.3 -1.9 3.2 16.5 7.8 Materials 1.0 -2.6 -1.2 -1.0 -4.7 Telecommunication Services 4.8 4.7 0.3 -12.9 -19.8 Utilities -0.7 -6.5 -11.5 -19.5 -18.7 Asset Manager performance 2.7 8.1 26.0 53.7 84.0 S&P 500 (absolute performance) 2.7 7.5 6.9 16.1 21.3 Source: Merrill Lynch Sector Strategy
  • 17. Asset Management 12 November 2007 17 Table 8: Asset Manager index performance following the last four Fed easing cycles (initiating in 1989 (& 1990), 1995, 1998, 2000, as measured from previous day) Rate cut dates: 1-month later 3-months later 6-months later 1-year later Jul-89 -0.2% 15.7% 20.1% 30.4% Jul-90 -7.6 -27.7 -10.5 35.8 Jul-95 7.4 14.1 15.4 35.2 Sep-98 4.7 19.3 20.4 27.0 Jan-01 11.0 -9.5 7.7 9.3 Average return: 3.1 2.4 10.6 27.5 Source: Federal Reserve Board and Merrill Lynch Summer decline – asset managers declined much more than S&P 500 Also to be expected, the asset managers under-performed during the decline in the S&P over the summer (Table 7, left). The group declined nearly 17% in under a month, close to twice the decline of the S&P 500. Those declining the most were mostly smaller sized managers whose AUM is weighted toward equity, as well as the REIT manager, Cohen & Steers. Given confusion over sub-prime, commercial paper, and widening spreads, money market manager Federated also declined. Least affected was T. Rowe Price, which has strong performance, a growing brand, and a sticky 401(k) business. Table 9: Asset Manager: Q3 peak to trough and YTD performance Change from YTD % AUM Ticker peak to trough* (%) performance equity WPL -26.7 -64.8 100% CLMS -25.9 24.7 68% CNS -23.1 -19.0 90% WDR -21.5 23.4 87% FII -20.0 13.8 17% AMG -18.5 16.4 95% GBL -17.5 41.8 97% JNS -17.0 67.7 88% BLK -16.9 25.7 38% BEN -16.4 8.0 69% EV -16.3 38.9 65% IVZ -15.4 12.7 55% LM -14.7 -22.3 34% AB -13.6 -4.7 76% TROW -11.1 38.5 81% BPFH -8.2 -4.3 76% AM ML Index -16.8 14.2 SPX Index -9.4 4.0 *July 19 and Aug 15 was Q3 peak and trough respectively for the S&P 500 Source: Bloomberg and Merrill Lynch
  • 18. Asset Management 12 November 2007 18 Valuation remains at premium, but not at an all-time high Currently, asset managers are trading at 18.1x forward four quarter estimates, a 27% premium vs. the S&P 500. While valuations remain at a premium, they still remain only 2x above to their long-term average of 16.1x. Assuming a healthy market, the group could continue to grow faster than the broader market, and possibly even expand their multiples as they grow globally. Chart 22: Asset manager forward P/E – current Asset Manager Composite Forward P/E 18.1x 16.1x 0.0x 5.0x 10.0x 15.0x 20.0x 25.0x 1Q90 1Q91 1Q92 1Q93 1Q94 1Q95 1Q96 1Q97 1Q98 1Q99 1Q00 1Q01 1Q02 1Q03 1Q04 1Q05 1Q06 1Q07 Average: Source: First Call, FactSet and Merrill Lynch Chart 23: Asset manager forward P/E vs. S&P 500 – current Forward Multiple of Asset Managers vs. S&P 500, 1990-Present 127%88% 0% 10% 20% 30% 40% 50% 60% 70% 80% 90% 100% 110% 120% 130% 140% 150% 1Q90 1Q91 1Q92 1Q93 1Q94 1Q95 1Q96 1Q97 1Q98 1Q99 1Q00 1Q01 1Q02 1Q03 1Q04 1Q05 1Q06 1Q07 Average = Source: First Call, FactSet and Merrill Lynch
  • 19. Asset Management 12 November 2007 19 What is potential downside, if past repeats? But what if we enter a long slowdown? We think the asset managers will hold up relatively well as long as there is no drawn out consumer recession. But a long slowdown could cause multiple compression. If we apply past patterns to the current situation, we can imagine a few scenarios, which together imply a potential 11% - 25% decline: Scenario 1: Reversion to mean implies 9% downside A return to their long-term average of 16.1x forward four quarter estimates would imply about 11% downside, assuming no change to estimates. Scenario 2: Replay of 1990, managers have beta of 2 = 25% downside Another hypothetical is that in a recession the S&P 500 declines 15%, similar to 1990, and the asset managers suffer multiple compression in same proportion as 1990 – equivalent to a 30% decline. (Then, they went from 13.8x to 9.5x – which would translate into a current drop from 18.1x to 12.7x). With some offset for earnings growth, this might be equivalent to a 25% decline. Scenario 3: Contraction similar to average of last 4 episodes If asset managers were to contract at a rate similar to the 4 slowings we examined, their multiples would fall about 2x, representing 11% downside. Table 10: Multiple compression for group during equity market weakness coinciding with economic slowdowns (ML indices measured at nearest quarter-end) Forward four quarter P/E Date Starting Ending Change % decline 1Q90 - 3Q90 13.8x 9.5x 4.3x -31% 2Q95 - 2Q96 13.7 13.7 0.0 0% 2Q98 - 3Q98 19.3 14.8 4.5 -23% 4Q00 - 4Q02 17.9 16.4 1.5 -8% Average 16.2 13.6 2.6 -16% 2Q07 - present 19.7x 18.1x 1.6 -8.1% Source: Factset and Merrill Lynch A repeat of past patterns would suggest a 10- 25% decline in the group, mostly due to multiple compression
  • 20. Asset Management 12 November 2007 20 We remain selective, with 4 Buys and 1 Sell Because we are not yet convinced of a long slowdown, we maintain our cautiously positive outlook, but we are selective: We have Buy ratings on 4 of 14 asset managers in our universe: Growth managers Calamos and Waddell & Reed (because we think the growth vs. value rotation will continue, and their funds continue to out-perform); AllianceBernstein, which is trading at a 23% discount, with a 7% projected yield; and AMG, an acquirer which has in the past survived downturns well by acquiring. Although we like T. Rowe Price and Janus, we think they are fairly valued. We have a Sell rating on Eaton Vance because, although we think highly of management, some of its product specialties (closed-end funds, bank loan funds, high yield, and value equity) may not attract strong flows in this environment, suggesting it should not trade at its current 22% premium. Table 11: Coverage Universe Price Company Ticker Rating 11/9/2007 INVESCO IVZ C-2-7 $27.05 AllianceBernstein AB B-1-7 74.55 BlackRock BLK RSTR** 191.20 Franklin Resources BEN B-2-7 117.23 Legg Mason LM B-2-7 72.49 T. Rowe Price TROW B-2-7 58.60 Affiliated Managers Group AMG B-1-9 120.57 Calamos CLMS C-1-7 32.25 Eaton Vance EV B-3-7 44.78 Federated Investors FII B-2-7 39.97 Janus Capital Group JNS B-2-7 35.00 Nuveen Investments JNC 6 64.8 Boston Private Holdings BPFH C-2-7 27.10 Cohen & Steers CNS C-2-7 32.25 GAMCO GBL C-2-7 54.71 Waddell & Reed WDR B-1-7 32.65 W.P. Stewart WPL C-2-9 5.27 *RESTRICTED. SOLICITATION OF COMMISSION ORDERS IS PROHIBITED. Source: Company Reports and Merrill Lynch
  • 21. Asset Management 12 November 2007 21 Price Objective Basis & Risk AllianceBernstein (AB) Our $97 price objective is based on a relative P/E and a DCF valuation, and assumes it should trade in line with the group’s long-term averages. Because Alliance is a Master Limited Partnership, total potential return includes a 6% estimated dividend yield based on earnings. The risks to our price objective are market depreciation, similar to other asset managers, and an unpredictable yield since it is based on earnings rather than fixed. Although we do not believe AllianceBernstein is likely to lose its MLP status, recent legislation proposed by the Senate addressing this issue vis a vis other companies also introduces some risk. Because MLPs have unique tax characteristics, investors should consult with their advisors. Affiliated Mgrs. (AMG) Our P.O. of $140 is based on a combination of relative P/E and DCF valuations. We give 70% weight to our relative P/E valuation ($128), which assumes that AMG should trade at a 10% discount on a relative P/E basis vs. peers to reflect use of cash EPS, leverage, and lower transparency as a holding company. We give a 30% weight to our DCF valuation of $164. Risks are market depreciation, as ~95% of AUM is in equity products, greater leverage and associated costs, and acquisition risk. Calamos (CLMS) Our $35 price objective is based on a combination of relative P/E, our DCF, and our “core+cash” valuation. We assume Calamos should trade at a 10% discount to peers given outflows and the large influence of the Calamos Growth fund. Risks are underperformance of the Growth fund, equity market depreciation, and margin pressure due to continued investment in infrastructure, staff and products at a time of outflows. Waddell & Reed (WDR) Our $34 price objective is based on a combination of relative P/E and a DCF valuation, which we use as a proxy for acquisition value. Our relative P/E target assumes that Waddell shares should trade in line vs. the group’s long-term average relative P/E, based on above-average organic growth offset by below-average operating margins. Risks to our price objective are market depreciation and investment under-performance, as for all asset managers, and an industry shift away from proprietary sales networks such as Waddell’s Advisors channel. In addition Waddell has concentration risk, as the Ivy Global Natural Resources fund comprises about 13% of AUM, and its other funds contain energy positions as well. Analyst Certification I, Cynthia Mayer, hereby certify that the views expressed in this research report accurately reflect my personal views about the subject securities and issuers. I also certify that no part of my compensation was, is, or will be, directly or indirectly, related to the specific recommendations or view expressed in this research report.
  • 22. Asset Management 12 November 2007 22 Important Disclosures Investment Rating Distribution: Financial Services Group (as of 01 Oct 2007) Coverage Universe Count Percent Inv. Banking Relationships* Count Percent Buy 108 38.85% Buy 45 44.55% Neutral 156 56.12% Neutral 67 45.27% Sell 14 5.04% Sell 4 28.57% Investment Rating Distribution: Global Group (as of 01 Oct 2007) Coverage Universe Count Percent Inv. Banking Relationships* Count Percent Buy 1701 47.03% Buy 437 29.15% Neutral 1611 44.54% Neutral 425 29.11% Sell 305 8.43% Sell 58 21.09% * Companies in respect of which MLPF&S or an affiliate has received compensation for investment banking services within the past 12 months. FUNDAMENTAL EQUITY OPINION KEY: Opinions include a Volatility Risk Rating, an Investment Rating and an Income Rating. VOLATILITY RISK RATINGS, indicators of potential price fluctuation, are: A - Low, B - Medium, and C - High. INVESTMENT RATINGS, indicators of expected total return (price appreciation plus yield) within the 12-month period from the date of the initial rating, are: 1 - Buy (10% or more for Low and Medium Volatility Risk Securities - 20% or more for High Volatility Risk securities); 2 - Neutral (0-10% for Low and Medium Volatility Risk securities - 0-20% for High Volatility Risk securities); 3 - Sell (negative return); and 6 - No Rating. INCOME RATINGS, indicators of potential cash dividends, are: 7 - same/higher (dividend considered to be secure); 8 - same/lower (dividend not considered to be secure); and 9 - pays no cash dividend. Price charts for the equity securities referenced in this research report are available at http://www.ml.com/research/pricecharts.asp, or call 1-888-ML-CHART to have them mailed. MLPF&S or one of its affiliates acts as a market maker for the securities recommended in the report: AllianceBernstein, AMG., Calamos, Eaton Vance, Janus Capital, T. Rowe Price, Waddell & Reed. MLPF&S or an affiliate was a manager of a public offering of securities of this company within the last 12 months: Eaton Vance, Janus Capital. The company is or was, within the last 12 months, an investment banking client of MLPF&S and/or one or more of its affiliates: AllianceBernstein, AMG., Calamos, Eaton Vance, Janus Capital, Waddell & Reed. MLPF&S or an affiliate has received compensation from the company for non-investment banking services or products within the past 12 months: AllianceBernstein, AMG., Calamos, Eaton Vance, Janus Capital, T. Rowe Price, Waddell & Reed. The company is or was, within the last 12 months, a non-securities business client of MLPF&S and/or one or more of its affiliates: AllianceBernstein, AMG., Calamos, Eaton Vance, Janus Capital, T. Rowe Price, Waddell & Reed. MLPF&S or an affiliate has received compensation for investment banking services from this company within the past 12 months: AllianceBernstein, AMG., Calamos, Eaton Vance, Janus Capital, Waddell & Reed. MLPF&S or an affiliate expects to receive or intends to seek compensation for investment banking services from this company within the next three months: AllianceBernstein, AMG., Calamos, Eaton Vance, Janus Capital, Waddell & Reed. MLPF&S together with its affiliates beneficially owns one percent or more of the common stock of this company. If this report was issued on or after the 10th day of the month, it reflects the ownership position on the last day of the previous month. Reports issued before the 10th day of a month reflect the ownership position at the end of the second month preceding the date of the report: AllianceBernstein, AMG., Waddell & Reed. MLPF&S or one of its affiliates is willing to sell to, or buy from, clients the common equity of the company on a principal basis: AllianceBernstein, AMG., Calamos, Eaton Vance, Janus Capital, T. Rowe Price, Waddell & Reed. The company is or was, within the last 12 months, a securities business client (non-investment banking) of MLPF&S and/or one or more of its affiliates: AllianceBernstein, AMG., Calamos, Eaton Vance, Janus Capital, T. Rowe Price, Waddell & Reed. The analyst(s) responsible for covering the securities in this report receive compensation based upon, among other factors, the overall profitability of Merrill Lynch, including profits derived from investment banking revenues.
  • 23. Asset Management 12 November 2007 23 Other Important Disclosures UK readers: MLPF&S or an affiliate is a liquidity provider for the securities discussed in this report. MLPF&S or one of its affiliates has a significant financial interest in the fixed income instruments of the issuer. If this report was issued on or after the 10th day of a month, it reflects a significant financial interest on the last day of the previous month. Reports issued before the 10th day of a month reflect a significant financial interest at the end of the second month preceding the date of the report: Eaton Vance, Janus Capital. Information relating to Non-U.S. affiliates of Merrill Lynch, Pierce, Fenner & Smith Incorporated (MLPF&S): MLPF&S distributes research reports of the following non-US affiliates in the US (short name: legal name): Merrill Lynch (France): Merrill Lynch Capital Markets (France) SAS; Merrill Lynch (Frankfurt): Merrill Lynch International Bank Ltd, Frankfurt Branch; Merrill Lynch (South Africa): Merrill Lynch South Africa (Pty) Ltd; Merrill Lynch (Milan): Merrill Lynch International Bank Limited; MLPF&S (UK): Merrill Lynch, Pierce, Fenner & Smith Limited; Merrill Lynch (Australia): Merrill Lynch Equities (Australia) Limited; Merrill Lynch (Hong Kong): Merrill Lynch (Asia Pacific) Limited; Merrill Lynch (Singapore): Merrill Lynch (Singapore) Pte Ltd; Merrill Lynch (Canada): Merrill Lynch Canada Inc; Merrill Lynch (Mexico): Merrill Lynch Mexico, SA de CV, Casa de Bolsa; Merrill Lynch (Argentina): Merrill Lynch Argentina SA; Merrill Lynch (Japan): Merrill Lynch Japan Securities Co, Ltd; Merrill Lynch (Seoul): Merrill Lynch International Incorporated (Seoul Branch); Merrill Lynch (Taiwan): Merrill Lynch Global (Taiwan) Limited; DSP Merrill Lynch (India): DSP Merrill Lynch Limited; PT Merrill Lynch (Indonesia): PT Merrill Lynch Indonesia; Merrill Lynch (KL) Sdn. Bhd.: Merrill Lynch (Malaysia); Merrill Lynch (Israel): Merrill Lynch Israel Limited; Merrill Lynch (Russia): Merrill Lynch CIS Limited, Moscow; Merrill Lynch (Turkey): Merrill Lynch Yatirim Bankasi A.S.; Merrill Lynch (Dubai): Merrill Lynch International Bank Ltd, Dubai Branch. This research report has been prepared and issued by MLPF&S and/or one or more of its non-U.S. affiliates. MLPF&S is the distributor of this research report in the U.S. and accepts full responsibility for research reports of its non-U.S. affiliates distributed in the U.S. Any U.S. person receiving this research report and wishing to effect any transaction in any security discussed in the report should do so through MLPF&S and not such foreign affiliates. This research report has been approved for publication in the United Kingdom by Merrill Lynch, Pierce, Fenner & Smith Limited, which is authorized and regulated by the Financial Services Authority; has been considered and distributed in Japan by Merrill Lynch Japan Securities Co, Ltd, a registered securities dealer under the Securities and Exchange Law in Japan; is distributed in Hong Kong by Merrill Lynch (Asia Pacific) Limited, which is regulated by the Hong Kong SFC; is issued and distributed in Taiwan by Merrill Lynch Global (Taiwan) Ltd or Merrill Lynch, Pierce, Fenner & Smith Limited (Taiwan Branch); is issued and distributed in Malaysia by Merrill Lynch (KL) Sdn. Bhd., a licensed investment adviser regulated by the Malaysian Securities Commission; is issued and distributed in India by DSP Merrill Lynch Limited; and is issued and distributed in Singapore by Merrill Lynch International Bank Limited (Merchant Bank) and Merrill Lynch (Singapore) Pte Ltd (Company Registration No.’s F 06872E and 198602883D respectively). Merrill Lynch International Bank Limited (Merchant Bank) and Merrill Lynch (Singapore) Pte Ltd. are regulated by the Monetary Authority of Singapore. Merrill Lynch Equities (Australia) Limited, (ABN 65 006 276 795), AFS License 235132, provides this report in Australia. No approval is required for publication or distribution of this report in Brazil. Merrill Lynch (Frankfurt) distributes this report in Germany. Merrill Lynch (Frankfurt) is regulated by BaFin. Copyright, User Agreement and other general information related to this report: Copyright 2007 Merrill Lynch, Pierce, Fenner & Smith Incorporated. All rights reserved. This research report is prepared for the use of Merrill Lynch clients and may not be redistributed, retransmitted or disclosed, in whole or in part, or in any form or manner, without the express written consent of Merrill Lynch. Merrill Lynch research reports are distributed simultaneously to internal and client websites eligible to receive such research prior to any public dissemination by Merrill Lynch of the research report or information or opinion contained therein. Any unauthorized use or disclosure is prohibited. Receipt and review of this research report constitutes your agreement not to redistribute, retransmit, or disclose to others the contents, opinions, conclusion, or information contained in this report (including any investment recommendations, estimates or price targets) prior to Merrill Lynch's public disclosure of such information. The information herein (other than disclosure information relating to Merrill Lynch and its affiliates) was obtained from various sources and we do not guarantee its accuracy. Merrill Lynch makes no representations or warranties whatsoever as to the data and information provided in any third party referenced website and shall have no liability or responsibility arising out of or in connection with any such referenced website. This research report provides general information only. Neither the information nor any opinion expressed constitutes an offer or an invitation to make an offer, to buy or sell any securities or other investment or any options, futures or derivatives related to such securities or investments. It is not intended to provide personal investment advice and it does not take into account the specific investment objectives, financial situation and the particular needs of any specific person who may receive this report. Investors should seek financial advice regarding the appropriateness of investing in any securities, other investment or investment strategies discussed or recommended in this report and should understand that statements regarding future prospects may not be realized. Investors should note that income from such securities or other investments, if any, may fluctuate and that price or value of such securities and investments may rise or fall. Accordingly, investors may receive back less than originally invested. Past performance is not necessarily a guide to future performance. Any information relating to the tax status of financial instruments discussed herein is not intended to provide tax advice or to be used by anyone to provide tax advice. Investors are urged to seek tax advice based on their particular circumstances from an independent tax professional. Foreign currency rates of exchange may adversely affect the value, price or income of any security or related investment mentioned in this report. In addition, investors in securities such as ADRs, whose values are influenced by the currency of the underlying security, effectively assume currency risk. Officers of MLPF&S or one or more of its affiliates (other than research analysts) may have a financial interest in securities of the issuer(s) or in related investments. Merrill Lynch Research policies relating to conflicts of interest are described at http://www.ml.com/media/43347.pdf. Fundamental equity reports are produced on a regular basis as necessary to keep the investment recommendation current.