SlideShare a Scribd company logo
1 of 4
Download to read offline
Page 1
May 16th, 2018
US BUSINESS CYCLE TIMING
Suttle Economics Notes #37
• The decline in the unemployment rate, to 3.9%, takes us into late-cycle territory
• In my central scenario for the economy, the pieces fall into place for a recession in 2020H1
• Corporate caution has dominated this expansion; it will keep the next recession mild
• Tighter financial conditions will result from the Fed, but an oil shock is also a risk
8 post-1960 expansions (NBER definitions)
1) Mar 61-Dec 69; 2) Dec 70-Nov 73; 3) Apr 75-Jan 80;
4) Aug 80-Jul 81; 5) Dec 82-Jul 90; 6) Apr 91-Mar 01; 7)
Dec 01-Dec 07; 8) Jul 09 to present.
We are in the later stages of the 8th
US business cycle
expansion since 1960. The longest expansion was the
one that began in March 1991, at the end of the first
Gulf War, which lasted 120 months. May is the 107th
month of the current expansion, which officially
makes it the second longest on record.
The unemployment rate serves as the best and most
timely indicator of overall business cycle conditions.
So long as it is stable-to-declining, the expansion is
proceeding (Chart 1). The April reading of 3.9% has
been exceeded on a sustained basis only during the
long, overheating expansion of the 1960s. In the last 3
complete expansions, the unemployment rate has hit
a cyclical low about 12-18 months before the onset of
recession. Subsequent to this low, the unemployment
rate has levelled off before beginning to rise again. An
increase in the unemployment rate from the cyclical
low of ½% point has served as a reliable signal (both
necessary and sufficient) that a recession is underway.
A stylized view of the late-cycle
The right way to think about a late cycle phase is that
it means that the economy is running out of room to
grow at a robust, above-trend pace. In such an
environment, the probability of running into a variety
of capacity constraints goes up, which can mean a
mix of accelerating inflation, a squeeze on profit
margins, a deteriorating external imbalance or some
combination of all three. One of the most important
features of a late-cycle environment is that monetary
policy becomes more restrictive, as policymakers
become concerned about overheating risks—either
through inflation or some financial excess (often
associated with asset price excesses and property
speculation). The prevalence of late-cycle conditions
does not mean that the economy is guaranteed to tip
into recession in the short-term, but such a risk is
intensified. Some kind of financial shock (either
through the stock market or through the oil price) is
then enough to tip the balance of the economy down.
3
4
5
6
7
8
9
10
11
0 12 24 36 48 60 72 84 96 108120
61 70
75 80
82 91
01 09
Chart 1
US unemployment rate
% of labor force
months of expansion
-7
-5
-3
-1
1
3
5
0 12 24 36 48 60 72 84 96 108120
61 70
75 80
82 91
01 09
Chart 2
Real wages
avg hourly earnings deflated by CPI; %oya
months of expansion
Page 2
May 16th, 2018
The late cycle phase of 2018-20
I see the current late-cycle phase playing out in the
following way. This is my central forecast, with plenty
of two-sided risk. Political considerations aside (a big
uncertainty), I think we about two years away from the
onset of the next recession (i.e. about mid-2020). I
expect the unemployment rate to decline further
through 2018, to a low below 3.5%. Growth should
average about 3% over this period. Inflation (core PCE
deflator) will drift up, to about 2.3%oya by 18Q4 and
the Fed will tighten once a quarter. Growth will then
slow through 2019 as fiscal stimulus fades; monetary
policy is tightened; and corporates remain cautious.
Inflation will edge up even as growth slows (in part,
because of USD weakness).
Inflation heading to 2.5%oya in 19Q4 will be enough
to keep the Fed in action (another four hikes in 2019),
even as growth slows. The Funds rate would end 2019
at 3.375%, and cumulative tightening from the low
will have been 325bp. This compares to a cumulative
350bp (1994 to 2000) and 425bp (2004-06) in the last
two tightening cycles. As has become usual, the Fed
will stop tightening ahead of the onset of recession. It
will likely do so as the unemployment rate begins to
edge back up, having been stable at about 3.5% from
2018Q4 through 2019Q3. Fed tightening of this
magnitude may be necessary for the onset of
recession, but it may not be sufficient: the tipping
factor will probably be a significant deterioration in
financial conditions—most likely via the equity market.
The rest of this note walks through the evolution of
key economic variables through post-1960 cycles,
lining up where we are now with past performance.
Inflation accelerates more than real wages
Central banks—the Fed included—seem to be
adopting a view that any sign of inflation overheating
will be evident in the labor market, in the form of
rising wage inflation. It is hard to spot a consistent
acceleration pattern in real wages in the later stages
of business cycles, however (Chart 2). Note also that
the performance of real wage growth through this
expansion hardly stands out as weak (especially given
that productivity growth has been so anemic). Real
wage growth was weakest through the 1980s
expansion, mainly because inflation was higher.
Core CPI inflation does consistently accelerate late-
cycle (and into the recession), often in a “hockey stick”
fashion (Chart 3). Again, performance through the
current expansion does not look unusually weak
relative to past cycles (we seem to be tracking the
Clinton expansion of the 1990s). The experience of the
later 1960s is also worth bearing in mind,
Expectations began to rise from 1966 on and this
became a problem (there is a reason we cite
Friedman AER 1968). Note that this was also the only
0
2
4
6
8
10
12
0 12 24 36 48 60 72 84 96 108120
61 70
75 80
82 91
01 09
Chart 3
Core CPI
ex-food-and-energy; %oya
months of expansion
-7
-5
-3
-1
1
3
5
7
0 4 8 12 16 20 24 28 32 36 40
61Q1 70Q4
75Q1 80Q3
82Q4 91Q1
01Q4 09Q2
Chart 4
Corporate financing gap
Non-financial sector; % of gross value added
quarters of expansion
-2.5
-2.0
-1.5
-1.0
-0.5
0.0
0.5
1.0
1.5
2.0
2.5
0 4 8 12 16 20 24 28 32 36 40
61Q1 70Q4
75Q1 80Q3
82Q4 91Q1
01Q4 09Q2
Chart 5
Business fixed investment
% point contribution to GDP; last 4q
quarters of expansion
Page 3
May 16th, 2018
other time that we have experienced a significant
peacetime fiscal expansion at full employment.
Business sector caution in context
While labor market signals point to late-cycle
conditions, this is less the case for measures of
corporate behavior. The creation of a significant
financing gap—the difference between cash flow
generated by operation and investment outlays—has
always been a reliable precursor of a downturn, and
we are currently some way from that (Chart 4). I would
expect this financial position to deteriorate over the
next few quarters. But even then, do not look for the
emergence of a gap similar to those seen in the past—
especially during the later 1990s. We will look back on
this expansion as one when the corporate sector—
scarred by near-death experiences in 2008-09—was
ultra-cautious. Business investment has been very
weak by historic standards (although is now picking
up; Chart 5). Manufacturing capacity utilization has
been running close to levels previously seen at the
end of recessions (Chart 6). The upside of this
excessive corporate caution is that the next recession
is likely to be quite mild (as in 1990-91 and 2001).
For all the talk of excessive debt creation through this
expansion, corporate lenders have been very
conservative and lending spreads have been
consistently higher than in previous ones (a mixture of
regulation and behavior). We are now close to the
lows in corporate spreads for this cycle but are poised
to move higher in coming quarters as the risks
associated with Fed tightening become more of a
focus (Chart 7).
Assessing the impact of tighter financial conditions
The main factors weakening demand growth through
2019 will be reduced fiscal thrust (fading demand
impact from tax cuts) and tighter financial conditions.
The personal sector saving rate is a channel through
which the latter operates although, once again, the
real move up tends to come through a recession
(Chart 8; check out the end point of each expansion
with the starting point of the subsequent expansion).
The stance of monetary policy is the main driver of
financial conditions. The level of the real Fed funds
rate has been the most extreme outlier condition of
this expansion to date (Chart 9). Negative real rates
were a standard feature of expansions in the 1970s.
The Volcker shock of 1980-81 opened the door to 20
years of significantly positive real rates. The past two
expansions have seen a return to sustained negative
real policy rates. With the exception of 1980, it is hard
to spot the Fed as murderer of the expansion. As the
expansion progresses, the Fed typically normalizes
rates, with the most significant increases coming in
waves from mid-cycle on (e.g. the long expansion of
the 1990s). This time around, normalization has been
60
65
70
75
80
85
90
95
0 12 24 36 48 60 72 84 96 108120
61 70
75 80
82 91
01 09
Chart 6
Capacity utilization
% of total
months of expansion
0
50
100
150
200
250
300
350
400
0 12 24 36 48 60 72 84 96 108120
61 70
75 80
82 91
01 09
Chart 7
Corporate debt spreads
bp; BAA over UST
months of expansion
0
2
4
6
8
10
12
14
16
0 12 24 36 48 60 72 84 96 108120
61 70
75 80
82 91
01 09
Chart 8
Personal sector saving rate
% disposable income
months of expansion
Page 4
May 16th, 2018
very delayed, with catch up now underway. This,
combined with extreme corporate caution, explains
why 325bp may be enough to create a recession.
The slope of the yield curve is widely accepted to have
useful cyclical properties. Two aspects stand out
about the recent experience, however. First, the curve
has been consistently steeper through this expansion
than in all other post-1960 expansions (Chart 10). This
has occurred despite QE. The unusual degree of curve
steepness is, of course, the consequence of such a low
Funds rate. Second, the most recent flattening fits
with a late-cycle pattern. The curve typically reaches
its flattest point about a year before the end of the
expansion. On my analog that would be sometime in
mid-2019.
Equity prices will have a powerful influence on the
saving rate. It is hard to spot a reliable pattern
between dips in prices and subsequent cyclical
developments, although real equity prices typically
level off in the last 2 years of an expansion (Chart 11).
Finally, oil prices have some very useful properties as
recession signals. Spikes preceded recessions in 1974,
1979, 1999-00 and 2007 (Chart 12). This is a key risk of
the President’s Iran policy.
Philip Suttle
phil@suttleeconomics.com
202-378-6793
Important Information
While we make every effort to ensure that the analysis in this
note is as accurate as possible, we do not guarantee that the
information contained is either complete or correct. The material
has been provided for informational and educational purposes
only. The information is not intended to provide or constitute
investment, accounting, tax or legal advice.
-5
-3
-1
1
3
5
7
9
0 12 24 36 48 60 72 84 96 108120
61 70
75 80
82 91
01 09
Chart 9
Real Fed funds rate
%; deflated by CPI
months of expansion
-150
-100
-50
0
50
100
150
200
250
300
0 12 24 36 48 60 72 84 96 108120
61 70
75 80
82 91
01 09
Chart 10
10s-2s UST slope
bp; 61 & 70 are 10s-1s slope
months of expansion
80
100
120
140
160
180
200
220
240
260
280
0 12 24 36 48 60 72 84 96 108120
61 70
75 80
82 91
01 09
Chart 11
Real equity prices
Trough = 100
months of expansion
0
50
100
150
200
250
300
350
400
450
25
50
75
100
125
150
175
200
225
250
0 12 24 36 48 60 72 84 96 108120
61
70
75
80
82
91
09
01 (RHS)
Chart 12
Real oil price
WTI deflated by US CPI; Trough = 100
months of expansion

More Related Content

What's hot

Investing for Doctors | Q3 Market Review
Investing for Doctors | Q3 Market ReviewInvesting for Doctors | Q3 Market Review
Investing for Doctors | Q3 Market ReviewLFGmarketing
 
Downturns & Recoveries
Downturns & RecoveriesDownturns & Recoveries
Downturns & RecoveriesGreg Ferguson
 
Business cycles recessions and economic booms
Business cycles recessions and economic boomsBusiness cycles recessions and economic booms
Business cycles recessions and economic boomsWelling School Sixth Form
 
mkt timing regression and reality
mkt timing regression and realitymkt timing regression and reality
mkt timing regression and realitySri Chilukuri
 
What do recessions look like?
What do recessions look like?What do recessions look like?
What do recessions look like?mattbentley34
 
Chapter 12 - Monetary Policy
Chapter 12 - Monetary PolicyChapter 12 - Monetary Policy
Chapter 12 - Monetary PolicyRyan Herzog
 
Db Oil & The Global Economy
Db Oil & The Global EconomyDb Oil & The Global Economy
Db Oil & The Global Economyspratnoco
 
Inside thegurumind alangreenspan
Inside thegurumind alangreenspanInside thegurumind alangreenspan
Inside thegurumind alangreenspanRichard Go
 
Investing for Physicians | Q2 Market Review
Investing for Physicians | Q2 Market ReviewInvesting for Physicians | Q2 Market Review
Investing for Physicians | Q2 Market ReviewLFGmarketing
 
Marketing Strategy - Leeward BA
Marketing Strategy - Leeward BAMarketing Strategy - Leeward BA
Marketing Strategy - Leeward BADevan Daniels
 
War and the effect on the markets oct 15 (1)
War and the effect on the markets   oct 15 (1)War and the effect on the markets   oct 15 (1)
War and the effect on the markets oct 15 (1)Jonny Byczok
 
Olympian Capital Mgmt.LLC
Olympian Capital Mgmt.LLCOlympian Capital Mgmt.LLC
Olympian Capital Mgmt.LLCMichael J Levas
 
Morgans Investment Strategy Q3 2018.
Morgans Investment Strategy Q3 2018.Morgans Investment Strategy Q3 2018.
Morgans Investment Strategy Q3 2018.StephenCole51
 
Monetary policy & Economic Indicators
Monetary policy & Economic IndicatorsMonetary policy & Economic Indicators
Monetary policy & Economic IndicatorsNouman Tamimi
 

What's hot (17)

Investing for Doctors | Q3 Market Review
Investing for Doctors | Q3 Market ReviewInvesting for Doctors | Q3 Market Review
Investing for Doctors | Q3 Market Review
 
Investment Insights for August, 2017
Investment Insights for August, 2017Investment Insights for August, 2017
Investment Insights for August, 2017
 
Downturns & Recoveries
Downturns & RecoveriesDownturns & Recoveries
Downturns & Recoveries
 
Business cycles recessions and economic booms
Business cycles recessions and economic boomsBusiness cycles recessions and economic booms
Business cycles recessions and economic booms
 
mkt timing regression and reality
mkt timing regression and realitymkt timing regression and reality
mkt timing regression and reality
 
What do recessions look like?
What do recessions look like?What do recessions look like?
What do recessions look like?
 
Chapter 12 - Monetary Policy
Chapter 12 - Monetary PolicyChapter 12 - Monetary Policy
Chapter 12 - Monetary Policy
 
Q2 Investment Review
Q2 Investment ReviewQ2 Investment Review
Q2 Investment Review
 
PPT_Nikhil Mohan
PPT_Nikhil MohanPPT_Nikhil Mohan
PPT_Nikhil Mohan
 
Db Oil & The Global Economy
Db Oil & The Global EconomyDb Oil & The Global Economy
Db Oil & The Global Economy
 
Inside thegurumind alangreenspan
Inside thegurumind alangreenspanInside thegurumind alangreenspan
Inside thegurumind alangreenspan
 
Investing for Physicians | Q2 Market Review
Investing for Physicians | Q2 Market ReviewInvesting for Physicians | Q2 Market Review
Investing for Physicians | Q2 Market Review
 
Marketing Strategy - Leeward BA
Marketing Strategy - Leeward BAMarketing Strategy - Leeward BA
Marketing Strategy - Leeward BA
 
War and the effect on the markets oct 15 (1)
War and the effect on the markets   oct 15 (1)War and the effect on the markets   oct 15 (1)
War and the effect on the markets oct 15 (1)
 
Olympian Capital Mgmt.LLC
Olympian Capital Mgmt.LLCOlympian Capital Mgmt.LLC
Olympian Capital Mgmt.LLC
 
Morgans Investment Strategy Q3 2018.
Morgans Investment Strategy Q3 2018.Morgans Investment Strategy Q3 2018.
Morgans Investment Strategy Q3 2018.
 
Monetary policy & Economic Indicators
Monetary policy & Economic IndicatorsMonetary policy & Economic Indicators
Monetary policy & Economic Indicators
 

Similar to US Business Cycle Timing

To the Point, October 27 2009
To the Point, October 27 2009To the Point, October 27 2009
To the Point, October 27 2009Swedbank
 
Global Market Outlook - Equities
Global Market Outlook - EquitiesGlobal Market Outlook - Equities
Global Market Outlook - EquitiesChris Kearns
 
A strategy for adjustment
A strategy for adjustmentA strategy for adjustment
A strategy for adjustmentWesley Fogel
 
Goldman Sachs - Macro Outlook 2023
Goldman Sachs - Macro Outlook 2023Goldman Sachs - Macro Outlook 2023
Goldman Sachs - Macro Outlook 2023Investoida
 
How strong a comeback for inflation?
How strong a comeback for inflation?How strong a comeback for inflation?
How strong a comeback for inflation?Jurgen Vluijmans
 
RESEARCH - The Fairfax Monitor - Edition 2
RESEARCH - The Fairfax Monitor - Edition 2RESEARCH - The Fairfax Monitor - Edition 2
RESEARCH - The Fairfax Monitor - Edition 2Stephen Martin
 
Global Economic Update & Strategic Investment Outlook Q2 2014
Global Economic Update & Strategic Investment Outlook Q2 2014Global Economic Update & Strategic Investment Outlook Q2 2014
Global Economic Update & Strategic Investment Outlook Q2 2014Cohen and Company
 
Our President is wrong to think like a macroeconomist
Our President is wrong to think like a macroeconomistOur President is wrong to think like a macroeconomist
Our President is wrong to think like a macroeconomistStephanie Bohn
 
The global financial crisis
The global financial crisisThe global financial crisis
The global financial crisisSpringer
 
Today’s inflation and the Great Inflation of the 1970s Similarities and diffe...
Today’s inflation and the Great Inflation of the 1970s Similarities and diffe...Today’s inflation and the Great Inflation of the 1970s Similarities and diffe...
Today’s inflation and the Great Inflation of the 1970s Similarities and diffe...Deepak Jha
 
Rollback Of Stimulus : A Risk or A Need
 Rollback Of Stimulus : A Risk or A Need Rollback Of Stimulus : A Risk or A Need
Rollback Of Stimulus : A Risk or A NeedAmitabh Vatsya
 
Macro Strategy Review Summary Jan 2014-Aug 2015
Macro Strategy Review Summary Jan 2014-Aug 2015Macro Strategy Review Summary Jan 2014-Aug 2015
Macro Strategy Review Summary Jan 2014-Aug 2015Jim Welsh
 
LBS - Asset Allocation Model – February Update
LBS - Asset Allocation Model – February UpdateLBS - Asset Allocation Model – February Update
LBS - Asset Allocation Model – February UpdateMark MacIsaac
 
BTMU Economic Brief - macro themes 2017
BTMU Economic Brief - macro themes 2017BTMU Economic Brief - macro themes 2017
BTMU Economic Brief - macro themes 2017Amir Khan
 
The Oliver Wyman Risk Journal Volume 5
The Oliver Wyman Risk Journal Volume 5The Oliver Wyman Risk Journal Volume 5
The Oliver Wyman Risk Journal Volume 5Dr. Joachim Krotz
 
WTWealth_7-2015V2 (1)
WTWealth_7-2015V2 (1)WTWealth_7-2015V2 (1)
WTWealth_7-2015V2 (1)John Heilner
 
LPL Financial Research Presents: OUTLOOK 2015
LPL Financial Research Presents: OUTLOOK 2015LPL Financial Research Presents: OUTLOOK 2015
LPL Financial Research Presents: OUTLOOK 2015JP Marketing | NE
 
The Super-Cycle Report
The Super-Cycle ReportThe Super-Cycle Report
The Super-Cycle ReportUfuk Kılıç
 

Similar to US Business Cycle Timing (20)

The deleveraging cycle
The deleveraging cycleThe deleveraging cycle
The deleveraging cycle
 
To the Point, October 27 2009
To the Point, October 27 2009To the Point, October 27 2009
To the Point, October 27 2009
 
Global Market Outlook - Equities
Global Market Outlook - EquitiesGlobal Market Outlook - Equities
Global Market Outlook - Equities
 
A strategy for adjustment
A strategy for adjustmentA strategy for adjustment
A strategy for adjustment
 
Goldman Sachs - Macro Outlook 2023
Goldman Sachs - Macro Outlook 2023Goldman Sachs - Macro Outlook 2023
Goldman Sachs - Macro Outlook 2023
 
How strong a comeback for inflation?
How strong a comeback for inflation?How strong a comeback for inflation?
How strong a comeback for inflation?
 
RESEARCH - The Fairfax Monitor - Edition 2
RESEARCH - The Fairfax Monitor - Edition 2RESEARCH - The Fairfax Monitor - Edition 2
RESEARCH - The Fairfax Monitor - Edition 2
 
The GCC's Golden Era
The GCC's Golden EraThe GCC's Golden Era
The GCC's Golden Era
 
Global Economic Update & Strategic Investment Outlook Q2 2014
Global Economic Update & Strategic Investment Outlook Q2 2014Global Economic Update & Strategic Investment Outlook Q2 2014
Global Economic Update & Strategic Investment Outlook Q2 2014
 
Our President is wrong to think like a macroeconomist
Our President is wrong to think like a macroeconomistOur President is wrong to think like a macroeconomist
Our President is wrong to think like a macroeconomist
 
The global financial crisis
The global financial crisisThe global financial crisis
The global financial crisis
 
Today’s inflation and the Great Inflation of the 1970s Similarities and diffe...
Today’s inflation and the Great Inflation of the 1970s Similarities and diffe...Today’s inflation and the Great Inflation of the 1970s Similarities and diffe...
Today’s inflation and the Great Inflation of the 1970s Similarities and diffe...
 
Rollback Of Stimulus : A Risk or A Need
 Rollback Of Stimulus : A Risk or A Need Rollback Of Stimulus : A Risk or A Need
Rollback Of Stimulus : A Risk or A Need
 
Macro Strategy Review Summary Jan 2014-Aug 2015
Macro Strategy Review Summary Jan 2014-Aug 2015Macro Strategy Review Summary Jan 2014-Aug 2015
Macro Strategy Review Summary Jan 2014-Aug 2015
 
LBS - Asset Allocation Model – February Update
LBS - Asset Allocation Model – February UpdateLBS - Asset Allocation Model – February Update
LBS - Asset Allocation Model – February Update
 
BTMU Economic Brief - macro themes 2017
BTMU Economic Brief - macro themes 2017BTMU Economic Brief - macro themes 2017
BTMU Economic Brief - macro themes 2017
 
The Oliver Wyman Risk Journal Volume 5
The Oliver Wyman Risk Journal Volume 5The Oliver Wyman Risk Journal Volume 5
The Oliver Wyman Risk Journal Volume 5
 
WTWealth_7-2015V2 (1)
WTWealth_7-2015V2 (1)WTWealth_7-2015V2 (1)
WTWealth_7-2015V2 (1)
 
LPL Financial Research Presents: OUTLOOK 2015
LPL Financial Research Presents: OUTLOOK 2015LPL Financial Research Presents: OUTLOOK 2015
LPL Financial Research Presents: OUTLOOK 2015
 
The Super-Cycle Report
The Super-Cycle ReportThe Super-Cycle Report
The Super-Cycle Report
 

Recently uploaded

Q3 2024 Earnings Conference Call and Webcast Slides
Q3 2024 Earnings Conference Call and Webcast SlidesQ3 2024 Earnings Conference Call and Webcast Slides
Q3 2024 Earnings Conference Call and Webcast SlidesMarketing847413
 
VIP Call Girls Service Dilsukhnagar Hyderabad Call +91-8250192130
VIP Call Girls Service Dilsukhnagar Hyderabad Call +91-8250192130VIP Call Girls Service Dilsukhnagar Hyderabad Call +91-8250192130
VIP Call Girls Service Dilsukhnagar Hyderabad Call +91-8250192130Suhani Kapoor
 
The Triple Threat | Article on Global Resession | Harsh Kumar
The Triple Threat | Article on Global Resession | Harsh KumarThe Triple Threat | Article on Global Resession | Harsh Kumar
The Triple Threat | Article on Global Resession | Harsh KumarHarsh Kumar
 
BPPG response - Options for Defined Benefit schemes - 19Apr24.pdf
BPPG response - Options for Defined Benefit schemes - 19Apr24.pdfBPPG response - Options for Defined Benefit schemes - 19Apr24.pdf
BPPG response - Options for Defined Benefit schemes - 19Apr24.pdfHenry Tapper
 
Instant Issue Debit Cards - School Designs
Instant Issue Debit Cards - School DesignsInstant Issue Debit Cards - School Designs
Instant Issue Debit Cards - School Designsegoetzinger
 
call girls in Nand Nagri (DELHI) 🔝 >༒9953330565🔝 genuine Escort Service 🔝✔️✔️
call girls in  Nand Nagri (DELHI) 🔝 >༒9953330565🔝 genuine Escort Service 🔝✔️✔️call girls in  Nand Nagri (DELHI) 🔝 >༒9953330565🔝 genuine Escort Service 🔝✔️✔️
call girls in Nand Nagri (DELHI) 🔝 >༒9953330565🔝 genuine Escort Service 🔝✔️✔️9953056974 Low Rate Call Girls In Saket, Delhi NCR
 
Log your LOA pain with Pension Lab's brilliant campaign
Log your LOA pain with Pension Lab's brilliant campaignLog your LOA pain with Pension Lab's brilliant campaign
Log your LOA pain with Pension Lab's brilliant campaignHenry Tapper
 
(办理学位证)加拿大萨省大学毕业证成绩单原版一比一
(办理学位证)加拿大萨省大学毕业证成绩单原版一比一(办理学位证)加拿大萨省大学毕业证成绩单原版一比一
(办理学位证)加拿大萨省大学毕业证成绩单原版一比一S SDS
 
Independent Lucknow Call Girls 8923113531WhatsApp Lucknow Call Girls make you...
Independent Lucknow Call Girls 8923113531WhatsApp Lucknow Call Girls make you...Independent Lucknow Call Girls 8923113531WhatsApp Lucknow Call Girls make you...
Independent Lucknow Call Girls 8923113531WhatsApp Lucknow Call Girls make you...makika9823
 
Attachment Of Assets......................
Attachment Of Assets......................Attachment Of Assets......................
Attachment Of Assets......................AmanBajaj36
 
Call Girls Service Nagpur Maya Call 7001035870 Meet With Nagpur Escorts
Call Girls Service Nagpur Maya Call 7001035870 Meet With Nagpur EscortsCall Girls Service Nagpur Maya Call 7001035870 Meet With Nagpur Escorts
Call Girls Service Nagpur Maya Call 7001035870 Meet With Nagpur Escortsranjana rawat
 
Interimreport1 January–31 March2024 Elo Mutual Pension Insurance Company
Interimreport1 January–31 March2024 Elo Mutual Pension Insurance CompanyInterimreport1 January–31 March2024 Elo Mutual Pension Insurance Company
Interimreport1 January–31 March2024 Elo Mutual Pension Insurance CompanyTyöeläkeyhtiö Elo
 
House of Commons ; CDC schemes overview document
House of Commons ; CDC schemes overview documentHouse of Commons ; CDC schemes overview document
House of Commons ; CDC schemes overview documentHenry Tapper
 
Stock Market Brief Deck for 4/24/24 .pdf
Stock Market Brief Deck for 4/24/24 .pdfStock Market Brief Deck for 4/24/24 .pdf
Stock Market Brief Deck for 4/24/24 .pdfMichael Silva
 
Vip B Aizawl Call Girls #9907093804 Contact Number Escorts Service Aizawl
Vip B Aizawl Call Girls #9907093804 Contact Number Escorts Service AizawlVip B Aizawl Call Girls #9907093804 Contact Number Escorts Service Aizawl
Vip B Aizawl Call Girls #9907093804 Contact Number Escorts Service Aizawlmakika9823
 
Unveiling the Top Chartered Accountants in India and Their Staggering Net Worth
Unveiling the Top Chartered Accountants in India and Their Staggering Net WorthUnveiling the Top Chartered Accountants in India and Their Staggering Net Worth
Unveiling the Top Chartered Accountants in India and Their Staggering Net WorthShaheen Kumar
 
Financial institutions facilitate financing, economic transactions, issue fun...
Financial institutions facilitate financing, economic transactions, issue fun...Financial institutions facilitate financing, economic transactions, issue fun...
Financial institutions facilitate financing, economic transactions, issue fun...Avanish Goel
 
Bladex 1Q24 Earning Results Presentation
Bladex 1Q24 Earning Results PresentationBladex 1Q24 Earning Results Presentation
Bladex 1Q24 Earning Results PresentationBladex
 
(办理原版一样)QUT毕业证昆士兰科技大学毕业证学位证留信学历认证成绩单补办
(办理原版一样)QUT毕业证昆士兰科技大学毕业证学位证留信学历认证成绩单补办(办理原版一样)QUT毕业证昆士兰科技大学毕业证学位证留信学历认证成绩单补办
(办理原版一样)QUT毕业证昆士兰科技大学毕业证学位证留信学历认证成绩单补办fqiuho152
 

Recently uploaded (20)

Q3 2024 Earnings Conference Call and Webcast Slides
Q3 2024 Earnings Conference Call and Webcast SlidesQ3 2024 Earnings Conference Call and Webcast Slides
Q3 2024 Earnings Conference Call and Webcast Slides
 
VIP Call Girls Service Dilsukhnagar Hyderabad Call +91-8250192130
VIP Call Girls Service Dilsukhnagar Hyderabad Call +91-8250192130VIP Call Girls Service Dilsukhnagar Hyderabad Call +91-8250192130
VIP Call Girls Service Dilsukhnagar Hyderabad Call +91-8250192130
 
The Triple Threat | Article on Global Resession | Harsh Kumar
The Triple Threat | Article on Global Resession | Harsh KumarThe Triple Threat | Article on Global Resession | Harsh Kumar
The Triple Threat | Article on Global Resession | Harsh Kumar
 
BPPG response - Options for Defined Benefit schemes - 19Apr24.pdf
BPPG response - Options for Defined Benefit schemes - 19Apr24.pdfBPPG response - Options for Defined Benefit schemes - 19Apr24.pdf
BPPG response - Options for Defined Benefit schemes - 19Apr24.pdf
 
Instant Issue Debit Cards - School Designs
Instant Issue Debit Cards - School DesignsInstant Issue Debit Cards - School Designs
Instant Issue Debit Cards - School Designs
 
call girls in Nand Nagri (DELHI) 🔝 >༒9953330565🔝 genuine Escort Service 🔝✔️✔️
call girls in  Nand Nagri (DELHI) 🔝 >༒9953330565🔝 genuine Escort Service 🔝✔️✔️call girls in  Nand Nagri (DELHI) 🔝 >༒9953330565🔝 genuine Escort Service 🔝✔️✔️
call girls in Nand Nagri (DELHI) 🔝 >༒9953330565🔝 genuine Escort Service 🔝✔️✔️
 
Log your LOA pain with Pension Lab's brilliant campaign
Log your LOA pain with Pension Lab's brilliant campaignLog your LOA pain with Pension Lab's brilliant campaign
Log your LOA pain with Pension Lab's brilliant campaign
 
(办理学位证)加拿大萨省大学毕业证成绩单原版一比一
(办理学位证)加拿大萨省大学毕业证成绩单原版一比一(办理学位证)加拿大萨省大学毕业证成绩单原版一比一
(办理学位证)加拿大萨省大学毕业证成绩单原版一比一
 
Independent Lucknow Call Girls 8923113531WhatsApp Lucknow Call Girls make you...
Independent Lucknow Call Girls 8923113531WhatsApp Lucknow Call Girls make you...Independent Lucknow Call Girls 8923113531WhatsApp Lucknow Call Girls make you...
Independent Lucknow Call Girls 8923113531WhatsApp Lucknow Call Girls make you...
 
Attachment Of Assets......................
Attachment Of Assets......................Attachment Of Assets......................
Attachment Of Assets......................
 
Call Girls Service Nagpur Maya Call 7001035870 Meet With Nagpur Escorts
Call Girls Service Nagpur Maya Call 7001035870 Meet With Nagpur EscortsCall Girls Service Nagpur Maya Call 7001035870 Meet With Nagpur Escorts
Call Girls Service Nagpur Maya Call 7001035870 Meet With Nagpur Escorts
 
Interimreport1 January–31 March2024 Elo Mutual Pension Insurance Company
Interimreport1 January–31 March2024 Elo Mutual Pension Insurance CompanyInterimreport1 January–31 March2024 Elo Mutual Pension Insurance Company
Interimreport1 January–31 March2024 Elo Mutual Pension Insurance Company
 
House of Commons ; CDC schemes overview document
House of Commons ; CDC schemes overview documentHouse of Commons ; CDC schemes overview document
House of Commons ; CDC schemes overview document
 
Stock Market Brief Deck for 4/24/24 .pdf
Stock Market Brief Deck for 4/24/24 .pdfStock Market Brief Deck for 4/24/24 .pdf
Stock Market Brief Deck for 4/24/24 .pdf
 
Vip B Aizawl Call Girls #9907093804 Contact Number Escorts Service Aizawl
Vip B Aizawl Call Girls #9907093804 Contact Number Escorts Service AizawlVip B Aizawl Call Girls #9907093804 Contact Number Escorts Service Aizawl
Vip B Aizawl Call Girls #9907093804 Contact Number Escorts Service Aizawl
 
Unveiling the Top Chartered Accountants in India and Their Staggering Net Worth
Unveiling the Top Chartered Accountants in India and Their Staggering Net WorthUnveiling the Top Chartered Accountants in India and Their Staggering Net Worth
Unveiling the Top Chartered Accountants in India and Their Staggering Net Worth
 
Commercial Bank Economic Capsule - April 2024
Commercial Bank Economic Capsule - April 2024Commercial Bank Economic Capsule - April 2024
Commercial Bank Economic Capsule - April 2024
 
Financial institutions facilitate financing, economic transactions, issue fun...
Financial institutions facilitate financing, economic transactions, issue fun...Financial institutions facilitate financing, economic transactions, issue fun...
Financial institutions facilitate financing, economic transactions, issue fun...
 
Bladex 1Q24 Earning Results Presentation
Bladex 1Q24 Earning Results PresentationBladex 1Q24 Earning Results Presentation
Bladex 1Q24 Earning Results Presentation
 
(办理原版一样)QUT毕业证昆士兰科技大学毕业证学位证留信学历认证成绩单补办
(办理原版一样)QUT毕业证昆士兰科技大学毕业证学位证留信学历认证成绩单补办(办理原版一样)QUT毕业证昆士兰科技大学毕业证学位证留信学历认证成绩单补办
(办理原版一样)QUT毕业证昆士兰科技大学毕业证学位证留信学历认证成绩单补办
 

US Business Cycle Timing

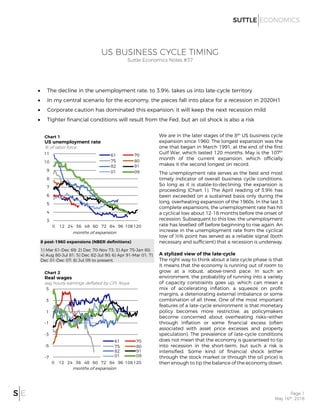
  • 1. Page 1 May 16th, 2018 US BUSINESS CYCLE TIMING Suttle Economics Notes #37 • The decline in the unemployment rate, to 3.9%, takes us into late-cycle territory • In my central scenario for the economy, the pieces fall into place for a recession in 2020H1 • Corporate caution has dominated this expansion; it will keep the next recession mild • Tighter financial conditions will result from the Fed, but an oil shock is also a risk 8 post-1960 expansions (NBER definitions) 1) Mar 61-Dec 69; 2) Dec 70-Nov 73; 3) Apr 75-Jan 80; 4) Aug 80-Jul 81; 5) Dec 82-Jul 90; 6) Apr 91-Mar 01; 7) Dec 01-Dec 07; 8) Jul 09 to present. We are in the later stages of the 8th US business cycle expansion since 1960. The longest expansion was the one that began in March 1991, at the end of the first Gulf War, which lasted 120 months. May is the 107th month of the current expansion, which officially makes it the second longest on record. The unemployment rate serves as the best and most timely indicator of overall business cycle conditions. So long as it is stable-to-declining, the expansion is proceeding (Chart 1). The April reading of 3.9% has been exceeded on a sustained basis only during the long, overheating expansion of the 1960s. In the last 3 complete expansions, the unemployment rate has hit a cyclical low about 12-18 months before the onset of recession. Subsequent to this low, the unemployment rate has levelled off before beginning to rise again. An increase in the unemployment rate from the cyclical low of ½% point has served as a reliable signal (both necessary and sufficient) that a recession is underway. A stylized view of the late-cycle The right way to think about a late cycle phase is that it means that the economy is running out of room to grow at a robust, above-trend pace. In such an environment, the probability of running into a variety of capacity constraints goes up, which can mean a mix of accelerating inflation, a squeeze on profit margins, a deteriorating external imbalance or some combination of all three. One of the most important features of a late-cycle environment is that monetary policy becomes more restrictive, as policymakers become concerned about overheating risks—either through inflation or some financial excess (often associated with asset price excesses and property speculation). The prevalence of late-cycle conditions does not mean that the economy is guaranteed to tip into recession in the short-term, but such a risk is intensified. Some kind of financial shock (either through the stock market or through the oil price) is then enough to tip the balance of the economy down. 3 4 5 6 7 8 9 10 11 0 12 24 36 48 60 72 84 96 108120 61 70 75 80 82 91 01 09 Chart 1 US unemployment rate % of labor force months of expansion -7 -5 -3 -1 1 3 5 0 12 24 36 48 60 72 84 96 108120 61 70 75 80 82 91 01 09 Chart 2 Real wages avg hourly earnings deflated by CPI; %oya months of expansion
  • 2. Page 2 May 16th, 2018 The late cycle phase of 2018-20 I see the current late-cycle phase playing out in the following way. This is my central forecast, with plenty of two-sided risk. Political considerations aside (a big uncertainty), I think we about two years away from the onset of the next recession (i.e. about mid-2020). I expect the unemployment rate to decline further through 2018, to a low below 3.5%. Growth should average about 3% over this period. Inflation (core PCE deflator) will drift up, to about 2.3%oya by 18Q4 and the Fed will tighten once a quarter. Growth will then slow through 2019 as fiscal stimulus fades; monetary policy is tightened; and corporates remain cautious. Inflation will edge up even as growth slows (in part, because of USD weakness). Inflation heading to 2.5%oya in 19Q4 will be enough to keep the Fed in action (another four hikes in 2019), even as growth slows. The Funds rate would end 2019 at 3.375%, and cumulative tightening from the low will have been 325bp. This compares to a cumulative 350bp (1994 to 2000) and 425bp (2004-06) in the last two tightening cycles. As has become usual, the Fed will stop tightening ahead of the onset of recession. It will likely do so as the unemployment rate begins to edge back up, having been stable at about 3.5% from 2018Q4 through 2019Q3. Fed tightening of this magnitude may be necessary for the onset of recession, but it may not be sufficient: the tipping factor will probably be a significant deterioration in financial conditions—most likely via the equity market. The rest of this note walks through the evolution of key economic variables through post-1960 cycles, lining up where we are now with past performance. Inflation accelerates more than real wages Central banks—the Fed included—seem to be adopting a view that any sign of inflation overheating will be evident in the labor market, in the form of rising wage inflation. It is hard to spot a consistent acceleration pattern in real wages in the later stages of business cycles, however (Chart 2). Note also that the performance of real wage growth through this expansion hardly stands out as weak (especially given that productivity growth has been so anemic). Real wage growth was weakest through the 1980s expansion, mainly because inflation was higher. Core CPI inflation does consistently accelerate late- cycle (and into the recession), often in a “hockey stick” fashion (Chart 3). Again, performance through the current expansion does not look unusually weak relative to past cycles (we seem to be tracking the Clinton expansion of the 1990s). The experience of the later 1960s is also worth bearing in mind, Expectations began to rise from 1966 on and this became a problem (there is a reason we cite Friedman AER 1968). Note that this was also the only 0 2 4 6 8 10 12 0 12 24 36 48 60 72 84 96 108120 61 70 75 80 82 91 01 09 Chart 3 Core CPI ex-food-and-energy; %oya months of expansion -7 -5 -3 -1 1 3 5 7 0 4 8 12 16 20 24 28 32 36 40 61Q1 70Q4 75Q1 80Q3 82Q4 91Q1 01Q4 09Q2 Chart 4 Corporate financing gap Non-financial sector; % of gross value added quarters of expansion -2.5 -2.0 -1.5 -1.0 -0.5 0.0 0.5 1.0 1.5 2.0 2.5 0 4 8 12 16 20 24 28 32 36 40 61Q1 70Q4 75Q1 80Q3 82Q4 91Q1 01Q4 09Q2 Chart 5 Business fixed investment % point contribution to GDP; last 4q quarters of expansion
  • 3. Page 3 May 16th, 2018 other time that we have experienced a significant peacetime fiscal expansion at full employment. Business sector caution in context While labor market signals point to late-cycle conditions, this is less the case for measures of corporate behavior. The creation of a significant financing gap—the difference between cash flow generated by operation and investment outlays—has always been a reliable precursor of a downturn, and we are currently some way from that (Chart 4). I would expect this financial position to deteriorate over the next few quarters. But even then, do not look for the emergence of a gap similar to those seen in the past— especially during the later 1990s. We will look back on this expansion as one when the corporate sector— scarred by near-death experiences in 2008-09—was ultra-cautious. Business investment has been very weak by historic standards (although is now picking up; Chart 5). Manufacturing capacity utilization has been running close to levels previously seen at the end of recessions (Chart 6). The upside of this excessive corporate caution is that the next recession is likely to be quite mild (as in 1990-91 and 2001). For all the talk of excessive debt creation through this expansion, corporate lenders have been very conservative and lending spreads have been consistently higher than in previous ones (a mixture of regulation and behavior). We are now close to the lows in corporate spreads for this cycle but are poised to move higher in coming quarters as the risks associated with Fed tightening become more of a focus (Chart 7). Assessing the impact of tighter financial conditions The main factors weakening demand growth through 2019 will be reduced fiscal thrust (fading demand impact from tax cuts) and tighter financial conditions. The personal sector saving rate is a channel through which the latter operates although, once again, the real move up tends to come through a recession (Chart 8; check out the end point of each expansion with the starting point of the subsequent expansion). The stance of monetary policy is the main driver of financial conditions. The level of the real Fed funds rate has been the most extreme outlier condition of this expansion to date (Chart 9). Negative real rates were a standard feature of expansions in the 1970s. The Volcker shock of 1980-81 opened the door to 20 years of significantly positive real rates. The past two expansions have seen a return to sustained negative real policy rates. With the exception of 1980, it is hard to spot the Fed as murderer of the expansion. As the expansion progresses, the Fed typically normalizes rates, with the most significant increases coming in waves from mid-cycle on (e.g. the long expansion of the 1990s). This time around, normalization has been 60 65 70 75 80 85 90 95 0 12 24 36 48 60 72 84 96 108120 61 70 75 80 82 91 01 09 Chart 6 Capacity utilization % of total months of expansion 0 50 100 150 200 250 300 350 400 0 12 24 36 48 60 72 84 96 108120 61 70 75 80 82 91 01 09 Chart 7 Corporate debt spreads bp; BAA over UST months of expansion 0 2 4 6 8 10 12 14 16 0 12 24 36 48 60 72 84 96 108120 61 70 75 80 82 91 01 09 Chart 8 Personal sector saving rate % disposable income months of expansion
  • 4. Page 4 May 16th, 2018 very delayed, with catch up now underway. This, combined with extreme corporate caution, explains why 325bp may be enough to create a recession. The slope of the yield curve is widely accepted to have useful cyclical properties. Two aspects stand out about the recent experience, however. First, the curve has been consistently steeper through this expansion than in all other post-1960 expansions (Chart 10). This has occurred despite QE. The unusual degree of curve steepness is, of course, the consequence of such a low Funds rate. Second, the most recent flattening fits with a late-cycle pattern. The curve typically reaches its flattest point about a year before the end of the expansion. On my analog that would be sometime in mid-2019. Equity prices will have a powerful influence on the saving rate. It is hard to spot a reliable pattern between dips in prices and subsequent cyclical developments, although real equity prices typically level off in the last 2 years of an expansion (Chart 11). Finally, oil prices have some very useful properties as recession signals. Spikes preceded recessions in 1974, 1979, 1999-00 and 2007 (Chart 12). This is a key risk of the President’s Iran policy. Philip Suttle phil@suttleeconomics.com 202-378-6793 Important Information While we make every effort to ensure that the analysis in this note is as accurate as possible, we do not guarantee that the information contained is either complete or correct. The material has been provided for informational and educational purposes only. The information is not intended to provide or constitute investment, accounting, tax or legal advice. -5 -3 -1 1 3 5 7 9 0 12 24 36 48 60 72 84 96 108120 61 70 75 80 82 91 01 09 Chart 9 Real Fed funds rate %; deflated by CPI months of expansion -150 -100 -50 0 50 100 150 200 250 300 0 12 24 36 48 60 72 84 96 108120 61 70 75 80 82 91 01 09 Chart 10 10s-2s UST slope bp; 61 & 70 are 10s-1s slope months of expansion 80 100 120 140 160 180 200 220 240 260 280 0 12 24 36 48 60 72 84 96 108120 61 70 75 80 82 91 01 09 Chart 11 Real equity prices Trough = 100 months of expansion 0 50 100 150 200 250 300 350 400 450 25 50 75 100 125 150 175 200 225 250 0 12 24 36 48 60 72 84 96 108120 61 70 75 80 82 91 09 01 (RHS) Chart 12 Real oil price WTI deflated by US CPI; Trough = 100 months of expansion