
Recommended
Recommended
More Related Content
What's hot
What's hot (20)
Similar to CXP initiation - Office REIT
Similar to CXP initiation - Office REIT (20)
More from Kevin Cheng, CFA
More from Kevin Cheng, CFA (13)
Recently uploaded
Recently uploaded (20)
CXP initiation - Office REIT
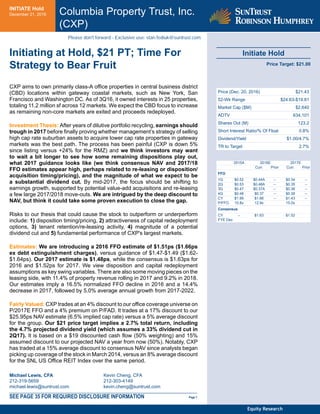
- 1. INITIATE Hold December 21, 2016 Columbia Property Trust, Inc. (CXP) Initiate Hold Price Target: $21.00 Price (Dec. 20, 2016) $21.43 52-Wk Range $24.63-$19.81 Market Cap ($M) $2,640 ADTV 634,101 Shares Out (M) 123.2 Short Interest Ratio/% Of Float 0.8% Dividend/Yield $1.00/4.7% TR to Target 2.7% 2015A 2016E 2017E Curr. Prior Curr. Prior FFO 1Q $0.52 $0.44A -- $0.34 -- 2Q $0.53 $0.48A -- $0.35 -- 3Q $0.47 $0.37A -- $0.36 -- 4Q $0.48 $0.37 -- $0.38 -- CY $1.99 $1.66 -- $1.43 -- P/FFO 10.8x 12.9x 15.0x Consensus CY -- $1.63 $1.52 FYE Dec Michael Lewis, CFA 212-319-5659 michael.lewis@suntrust.com Kevin Cheng, CFA 212-303-4149 kevin.cheng@suntrust.com Initiating at Hold, $21 PT; Time For Strategy to Bear Fruit CXP aims to own primarily class-A office properties in central business district (CBD) locations within gateway coastal markets, such as New York, San Francisco and Washington DC. As of 3Q16, it owned interests in 25 properties, totaling 11.2 million sf across 12 markets. We expect the CBD focus to increase as remaining non-core markets are exited and proceeds redeployed. Investment Thesis: After years of dilutive portfolio recycling, earnings should trough in 2017 before finally proving whether management’s strategy of selling high cap rate suburban assets to acquire lower cap rate properties in gateway markets was the best path. The process has been painful (CXP is down 5% since listing versus +24% for the RMZ) and we think investors may want to wait a bit longer to see how some remaining dispositions play out, what 2017 guidance looks like (we think consensus NAV and 2017/18 FFO estimates appear high, perhaps related to re-leasing or disposition/ acquisition timing/pricing), and the magnitude of what we expect to be a substantial dividend cut. By mid-2017, the focus should be shifting to earnings growth, supported by potential value-add acquisitions and re-leasing a few large 2017/2018 move-outs. We are intrigued by the deep discount to NAV, but think it could take some proven execution to close the gap. Risks to our thesis that could cause the stock to outperform or underperform include: 1) disposition timing/pricing, 2) attractiveness of capital redeployment options, 3) tenant retention/re-leasing activity, 4) magnitude of a potential dividend cut and 5) fundamental performance of CXP's largest markets. Estimates: We are introducing a 2016 FFO estimate of $1.51ps ($1.66ps ex debt extinguishment charges), versus guidance of $1.47-$1.49 ($1.62- $1.64ps). Our 2017 estimate is $1.48ps, while the consensus is $1.63ps for 2016 and $1.52ps for 2017. We view disposition and capital redeployment assumptions as key swing variables. There are also some moving pieces on the leasing side, with 11.4% of property revenue rolling in 2017 and 9.2% in 2018. Our estimates imply a 16.5% normalized FFO decline in 2016 and a 14.4% decrease in 2017, followed by 5.0% average annual growth from 2017-2022. Fairly Valued: CXP trades at an 4% discount to our office coverage universe on P/2017E FFO and a 4% premium on P/FAD. It trades at a 17% discount to our $25.95ps NAV estimate (6.5% implied cap rate) versus a 5% average discount for the group. Our $21 price target implies a 2.7% total return, including the 4.7% projected dividend yield (which assumes a 33% dividend cut in 2Q17). It is based on a $19 discounted cash flow (50% weighting) and 15% assumed discount to our projected NAV a year from now (50%). Notably, CXP has traded at a 15% average discount to consensus NAV since analysts began picking up coverage of the stock in March 2014, versus an 8% average discount for the SNL US Office REIT Index over the same period. SEE PAGE 35 FOR REQUIRED DISCLOSURE INFORMATION Page 1 Equity Research Please don't forward - Exclusive use: stan.fediuk@suntrust.com
- 3. Scenario Analysis Figure 1: CXP Scenario Analysis Source: Company documents; STRH Target Price Upside Target Price Target Price Downside $26 $21 $16 Probability Probability Probability 20% 60% 20% Bull Case STRH Case Bear Case Steady/lower interest rates and high investor demand drive cap rates 15% lower, improving disposition pricing and property values. CXP decides between more expensive acquisitions or repurchasing shares. Interest rates are range‐bound and cap rates stabilize near current levels. Targeted dispositions are essentially complete in 1H17 and attention turns to capital redeployment. Higher interest rates hurt disposition pricing and property values. Though acquisition pricing becomes more attractive, some potential sellers opt to take properties off the market. Disposition yields are better than expected, reducing dilution from remaining portfolio recycling. Assets designated for disposition sell at a roughly 8% average cap rate, a sizable spread over acquisition cap rates. Investor demand for non‐core assets softens. CXP continues with disposition plans, but at higher cap rates with greater earnings dilution. Strong tenant demand drives occupancy more than 100 bps higher in 2017 and concessions begin to recede. CXP achieves slightly higher 2017 occupancy and concessions remain relative steady. Amid weaker fundamentals, CXP is only able to hold occupancy steady in 2017. Another year of significant expirations in 2018 becomes a growing concern. Limited new office supply and healthy demand lead to better rent spreads than expected on new/renewal leases. Rent spreads on new/renewal leases are consistent with what was provided in CXP's September investor presentation. Leasing markets are more challenging than expected and lead to softer rent spreads and higher capex. Columbia Property Trust, Inc. Page 3 of 37
- 4. Company Profile Columbia Property Trust is a publicly‐traded (NYSE: CXP), fully‐integrated and self‐managed office REIT, headquartered in Atlanta, GA. The company was originally founded in 2004 as “Wells REIT II,” a public, non‐traded REIT which built a portfolio of high‐yield office properties to support its large dividend payout. CXP elected to publicly list its shares and it began trading on the NYSE on October 10, 2013. Notably, Piedmont Office Realty Trust (PDM, $20.49, Hold) was Wells REIT I before going public in 2010. CXP aims to own and operate primarily class‐A office properties in central business district (CBD) locations within gateway coastal markets, such as New York, Washington DC, and San Francisco. As of 9/30/16, CXP owned interests in 25 properties (24 wholly‐owned), encompassing 11.2 million square feet across 12 markets within 11 states. We expect the CBD focus (currently 71% of gross real estate assets) to increase as several remaining non‐core markets are exited and proceeds redeployed. Figure 2: Company Profile Source: Company documents; SNL Financial; Factset; STRH Figure 3: CXP Total Return vs. SNL US REIT Equity and SNL US REIT Office Source: Company documents; SNL Financial; Factset; STRH Institution Name Columbia Property Trust, Inc. Trading Symbol & Exchange CXP-US Exchange NYSE Industry Real Estate Property Type Office Address 1 One Glenlake Parkway City, State Atlanta, GA Zip Code 30328 Phone Number (404) 465-2200 State of Incorporation MD Web Address http://www.columbiapropertytrust.com Corporate Headquarters Company Description Chief Executive Officer E. Nelson Mills Chief Financial Officer James A. Fleming Chief Accounting Officer Wendy W. Gill Director of Investor Relations Matt Stover Chairman of the Board John L. Dixon Management Stock Price $21.43 Shares Outstanding 123,215 Market Cap ($MMs) $2,640.5 Dividend (annualized) $1.20 Dividend (yield) 5.6% STRH NAV/share (estimate) $25.95 Company Financial Overview ‐10% 0% 10% 20% 30% 40% 50% 60% 70% Oct‐13 Jan‐14 Apr‐14 Jul‐14 Oct‐14 Jan‐15 Apr‐15 Jul‐15 Oct‐15 Jan‐16 Apr‐16 Jul‐16 Oct‐16 CXP SNL U.S. REIT Equity SNL U.S. REIT Office Columbia Property Trust, Inc. Page 4 of 37
- 5. Investment Summary Strategy We believe management is essentially targeting some of the same competitive advantages that have benefited Boston Properties (BXP, $127.29, Hold), which has posted a 1,122% total return, versus 495% for the RMZ, since going public in 1997. Like BXP, the company is targeting a low‐levered balance sheet and a very high‐quality, CBD office portfolio in New York, San Francisco, Washington DC, and likely either Boston or Los Angeles. Notable differences include BXP’s large development pipeline and long successful track record. In that vein, CXP is nearing completion of a largely painful portfolio recycling plan to sell high cap rate suburban office properties and invest the proceeds into higher quality CBD assets in these target markets. Making this transition in the public market has been challenging for CXP, as the asset sales have been highly dilutive to earnings – though less impactful to NAV, which has been range‐bound. In retrospect, management has suggested two things it could have perhaps done differently. First, much of the portfolio transition might have been better made before going public. Second, the public listing did not dilute shareholders, but a traditional IPO may have provided a stronger initial institutional following (62% institutional ownership today), including sell‐side coverage that has been slow to develop. Ultimately, the stock has underperformed the RMZ by 29 percentage points since listing (October 2013) and it remains to be seen whether CXP’s shift in strategy can begin to match BXP’s past success. Neutral Investment Thesis Figure 4 below provides a snapshot of the mixed thesis supporting our Hold rating. CXP has upgraded its property portfolio significantly and earnings should trough in mid‐2017, before the benefits of this transition begin to be realized. Leases signed but not yet commenced should aid future growth, as should a positive in‐place rent mark‐to‐market. The balance sheet and liquidity position are healthy and the stock trades at a discount to its office peers, whether based on FFO/FAD multiples or NAV. There remain several dispositions to complete, which come with risks, though there should not be a shortage of capital redeployment options, which ideally would be acquisitions but could include stock repurchases. We are initiating with a Hold rating because, despite these positives, 1) there is uncertainty regarding the pricing/timing of dispositions and capital reinvestment, 2) we think Street NAV and 2017/18 FFO estimates appear optimistic, particularly in light of a few large likely tenant move‐outs (21% of lease revenue expiring in 2017‐2018), 3) the dividend is likely to be cut significantly in early 2017, in our view, and 4) we think investors will require some proof of execution/growth before the discount to NAV closes relative to many established peers also trading at discounts (for example, CXP trades at a 17% discount to NAV versus SLG, VNO and BXP at ‐22%, ‐15% and ‐11%, respectively). Figure 4: Investment Summary Source: STRH Investment Positives Keep an Eye On… Focus on high‐quality assets in gateway markets. Relatively high market/property concentration risk. Embedded growth from signed leases, plus positive rent spreads Large upcoming lease expirations carry a host of risks (re‐leasing timing/cost). High dividend yield (likely true even after a potential cut). A dividend cut appears likely (we are moding ‐33% in 2Q17). Strong balance sheet and liquidity. Rising interest rates could negatively impact dispositions/property valuations. Discounted relative valuation on P/FFO and P/NAV. Remaining dispositions are likely dilutive and subject to pricing/timing risk. Earnings set to trough in 2017, finally setting the stage for growth. Earnings still moving in the wrong direction for the next few quarters. Potential share repurchases at discount. Consensus NAV and 2017/2018 FFO estimates appear optimistic to us. Columbia Property Trust, Inc. Page 5 of 37
- 8. Portfolio Profile As of 9/30/16, CXP’s portfolio included 25 properties (including 1 hotel), totaling 11.2 million square feet across 13 markets in 12 states (including Washington DC). The company’s top three market exposures (by 3Q16 cash NOI) are San Francisco, New York, and Atlanta, which together account for roughly 57% of the portfolio. The top five markets (adding Houston and Cleveland) combined to account for 76% of 3Q16 cash NOI. The overall leased percentage is 90.7% versus 86.7% commenced occupancy and 84.2% economic occupancy, with a weighted average in‐place net rent of $29 psf and lease term of 6.6 years. Figure 5: Number of Properties Figure 6: Annual Lease Revenue per Square Foot ($) Note: Figure 5 and 6 include October sale of one property in Denver Source: Company documents; STRH Figure 7: Percentage Leased, Occupancy and Economic Occupancy Source: Company documents; STRH 61 43 43 38 37 36 39 39 29 28 27 27 24 0 10 20 30 40 50 60 70 3Q13 4Q13 1Q14 2Q14 3Q14 4Q14 1Q15 2Q15 3Q15 4Q15 1Q16 2Q16 3Q16 28 31 31 31 32 38 36 36 39 39 40 40 41 0 5 10 15 20 25 30 35 40 45 3Q13 4Q13 1Q14 2Q14 3Q14 4Q14 1Q15 2Q15 3Q15 4Q15 1Q16 2Q16 3Q16 82% 84% 86% 88% 90% 92% 94% 96% 3Q13 4Q13 1Q14 2Q14 3Q14 4Q14 1Q15 2Q15 3Q15 4Q15 1Q16 2Q16 3Q16 Leased Occupied Economic Occupancy Columbia Property Trust, Inc. Page 8 of 37
- 10. Figure 12: Top 10 Tenants (by % of ALR) Source: Company documents; SNL Financial; STRH Management suggested it is narrowing its geographic focus on the three core, high‐barrier markets of New York, San Francisco and Washington DC, plus either Boston or Los Angeles (probably not both). San Francisco, New York and Washington DC currently account for 63% of total square footage and 50% of cash NOI. Atlanta is the company’s third‐largest market, but management has suggested it will re‐ lease some upcoming rollover and ultimately trim its position there. We expect CXP to maintain some exposure to its home market going forward, but not as a primary holding. The company’s fourth‐largest market, Houston, is considered non‐core, although now may not be the most opportune time to sell. Over time, we believe the typical “high‐barrier” coastal markets tend to outperform national averages, supported by high investor demand, healthy job growth and relative supply constraints, all ultimately contributing to above‐average occupancy and rent growth. That said, there is certainly no guarantee this will be the case over any given time period. According to data from CBRE, over the past five years, the top four rent growth markets (out of 61 that the company tracks) were San Francisco, San Jose, Oakland and Boston. Los Angeles ranked 14th , New York 17th and Washington DC 54th . However, over the next five years, CBRE forecasts market rent growth in Los Angeles to rank 13th , New York 43rd , Washington DC 57th , Boston 58th and San Francisco 60th . Among these five markets, only Washington DC ranks in the top 20 for forecasted occupancy change over the next five years (although occupancy levels are relatively high to begin with). Better fundamentals in some of the markets CXP is selling could help with dispositions, but we think it is worth noting that CXP has been charging hard toward a strategy that is in no way guaranteed to generate superior returns (and it is also notable that much of BXP’s valuation creation has come via ground‐up development). Tenant Credit Rating ALR ($000s) % of ALR Leased sqft (000s) % of leased sqft 1 Wells Fargo Bank N.A. AA- $28,630 7.0% 697 7.0% 2 AT&T Corporation/AT&T Services BBB+ $22,278 5.5% 955 9.7% 3 Pershing LLC A+ $18,537 4.6% 471 4.8% 4 Credit Suisse A $16,082 4.0% 209 2.1% 5 Westinghouse Electric Company Not Rated $15,778 3.9% 824 8.3% 6 NYU AA- $14,802 3.6% 390 3.9% 7 Yahoo! BB+ $14,676 3.6% 193 2.0% 8 Keybank National Association A- $13,939 3.4% 478 4.8% 9 Foster Wheeler BBB- $12,646 3.1% 332 3.4% 10 Newell Rubbermaid, Inc. BBB- $9,128 2.2% 411 4.2% $166,496 40.9% 4,960 50.2%Total Columbia Property Trust, Inc. Page 10 of 37
- 11. Figure 13: Cumulative Office Job Growth since 4Q06 Source: CBRE; STRH Figure 14: Office Occupancy for CXP’s Top Markets Figure 15: Rental Rates for CXP’s Top Markets Source: CBRE; STRH ‐20% ‐10% 0% 10% 20% 30% 40% 50% 4Q 2006 4Q 2007 4Q 2008 4Q 2009 4Q 2010 4Q 2011 4Q 2012 4Q 2013 4Q 2014 4Q 2015 4Q 2016 4Q 2017 4Q 2018 4Q 2019 4Q 2020 4Q 2021 San Francisco New York Washington, DC US 75% 80% 85% 90% 95% 100% 1994 1996 1998 2000 2002 2004 2006 2008 2010 2012 2014 2016 2018 2020 San Francisco NY Washington, DC US $5 $15 $25 $35 $45 $55 $65 $75 1990 1992 1994 1996 1998 2000 2002 2004 2006 2008 2010 2012 2014 2016 2018 2020 San Francisco NY Washington, DC US Columbia Property Trust, Inc. Page 11 of 37
- 13. Leases representing approximately 21% of CXP’s total lease revenue (17% of leased square footage) are scheduled to expire in 2017‐2018 (see Figure 16). CXP has averaged cash/GAAP re‐leasing rent spreads of 11%/42% over the past 12 months and much of the 2017 rollover is in New York and San Francisco, where rent spreads should be strong. That said, we do expect a few notable move‐outs that will lead to downtime and capital expenditures. Notably, NYU (Langone Medical Center) signed a lease for 390,000 sf which commenced 11/1, bringing 222 East 41st Street to 100% occupancy though the lease comes with five quarters of free rent. NYU will occupy the previous Jones Day space, which agreed to an early termination agreement in 2Q16. Management suggested the net effective rent is similar to what Jones Day was paying. We are modeling $80 million of related capital expenditures in 4Q16. Separately, management has already re‐leased some of the space Credit Suisse is leaving at 315 Park Avenue in April, leaving about 100,000 sf to backfill. We are also modeling AMEC Foster Wheeler’s move‐out of the 332,000 sf 1 Energy Center in Houston in mid‐2018, which is large enough to have a meaningful negative impact on CXP’s total occupancy until that asset is addressed. Figure 17: Lease Expirations Through 2018 (as of 2Q16) Source: Company documents; STRH Market Tenant Property San Francisco GoodbySilverstein & Partners Inc. 650 California 52 DLA Piper University Circle 119 Other 243 New York Credit Suisse 315 Park Avenue South 170 MongoDB 229 W. 43rd Street 50 Other 89 D.C. United Healthcare Services Market Square 40 BAE Systems 80 M Street 80 Other 57 Houston McKinsey & Company 5 Houston Center 35 AMEC Foster Wheeler 1 Energy Center 332 Other 125 Other Markets 80 $43psf -4% Total 1,472 34% 15% -9% -4% RSF (000s) Avg. In-place rent per market Avg. (gross) mark-to- $66psf $71psf $63psf $40psf Columbia Property Trust, Inc. Page 13 of 37
- 16. Earnings and NAV Estimates Funds From Operations: Our 2016 FFO estimate is $1.51 per share, or $1.66ps on a normalized basis (excluding early debt retirement charges) – above management’s $1.47‐$1.49ps guidance (1.62‐ $1.64ps ex charges) and the $1.63ps consensus. We think the main reason our estimate is higher is because of very late disposition timing during 4Q16. Conversely, our 2017 FFO estimate of $1.42ps is well below the $1.52ps consensus. This difference could be due to acquisition/disposition assumptions or assumptions for the Credit Suisse roll at 315 Park Avenue (we assume downtime for the rest of the year). FFO has fallen every year since the stock listed, from $2.08ps in 2013 to $2.00ps in 2015 and only an estimated $1.51ps in 2016 and $1.42ps in 2017. We expect growth to begin recovering in 2018, though our $1.51ps FFO estimate is also well below the $1.66ps consensus. The pricing/timing of dispositions and capital redeployment are impactful variables and we wonder what others are assuming for the significant tenant expirations over the next two years. At the very least, we think it’s prudent to assume that AMEC Foster Wheeler (332K) and McKinsey & Company (35K) will move out of their existing properties (1 Energy Center and 5 Houston Center, respectively) upon their 2018 expirations, which will weigh on internal growth. Figure 19: CXP normalized FFOps Source: Company documents; SNL Financial; STRH Our 2016 estimate implies a 16.5% YOY normalized FFO decrease, largely driven by $1 billion of dispositions, and our 2017 estimate implies a 14.4% YOY decline, bearing the full‐year impact of 2017 dispositions only partially offset by lower cap rate acquisition activity and leasing activity. We project 5.4% average annual normalized FFOps growth from 2017‐2021, which ranks fourth out of the 14 companies in our office coverage universe. $1.99 $1.66 $1.43 $1.51 $1.55 $1.69 $1.76 $1.82 -20% -15% -10% -5% 0% 5% 10% 15% $0.00 $0.50 $1.00 $1.50 $2.00 $2.50 2015 2016E 2017E 2018E 2019E 2020E 2021E 2022E Normalized FFO per share FFO Growth (RHS: Y/Y % chg) Columbia Property Trust, Inc. Page 16 of 37
- 18. Figure 21: CXP Income Statement ($ thousands) Source: Company documents; STRH Columbia Property Trust (CXP) SunTrust Robinson Humprey 2015 1Q16 2Q16 3Q16 4Q16E 2016E 2017E 2018E 2019E 2020E 2021E 2022E Revenues Rental 436,048 99,586 93,567 87,561 86,844 367,558 353,244 351,530 348,807 361,079 366,302 371,434 Tenant reimbursements and other 99,655 19,753 18,709 17,090 16,902 72,454 68,192 67,775 67,024 69,056 70,055 71,037 Expansion portfolio 0 (2,132) (2,132) (34,026) (10,221) 12,190 29,424 40,437 47,510 Hotel Income 24,309 4,663 6,551 6,270 5,519 23,003 23,839 24,315 24,802 25,298 25,804 26,320 Other Income 1,816 1,009 919 827 800 3,555 3,325 3,392 3,460 3,530 3,601 3,674 Termination Income 4,237 1,568 8,185 1,518 1,000 12,271 4,000 4,000 4,000 4,000 4,000 4,000 Total revenue 566,065 126,579 127,931 113,266 108,933 476,709 418,573 440,791 460,283 492,387 510,199 523,974 Property operating revenue 566,065 126,579 127,931 113,266 108,933 476,709 418,573 440,791 460,283 492,387 510,199 523,974 Expenses Property operating 188,078 41,336 40,242 39,101 37,560 158,239 151,537 150,611 148,942 153,458 155,678 157,859 Hotel operating costs 19,615 4,331 5,038 4,946 4,622 18,937 19,555 20,014 20,458 20,855 21,272 21,698 Expansion portfolio 0 (746) (746) (11,909) (3,577) 4,266 10,298 14,153 16,628 General and administrative 29,683 10,490 7,761 7,467 8,224 33,942 31,890 33,054 34,038 35,804 36,719 37,324 Acquisition costs 3,675 0 0 0 0 0 0 0 0 0 0 0 Depreciation and amortization 218,618 45,364 43,382 38,673 38,673 166,092 154,692 154,692 154,692 154,692 154,692 154,692 Depreciation and amortization - expansion portfolio 0 (8,277) (8,277) (17,523) (1,936) 9,066 16,034 21,902 24,102 Impairment of real estate assets 0 0 0 0 0 0 0 0 0 0 0 0 Asset and property management fees 1,816 330 341 387 380 1,438 1,530 1,545 1,560 1,576 1,592 1,608 Total expenses 461,485 101,851 96,764 90,574 80,436 369,625 329,771 354,402 373,022 392,718 406,008 413,912 Property operating expenses 209,509 45,997 45,621 44,434 41,816 177,868 160,712 168,592 175,227 186,188 192,695 197,793 Pro Rata NOI based on GAAP rents 83,669 84,548 71,151 68,808 308,176 255,761 278,714 299,708 327,397 342,840 354,285 Net Operating Income 356,556 80,582 82,310 68,832 67,117 298,841 257,861 272,199 285,056 306,199 317,503 326,180 Operating income 104,580 24,728 31,167 22,692 28,497 107,084 88,802 86,389 87,261 99,669 104,191 110,062 Other expenses, net Interest expense (78,096) (16,097) (15,580) (15,338) (13,596) (60,611) (51,504) (55,039) (61,823) (64,106) (66,191) (67,085) Interest income 54 5 8 39 25 77 100 100 100 100 100 100 Capital lease obligation interst expense (7,200) (1,800) (1,800) (1,800) (1,800) (7,200) (7,200) (7,200) (7,200) (7,200) (7,200) (7,200) Development authority bond income 7,200 1,800 1,800 1,800 1,800 7,200 7,200 7,200 7,200 7,200 7,200 7,200 Gain/Loss on early debt extinguishment (3,149) 0 (92) (18,905) 0 (18,997) 0 0 0 0 0 0 Total other expense (income) (82,301) (16,092) (15,664) (34,204) (13,571) (79,531) (51,404) (54,939) (61,723) (64,006) (66,091) (66,985) Loss on debt extinguishment / modification 0 0 0 0 0 0 0 0 0 0 0 0 Income from continuing operations before income taxes 22,279 8,636 15,503 (11,512) 14,925 27,552 37,398 31,450 25,538 35,663 38,099 43,077 Benefit from income taxes (378) (77) (245) (65) (75) (462) (300) (300) (300) (300) (300) (300) Income from continuing operations 21,901 8,559 15,258 (11,577) 14,850 27,090 37,098 31,150 25,238 35,363 37,799 42,777 Gain on sale of real estate property 23,860 (310) (19) 50,412 0 50,083 0 0 0 0 0 0 Income/(loss) from discontinued operations 23,860 (310) (19) 50,412 0 50,083 0 0 0 0 0 0 Net income (loss) 45,761 8,249 15,239 38,835 14,850 77,173 37,098 31,150 25,238 35,363 37,799 42,777 Less - Net gain/loss from unconsolidated JV (1,142) (1,552) (1,953) (1,937) (1,808) (7,250) (7,172) (6,890) (6,598) (6,084) (5,801) (5,509) Net (loss) income attributable to equity holder 44,619 6,697 13,286 36,898 13,043 69,924 29,926 24,260 18,640 29,280 31,998 37,268 Less - Dividends on preferred shares 0 0 0 0 0 0 0 0 0 0 0 0 Net income attributable to common shareholders 44,619 6,697 13,286 36,898 13,043 69,924 29,926 24,260 18,640 29,280 31,998 37,268 FFO Depreciation of real estate assets 131,490 29,289 28,450 26,778 19,705 104,222 91,025 101,404 108,702 113,324 117,218 118,679 Amortization of lease-related costs 87,128 16,075 14,932 11,895 10,691 53,593 46,144 51,351 55,056 57,402 59,375 60,115 Unconsolidated joint ventures (Depreciation) 1,606 2,470 2,077 2,123 2,123 8,793 8,492 8,492 8,492 8,492 8,492 8,492 Loss on sale of real estate property (disc. Ops) 0 0 0 0 0 0 0 0 0 0 0 0 Impairment of real estate assets 0 0 0 0 0 0 0 0 0 0 0 0 Gain on sale of real estate property (23,860) 310 19 (50,412) 0 (50,083) 0 0 0 0 0 0 Net loss attributable to noncontrolling interests in the Operatin 0 0 0 0 0 0 0 0 0 0 0 0 Diluted FFO 240,983 54,841 58,764 27,282 45,561 186,448 175,587 185,508 190,890 208,498 217,084 224,554 Loss on debt extinguishment 3,149 0 92 18,905 0 18,997 0 0 0 0 0 0 Deferred abatement and straight-line amortization 0 0 0 0 0 0 0 0 0 0 0 0 Acquisition costs 3,675 0 0 0 0 0 0 0 0 0 0 0 Contingent consideration related to acquisition of property 0 0 0 0 0 0 0 0 0 0 0 0 Development and redevelopment costs 0 0 0 0 0 0 0 0 0 0 0 0 Settlement swap costs 1,102 0 0 0 0 0 0 0 0 0 0 0 Shelf registration costs 0 0 0 0 0 0 0 0 0 0 0 0 One-time legal costs 0 0 0 0 0 0 0 0 0 0 0 0 Change in tax regulations 0 0 0 0 0 0 0 0 0 0 0 0 Core Funds From Operations 248,909 54,841 58,856 46,187 45,561 205,445 175,587 185,508 190,890 208,498 217,084 224,554 Topic D-42 Charges 0 0 0 0 0 0 0 0 0 0 0 Early Retirement of Debt 3,149 0 92 18,905 0 18,997 0 0 0 0 0 0 Acquisition costs 3,675 0 0 0 0 0 0 0 0 0 0 0 Impairment Losses / Gains on Real Estate Other non recurring/ M2M gains/losses 1,102 0 0 0 0 0 0 0 0 0 0 0 FFO - Normalized 248,909 54,841 58,856 46,187 45,561 205,445 175,587 185,508 190,890 208,498 217,084 224,554 Building capital (9,018) (718) (844) (429) (1,658) (3,649) (6,753) (7,222) (7,672) (8,254) (8,460) (8,590) Other leasing costs (2,933) 271 (1,120) (1,217) (1,000) (3,066) (4,000) (4,000) (4,000) (4,000) (4,000) (4,000) Adjusted Funds From Operations 89,529 46,466 41,023 30,289 (47,841) 69,937 89,657 130,365 148,210 147,066 127,133 175,864 0 0 0 Non-cash interest expense 2,349 1,012 915 837 825 3,589 3,300 3,300 3,300 3,300 3,300 3,300 Straight-line rent, net (17,816) (5,872) (3,764) (5,525) (5,125) (20,286) (20,375) (19,000) (19,000) (19,000) (19,000) (19,000) Net effect of above/below lease market amortization (9,199) (1,417) (1,709) (731) (800) (4,657) (3,200) (3,200) (3,200) (3,200) (3,200) (3,200) Straight-line receivable write off in G&A 174 160 79 233 200 672 800 800 800 800 800 800 Debt fair value amortization 0 0 0 0 0 0 0 0 0 0 0 0 Amortization of discounts 0 0 0 0 0 0 0 0 0 0 0 0 Gain on interest rate swaps 0 0 0 0 0 0 0 0 0 0 0 0 Tenant improvements (36,017) (2,798) (2,551) (7,810) (80,000) (93,159) (24,202) (13,282) (15,504) (34,004) (58,765) (32,009) Leasing commissions (9,829) (426) (10,060) (2,181) (4,080) (16,747) (14,287) (7,239) (6,776) (14,806) (24,346) (13,126) Building capital (9,018) (718) (844) (429) (1,658) (3,649) (6,753) (7,222) (7,672) (8,254) (8,460) (8,590) Other leasing costs (2,933) 271 (1,120) (1,217) (1,000) (3,066) (4,000) (4,000) (4,000) (4,000) (4,000) (4,000) Diluted FAD 166,620 45,053 39,802 29,364 (46,076) 68,143 106,870 135,666 138,838 129,334 103,413 148,728 FFO per Share - "NAREIT" $1.93 $0.44 $0.48 $0.22 $0.37 $1.51 $1.43 $1.51 $1.55 $1.69 $1.76 $1.82 Normalized FFO per share as reported by CXP $1.99 $0.44 $0.48 $0.37 $0.37 $1.66 $1.43 $1.51 $1.55 $1.69 $1.76 $1.82 Normalized FFO per share $1.99 $0.44 $0.48 $0.37 $0.37 $1.66 $1.43 $1.51 $1.55 $1.69 $1.76 $1.82 AFFO per share as calculated by CXP $0.72 $0.38 $0.33 $0.25 ($0.39) $0.57 $0.73 $1.06 $1.20 $1.19 $1.03 $1.43 Diluted FAD per share $1.33 $0.37 $0.32 $0.24 ($0.37) $0.55 $0.87 $1.10 $1.13 $1.05 $0.84 $1.21 DIV per Share $1.20 $0.30 $0.30 $0.30 $0.30 $1.20 $0.90 $0.80 $0.80 $0.80 $0.80 $0.80 Columbia Property Trust, Inc. Page 18 of 37
- 20. Figure 22: CXP Net Asset Value ($ thousands) Source: Company documents; STRH Columbia Property Trust (CXP) SunTrust Robinson Humprey Net Asset Value in $ thousands 3Q16 NAV per Share $25.95 Forward Twelve-Month NOI $277,855 Less: Straight-line rent (22,900) Less: 10% of G&A (3,210) Vacancy Value 15,344 Plus: Inter-Period Investment Activity Forward Twelve-Month Cash NOI $267,089 Nominal Cap Rate 5.85% Real Estate Value $4,565,631 Unconsolidated JV NOI $9,746 Nominal Cap Rate 4.00% Unconsolidated Real Estate Value $243,652 Management & Other Fee Income $0 Cap Rate 10.00% Value of Management Income $0 Book Value of Construction in Progress $28,888 Present Value of Development Value Creation 0 Book Value of Land Holdings 0 Value of Development Pipeline $28,888 Cash & Cash Equivalents $190,856 Accounts Receivable & Other $25,030 Other Tangible Assets $120,000 Other Assets/Liabilities Non-Income Producing Assets Vacancy Value normalization factor (87,430) Accounts Payable (201,617) Dividends Payable 0 Other Liabilities Other Assets/Liabilities $46,839 Gross Asset Value $4,885,010 Senior Notes $689,357 Tem Loans $450,000 Line of Credit $99,000 Mortgage Notes Payable $275,992 Unconsolidated JV Debt 169,808 Mark-to-Market Debt Adjustment 3,063 Perpetual Preferred Stock 0 Long Term Debt/Preferred $1,687,220 Net Asset Value $3,197,790 Shares Outstanding 123,215 Units Outstanding Options Fully Diluted Shares & Units Outstanding 123,215 Net Asset Value / Share $25.95 Current Stock Price $21.43 Premium / Discount to NAV -17.4% Implied Cap Rate 6.51% Applied Value / Sq. Ft. $433 Implied Value / Sq. Ft. $380 Columbia Property Trust, Inc. Page 20 of 37
- 22. Figure 25: CXP Debt Maturity Schedule ($ millions) Source: Company documents; STRH Columbia Property Trust, Inc. Page 22 of 37
- 23. Figure 26: CXP Balance Sheet ($ thousands) Source: Company documents; SNL Financial; STRH Columbia Property Trust (CXP) SunTrust Robinson Humprey 2015 1Q16 2Q16 3Q16 4Q16E 2016E 2017E 2018E 2019E 2020E 2021E 2022E BALANCE SHEET ASSETS Rental property, net 3,156,567 3,035,981 3,021,755 2,814,349 2,392,304 2,392,304 2,659,338 2,799,864 2,851,610 2,814,888 2,797,059 2,650,274 Land 896,467 864,495 844,495 787,456 787,456 787,456 787,456 787,456 787,456 787,456 787,456 787,456 Construction in progress 31,847 11,223 14,176 28,888 28,888 28,888 28,888 28,888 28,888 28,888 28,888 28,888 Other assets held-for-sale, net 0 0 10 32,306 32,306 32,306 32,306 32,306 32,306 32,306 32,306 32,306 Cash and cash equivalents 32,645 185,376 23,803 190,856 431,466 431,466 47,443 59,535 42,881 23,643 28,484 53,640 Tenant receivables, net 6,366 6,366 6,366 6,366 6,366 6,366 6,366 6,366 6,366 Prepaid expenses and other assets 47,518 47,510 46,440 24,885 24,885 24,885 24,885 24,885 24,885 24,885 24,885 24,885 Accrued straight-line rents 109,062 103,367 113,921 70,186 70,186 70,186 70,186 70,186 70,186 70,186 70,186 70,186 Notes receivable, net 0 0 0 0 0 0 0 0 0 0 0 0 Investment in development bonds 120,000 120,000 120,000 120,000 120,000 120,000 120,000 120,000 120,000 120,000 120,000 120,000 Investment in unconsolidated JV 118,695 121,784 123,919 125,605 125,605 125,605 125,605 125,605 125,605 125,605 125,605 125,605 Deferred financing costs 0 0 0 0 0 0 0 0 0 0 0 0 Deferred costs, net 88,127 74,502 87,182 60,383 60,383 60,383 60,383 60,383 60,383 60,383 60,383 60,383 Intangible lease costs, net 77,190 70,560 65,775 58,645 58,645 58,645 58,645 58,645 58,645 58,645 58,645 58,645 Total assets 4,678,118 4,634,798 4,461,476 4,319,925 4,138,490 4,138,490 4,021,500 4,174,119 4,209,211 4,153,251 4,140,263 4,018,634 Liabilities Mortgage Notes 438,063 464,722 277,365 275,992 226,992 226,992 226,992 226,992 300,072 300,072 300,072 300,072 Senior Notes 590,767 591,465 592,144 689,357 689,357 689,357 689,357 689,357 689,357 689,357 689,357 689,357 Other Debt - 1 1 1 1 1 1 1 1 Unsecured term loan 450,000 450,000 450,000 450,000 450,000 450,000 450,000 450,000 450,000 450,000 450,000 450,000 Unsecured revolving credit facility 247,000 294,000 333,000 99,000 1 1 1 255,000 325,000 375,000 475,000 450,000 Liabilities held-for-sale - 0 132 15,644 15,644 15,644 15,644 15,644 15,644 15,644 15,644 15,644 Accounts payable and other liabilities 98,759 85,351 86,010 81,617 81,617 81617 81617 81617 81617 81617 81617 81617 Distributions payable and deferred income 37,354 0 0 0 0 0 0 0 0 0 0 0 Obligations under capital leases 120,000 120,000 120,000 120,000 120,000 120000 120000 120000 120000 120000 120000 120000 Deferred income 24,814 21,886 23,793 20,411 20,411 20,411 20,411 20,411 20,411 20,411 20,411 20,411 Intangible lease liabilities, net 57,167 53,154 49,396 36,239 36,239 36239 36239 36239 36239 36239 36239 36239 Total liabilities 2,063,924 2,080,578 1,931,840 1,788,260 1,640,262 1,640,262 1,640,262 1,895,261 2,038,341 2,088,341 2,188,341 2,163,341 Noncontrolling interests in the Operating Partnership 0 0 0 0 0 0 0 0 0 0 0 Equity Series A Preferred Shares 0 0 0 0 0 0 0 0 0 Common stock 1,243 1,234 1,234 1,234 Additional paid-in capital 4,588,303 4,563,537 4,564,729 4,565,651 Noncontrolling interests in consolidated partnerships 0 Accumulated other comprehensive loss -2,436 (7,293) (9,315) (8,065) Dividends in excess of accumulated earnings -1,972,916 (2,003,258) (2,027,012) (2,027,155) Total equity 2,614,194 2,554,220 2,529,636 2,531,665 2,498,228 2,498,228 2,381,238 2,278,858 2,170,870 2,064,910 1,951,922 1,855,293 Total liabilities, noncontrolling interests and equity 4,678,118 4,634,798 4,461,476 4,319,925 4,138,490 4,138,490 4,021,500 4,174,119 4,209,211 4,153,251 4,140,263 4,018,634 Columbia Property Trust, Inc. Page 23 of 37
- 24. Dividend CXP’s next quarterly dividend of $0.30 per share will be paid on 1/5/17 to shareholders of record as of 12/1/16. The annualized payout of $1.20ps implies a yield of 5.6%, the highest in our 14‐company office coverage universe, but would be 38% above our 2017 FAD estimate. Management has said that the Board will revisit the current dividend policy in 2017, with the view that a decision should be made with a long‐term objective in mind. We think it is highly likely that the dividend will be cut in early 2017. We are modeling a 33% cut to an annualized rate of $0.80ps beginning in 2Q17 (reflected in Figure 28; implied 4.7% dividend yield), although even that could be high, as we estimate it implies an average FAD coverage ratio of 1.2x through 2021. Figure 27: Estimated CXP Dividend Yield vs. Office REITs Note: STRH estimated dividend yield shown Source: FactSet; Company documents; STRH; We do not model any dividend increases, after the assumed 2Q17 cut, in the remaining five years of our model. Assuming the 2Q17 dividend cut in our model is accurate, CXP’s dividend yield would rank 12th highest out of the 14 companies in our office coverage universe, and has a four‐year (2017‐2021) FFO growth of 4th. 2.1% 2.3% 2.4% 2.6% 3.3% 3.3% 3.5% 3.7% 3.8% 4.0% 4.1% 4.7% 4.9% 5.0% 0% 1% 2% 3% 4% 5% 6% CLI BXP VNO SLG CUZ Average OFC WRE FPO BDN PDM CXP DEA HIW Columbia Property Trust, Inc. Page 24 of 37
- 27. Wendy Gill – Senior Vice President (Corporate Operations) and Chief Accounting Officer Wendy Gill has been the company’s Chief Accounting Officer since 2007 and served as interim Principal Financial Officer in early 2013. She served as Director of Financial Reporting for Wells Real Estate Funds for five years, and previously worked for Arthur Andersen, primarily in the real estate and financial services industries. Ms. Gill received a B.S. in Accounting from the University of Delaware and holds a Certified Public Accountant designation from the Maryland State Board of Public Accountancy. Kevin Hoover – Senior Vice President (Portfolio Management) Kevin Hoover is Senior Vice President – Portfolio Management and has worked in various capacities at Columbia since 2004. He previously served as the co‐head of Asset Management for Wells Real Estate Funds and as Portfolio Manager for several of its sponsored real estate products. Prior to that, he served as a Principal for Lend Lease Real Estate Investments and as a Manager for Price Waterhouse in the Real Estate Valuations Practice. Mr. Hoover received a B.B.A. in Real Estate from the University of Georgia and is a member of the Urban Land Institute, the National Association of Office and Industrial Properties, the National Association of Real Estate Investment Managers, the Appraisal Institute, and the Certified Commercial Investment Member Institute. Adam I. Popper – Senior Vice President (Eastern Region) Adam I. Popper joined the company in 2016 as Senior Vice President – Eastern Region. Mr. Popper primarily focuses on assets and opportunities in the key markets of New York City, Washington, and Boston and serves on Columbia’s Investment Committee. Previously, he was a managing principal and member of the investment committee at Westbrook Partners. Prior to that, Mr. Popper served as a senior vice president and director of acquisitions for Vornado Realty Trust. Prior to that, Mr. Popper served as a managing director of Beacon Capital Partners, and as a senior director of Tishman Speyer Properties where he oversaw the Company’s acquisition efforts. He received a Bachelor's degree in Political Science from Hamilton College and is a member of Urban Land Institute and the International Council of Shopping Centers. In addition to the corporate officers named above, CXP has 11 directors, eight vice presidents and one senior analyst across its various finance, operations and other corporate departments. Figure 29: Columbia’s Board of Directors Source: Company documents; SNL Financial; STRH Name Position Age Director Since Independent E. Nelson Mills President, Chief Executive Officer and Director 55 2007 ‐ John L. Dixon Chairman of the Board and Director 73 2012 Yes Carmen M. Bowser Director 61 2016 Yes Charles R. Brown Director 77 2003 Yes Richard W. Carpenter Director 79 2003 Yes David B. Henry Director 67 2016 Yes Murray J. McCabe Director 48 2013 Yes Michael S. Robb Director 68 2015 Yes George W. Sands Director 70 2010 Yes Thomas G. Wattles Director 64 2013 Yes Average Age 66 Columbia Property Trust, Inc. Page 27 of 37
- 28. Management Compensation CXP’s compensation committee, consisting of Mr. McCabe (Chairman), Mr. Carpenter, Mr. Dixon and Mr. Robb, held seven meetings in 2015. The committee strives for a balanced compensation mix, performance‐based short‐term cash incentive awards, largely performance‐based equity awards, aligning the long‐term focus with shareholder interests, a claw‐back provision (three years), stock ownership guidelines, annual say on pay vote (96% approval on last vote), award caps, prohibition of hedges and pledging of company stock, no perquisites, independent compensation consultant, compensation risk analysis, no tax gross‐ups and double trigger change in control severance. Figure 30: Columbia’s 2015 Named Executive Compensation Note 1: Includes matching 401K plans and life insurance Note 2: SVP – Eastern Region, Adam Popper, joined CXP in 2016 and therefore is not listed above. Source: Company documents, STRH, SNL Financial, as of 2015 Proxy The CEO consults with the compensation committee regarding pay for each of the named executive officers, other than himself. The committee considers this input, along with that provided by its advisors, but maintains full discretion to set all executive officer compensation. No specific targets relative to the company’s peer group (provided by an independent compensation consultant; see Figure 31) are considered, except that the committee ensures overall compensation does not exceed the median of this group, unless CXP produces “strong performance.” Figure 31: Columbia’s Selected Peer Group Source: Company documents, STRH, as of 2015 Proxy There are three primary factors in determining short term incentive compensation: 1) corporate performance metrics; 2) business performance metrics; (applicable to only Mrs. Gill and Mr. Hoover) and 3) individual performance metrics. A brief overview of the corporate performance metrics are provided in Figure 32. Figure 32: Columbia’s 2015 Corporate Performance Metrics Note 1: NAREIT FFO definition Source: Company documents, STRH, SNL Financial, as of 2015 Proxy Name Salary Bonus Stock Awards (LTIP) Non-Equity Incentive Plan Other 1 Total E. Nelson Mills $750,000 $0 $2,025,000 $922,500 $24,288 $3,721,788 James A. Fleming $460,000 $0 $712,500 $509,220 $1,205 $1,682,925 Wendy W. Gill $325,000 $0 $225,000 $261,092 $18,288 $829,380 Kevin A. Hoover $375,000 $0 $250,000 $362,846 $24,288 $1,012,134 BioMed Realty Trust, Inc. Highwoods Properties, Inc. Brandywine Realty Trust Kilroy Realty Corporation Corporate Office Properties Trust Liberty Property Trust Cousins Properties Incorporated Mack-Cali Realty Corporation Douglas Emmett, Inc. Piedmont Office Realty Trust, Inc. Duke Realty Corporation Washington Real Estate Investment Trust Metric Weight Threshold Target Maximum Actual Normalized FFO per share(1) 30% $1.85 $1.91 $1.97 $1.99 Accomplish Primary Business Plan Objectives 30% Subjective Subjective Subjective Subjective Same Store NOI Cash 25% $310.5M $320.1M $329.7M $320.5.5M Portfolio G&A Expense 15% $33M $32M $31.0M $29.7M Columbia Property Trust, Inc. Page 28 of 37
- 30. Figure 34: Columbia Direct Insider Ownership Source: STRH, Bloomberg, Share positions as of 12/20/2016, Market value as of 12/20/2016 Name Position Market Value ($) Shares Out (%) Mills, E Nelson 186,888 $4,005,010 0.15% Fleming, James A 68,609 $1,470,291 0.06% Hoover, Kevin A 26,272 $563,009 0.02% Dixon, John L 24,892 $533,436 0.02% Gill, Wendy W 23,499 $503,584 0.02% Carpenter, Richard W 12,813 $274,583 0.01% McCabe, Murray Jerome 12,271 $262,968 0.01% Wattles, Thomas G 11,981 $256,753 0.01% Brown, Charles R 8,839 $189,420 0.01% Sands George W 8,563 $183,505 0.01% Columbia Property Trust, Inc. Page 30 of 37
- 31. Valuation CXP trades at 15.0x normalized 2017E FFO, which is a 4% discount to our office coverage universe simple average of 15.7x. It trades at 24.7x 2017E FAD, a 4% premium to the 23.7x average for the group. We think these multiples seem fair on a relative basis, given the roughly average projected growth and financial leverage. The stock trades at a 17% discount to our $25.95ps NAV estimate, versus a 5% average discount for our office coverage universe. The stock has traded at a 15% average discount to NAV during its public market history, versus an 8% average discount for the SNL US Office REIT Index over the same period. Figure 35: Historical P/FFO Multiples Figure 36: Historical P/NAV Source: Factset; SNL Financial; STRH; Consensus FFO/NAV estimates shown Figure 37: Price/2017E Norm. FFO Comparison Figure 38: Price/2017E FAD Comparison Source: Factset; SNL Financial; STRH 12 13 14 15 4Q13 2Q14 4Q14 2Q15 4Q15 2Q16 Current CXP P/FFO CXP Average -30% -25% -20% -15% -10% -5% 0% Mar-15 Jun-15 Sep-15 Dec-15 Mar-16 Jun-16 Sep-16 Dec-16 CXP P/NAV Average 11.4 12.3 12.3 12.7 14.9 14.9 14.9 15.0 15.4 16.9 17.9 19.6 20.3 21.0 0 5 10 15 20 25 BDN FPO PDM CLI CUZ OFC HIW CXP DEA SLG WRE VNO NYRT BXP 14.5 15.9 16.3 17.7 17.9 21.0 21.2 23.4 24.7 27.3 28.2 29.5 35.1 38.9 0 5 10 15 20 25 30 35 40 45 PDM FPO BDN OFC DEA WRE HIW CUZ CXP NYRT SLG BXP VNO CLI Columbia Property Trust, Inc. Page 31 of 37
- 32. Figure 39: NAV Premium/(Discount) Comparison1 Figure 40: Implied Cap Rate Comparison Note 1: NAV as of 3Q/16; CUZ cap rate reflects 3Q/17E Source: Factset; SNL Financial; STRH We expect CXP’s 2017‐2021 annual FFOps growth to rank 4th out of the 14 office REITs we cover, while its P/2017E FFO multiple is the 8th lowest. In comparison, we expect CXP’s FAD growth to be ‐0.8% from 2017‐2021, which ranks last in our coverage universe and has the 9th lowest FAD multiple. Having said that, we consider Columbia to be fairly valued, given its growth prospects coupled with its above average financial leverage. An improved growth outlook or relative dip in the stock price could lead us to become more positive on the shares. Figure 41: P/2017 FFO vs ’17‐’21 FFO Growth Source: Factset; SNL Financial; STRH ‐22% ‐17% ‐15% ‐13% ‐11% ‐10% ‐9% ‐3% ‐3% 1% 2% 4% 6% 18% ‐25% ‐20% ‐15% ‐10% ‐5% 0% 5% 10% 15% 20% SLG CXP VNO FPO BXP PDM NYRT BDN CLI WRE OFC CUZ HIW DEA 5x 7x 9x 11x 13x 15x 17x 19x 21x 23x 0% 1% 2% 3% 4% 5% 6% 7% 8% 9% Price / 2017 Norm. FFO Annual Normalized FFO Growth '17‐'21 BXPNYRT VNO SLG WRE CUZ HIW OFC BDNPDM FPO CLI DEA CXP Columbia Property Trust, Inc. Page 32 of 37
- 33. Figure 42: Office Comp Sheet1 Note 1 : CUZ NAV and cap rates are as of 3Q17, reflects Houston spin‐off; Source: SNL Financial; Factset; STRH U.S. REITs Comp Sheet SunTrust Robinson Humphrey Equity Prem./ Applied Implied Net debt Stock Target Market NAV Disc. Cap Cap Div. + Pref / Ticker Rating Price Price Cap 2016E 2017E 2016E 2017E 2016E NAV Rate Rate Yield GAV ($ Bn) (x) (x) (x) (x) ($) (%) (%) (%) (%) (x) BDN Buy $16.18 $18.00 $2.9 12.6x 11.4x 18.2x 16.3x $16.69 (3.1%) 6.65% 6.78% 4.0% 46.1% BXP Hold $127.29 $130.00 $19.6 21.3x 21.0x 35.2x 29.5x $143.59 (11.4%) 4.75% 5.19% 2.0% 29.4% CLI Hold $28.71 $29.00 $2.9 13.4x 12.7x 25.2x 38.9x $29.48 (2.6%) 7.30% 7.42% 2.1% 49.5% CUZ Buy $8.42 $9.00 $1.8 10.8x 14.9x 46.7x 23.4x $12.08 (30.3%) 6.25% 6.44% 3.8% 30.7% CXP Hold $21.43 $21.00 $2.6 12.9x 15.0x 38.8x 24.7x $25.95 (17.4%) 6.25% 6.44% 5.6% 34.5% DEA Buy $19.76 $21.00 $0.9 16.0x 15.4x 20.5x 19.0x $16.76 17.9% 6.80% 6.01% 4.9% 27.9% FPO Buy $10.59 $11.00 $0.6 10.0x 12.3x 12.0x 15.9x $12.11 (12.6%) 6.95% 7.40% 3.8% 51.7% HIW Hold $50.30 $50.00 $5.2 15.6x 14.9x 24.9x 21.2x $47.29 6.4% 6.25% 5.97% 3.4% 30.5% NYRT Hold $10.54 $10.00 $1.8 26.5x 24.4x 36.7x 35.1x $10.47 0.7% 4.57% 4.55% 3.6% 42.0% OFC Buy $31.34 $31.00 $3.1 15.5x 15.0x 19.1x 18.0x $30.23 3.7% 7.00% 6.85% 3.5% 41.5% PDM Hold $20.49 $21.00 $3.0 12.4x 12.3x 15.5x 14.5x $22.83 (10.2%) 5.95% 6.36% 4.1% 37.4% SLG Buy $110.30 $123.00 $11.6 16.2x 16.9x 19.7x 28.2x $140.80 (21.7%) 4.40% 5.21% 2.8% 39.3% VNO Hold $104.69 $107.00 $21.1 21.5x 19.6x 47.9x 35.1x $123.04 (14.9%) 4.50% 5.07% 2.4% 38.2% WRE Hold $32.51 $32.00 $2.4 18.2x 17.9x 22.5x 21.0x $32.12 1.2% 6.00% 5.95% 3.7% 32.1% P/FFO Multiple P/FAD Multiple Columbia Property Trust, Inc. Page 33 of 37
- 34. Investment Recommendation and Price Target We are initiating coverage of Columbia Property Trust with a Hold rating and a $21 price target, which implies a 2.7% potential total return including a 4.7% projected dividend yield (versus an average of 6.7% for our office coverage universe). Our target is based on an $18.61 discounted cash flow value (50% weighting) and 15% assumed discount to our projected NAV a year from now (50%). Our target also implies 13.9x 2018E FFO and 19.1x 2018E FAD; the stock currently trades at 15.0x 2017E FFO and 24.7x 2017E FAD. Figure 43: Price Target Calculation Source: SNL Financial, Factset; STRH Figure 44: Office Price Target Comparison Source: SNL Financial; Factset, STRH Yr 1 Yr 2 Yr 3 Yr 4 Yr 5 FAD $0.24 $1.06 $1.13 $1.05 $0.92 Term Value (FAD) $18.77 Sub-total $0.24 $1.06 $1.13 $1.05 $19.69 NPV $17.36 Forward Equity Price $18.61 DCF Assumptions Cost of Equity 7.2% Net Asset Value $25.95 Year 5 Growth 7.4% 3Q17E Net Asset Value $26.34 Term. Growth Rate 1.9% 15% Discount to 3Q17E NAV $22.39 Forward Dividend Yield 4.7% Target Price $21.00 Total Return 2.7% Price Prem/Disc 5‐Yr. Avg. 3Q17E Prem/Disc Adj. Fwd. Price Implied Dividend Implied Ticker Rating 12/20/2016 NAV to NAV Prem/Disc NAV Applied NAV DCF Target Appreciation Yield Tot. Return BDN Buy $16.18 $16.69 ‐3% ‐8% 16.92 ‐3% $16.49 $18.51 $18 11.2% 4.0% 15.3% SLG Buy $110.30 $140.80 ‐22% ‐7% 148.09 ‐13% $129.58 $116.86 $123 11.5% 2.6% 14.1% DEA Buy $19.76 $16.76 18% ‐1% 17.12 7% $18.41 $23.31 $21 6.3% 4.9% 11.1% CUZ Buy $8.42 $8.09 4% ‐7% 8.09 0% $8.09 $9.07 $9 6.9% 3.3% 10.2% FPO Buy $10.59 $12.11 ‐13% ‐19% 12.51 ‐15% $10.63 $11.98 $11 3.9% 3.8% 7.6% PDM Hold $20.49 $22.83 ‐10% ‐6% 22.08 ‐7% $20.43 $22.35 $21 2.5% 4.1% 6.6% OFC Buy $31.34 $30.66 2% ‐13% 31.34 ‐3% $30.56 $32.49 $32 2.1% 3.5% 5.6% VNO Hold $104.69 $123.04 ‐15% ‐5% 131.51 ‐10% $118.36 $94.64 $107 2.2% 2.4% 4.6% BXP Hold $127.29 $143.59 ‐11% ‐4% 144.91 ‐5% $137.66 $122.48 $130 2.1% 2.3% 4.4% HIW Hold $50.30 $47.29 6% ‐1% 47.41 5% $49.78 $49.68 $50 ‐0.6% 5.0% 4.4% CLI Hold $28.71 $29.48 ‐3% ‐13% 29.77 ‐10% $26.79 $31.49 $29 1.0% 2.1% 3.1% CXP Hold $21.43 $25.95 ‐17% ‐15% 26.34 ‐15% $22.39 $18.61 $21 ‐2.0% 4.7% 2.7% WRE Hold $32.51 $32.12 1% ‐12% 32.94 ‐3% $32.11 $30.89 $32 ‐1.6% 3.7% 2.1% NYRT Hold $9.90 $10.83 ‐9% ‐8% 11.33 ‐8% $10.48 $9.48 $10 1.0% 0.4% 1.4% Simple Average ‐5% ‐8% ‐6% 3.3% 3.3% 6.7% Columbia Property Trust, Inc. Page 34 of 37
- 35. Company Description Columbia Property Trust is a publicly-traded (NYSE: CXP), fully-integrated and self-managed office REIT, headquartered in Atlanta, GA. The company was originally founded in 2004 as “Wells REIT II,” a public, non-traded REIT which built a portfolio of high-yield office properties to support its large dividend payout. CXP aims to own and operate primarily class-A office properties in central business district (CBD) locations within gateway coastal markets, such as New York, Washington DC, and San Francisco. Investment Thesis We are initiating with a Hold rating because 1) there is uncertainty regarding the pricing/timing of dispositions and capital reinvestment, 2) we think Street NAV and 2017/18 FFO estimates appear optimistic, particularly in light of a few large likely tenant move-outs (21% of lease revenue expiring in 2017-2018), 3) the dividend is likely to be cut significantly in early 2017, in our view, and 4) we think investors will require some proof of execution/growth before the discount to NAV closes relative to many established peers also trading at discounts. Valuation and Risks CXP based on: $18.61 DCF (50% weighting) and 15% assumed discount to our projected NAV a year from now (50%). Price Target: $21. Risks to our thesis that could cause the stock to outperform or underperform include: 1) disposition timing/pricing, 2) attractiveness of capital redeployment options, 3) tenant retention/re-leasing activity, 4) magnitude of a potential dividend cut and 5) fundamental performance of CXP's largest markets. The analyst has elected to benchmark the performance for the ratings of the stock that is the subject of this report to the RMZ. Companies Mentioned in This Note Brandywine Realty Trust (BDN, $16.18, Buy, Michael Lewis) Boston Properties, Inc. (BXP, $127.29, Hold, Michael Lewis) Mack-Cali Realty Corporation (CLI, $28.71, Hold, Michael Lewis) Cousins Properties Incorporation (CUZ, $8.42, Buy, Michael Lewis) Columbia Property Trust, Inc. (CXP, $21.43, Hold, Michael Lewis) Easterly Government Properties, Inc. (DEA, $19.76, Buy, Michael Lewis) First Potomac Realty Trust (FPO, $10.59, Buy, Michael Lewis) Highwoods Properties, Inc. (HIW, $50.30, Hold, Michael Lewis) New York REIT, Inc. (NYRT, $9.90, Hold, Michael Lewis) Corporate Office Properties Trust (OFC, $31.34, Buy, Michael Lewis) Piedmont Office Realty Trust, Inc. (PDM, $20.49, Hold, Michael Lewis) SL Green Realty Corp. (SLG, $110.30, Buy, Michael Lewis) Vornado Realty Trust (VNO, $104.69, Hold, Michael Lewis) Washington Real Estate Investment Trust (WRE, $32.51, Hold, Michael Lewis) Analyst Certification I, Michael Lewis , hereby certify that the views expressed in this research report accurately reflect my personal views about the subject company(ies) and its (their) securities. I also certify that I have not been, am not, and will not be receiving direct or indirect compensation in exchange for expressing the specific recommendation(s) in this report. Required Disclosures Analyst compensation is based upon stock price performance, quality of analysis, communication skills, and the overall revenue and profitability of the firm, including investment banking revenue. As a matter of policy and practice, the firm prohibits the offering of favorable research, a specific research rating or a specific target price as consideration or inducement for the receipt of business or compensation. In addition, associated persons preparing research reports are prohibited from owning securities in the subject companies. Charts indicating changes in ratings can be found in recent notes and/or reports at our website or by contacting SunTrust Robinson Humphrey. Please see our disclosures page for more complete information at https://suntrust.bluematrix.com/sellside/Disclosures.action. Columbia Property Trust, Inc. Page 35 of 37
- 36. STRH Ratings System for Equity Securities Dissemination of Research SunTrust Robinson Humphrey (STRH) seeks to make all reasonable efforts to provide research reports simultaneously to all eligible clients. Reports are available as published in the restricted access area of our website to all eligible clients who have requested a password. Institutional investors, corporates, and members of the Press may also receive our research via third party vendors including: Thomson Reuters, Bloomberg, FactSet, and S&P Capital IQ. Additional distribution may be done by sales personnel via email, fax, or other electronic means, or regular mail. For access to third party vendors or our Research website: https://suntrustlibrary.bluematrix.com/client/library.jsp please email the Research Department at STRHEquityResearchDepartment@SunTrust.com or contact your STRH sales representative. The rating system effective as of Oct. 7, 2016: STRH Rating System for Equity Securities SunTrust Robinson Humphrey (STRH) rates individual equities using a three-tiered system. Each stock is rated relative to the broader market (generally the S&P 500) over the next 12-18 months (unless otherwise indicated). Buy (B) – the stock’s total return is expected to outperform the S&P 500 or relevant benchmark over the next 12-18 months (unless otherwise indicated) Hold (H) – the stock’s total return is expected to perform in line with the S&P 500 or relevant benchmark over the next 12-18 months (unless otherwise indicated) Sell (S) – the stock’s total return is expected to underperform the S&P 500 or relevant benchmark over the next 12-18 months (unless otherwise indicated) Not Rated (NR) – STRH does not have an investment rating or opinion on the stock Coverage Suspended (CS) – indicates that STRH’s rating and/or target price have been temporarily suspended due to applicable regulations and/or STRH Management discretion. The previously published rating and target price should not be relied upon STRH analysts have a price target on the stocks that they cover, unless otherwise indicated. The price target represents that analyst's expectation of where the stock will trade in the next 12-18 months (unless otherwise indicated). If an analyst believes that there are insufficient valuation drivers and/or investment catalysts to derive a positive or negative investment view, they may elect with the approval of STRH Research Management not to assign a target price; likewise certain stocks that trade under $5 may exhibit volatility whereby assigning a price target would be unhelpful to making an investment decision. As such, with Research Management‘s approval, an analyst may refrain from assigning a target to a sub- $5 stock. Legend for Rating and Price Target History Charts: B = Buy H = Hold S = Sell D = drop coverage CS = Coverage Suspended I = initiate coverage T = transfer coverage The prior rating system until Oct. 7, 2016: 3 designations based on total returns* within a 12-month period** ∙ Buy – total return ≥ 15% (10% for low-Beta securities)*** ∙ Reduce – total return ≤ negative 10% (5% for low Beta securities) ∙ Neutral – total return is within the bounds above ∙ NR – NOT RATED, STRH does not provide equity research coverage ∙ CS – Coverage Suspended Columbia Property Trust, Inc. Page 36 of 37
- 37. *Total return (price appreciation + dividends); **Price targets are within a 12-month period, unless otherwise noted; ***Low Beta defined as securities with an average Beta of 0.8 or less, using Bloomberg’s 5-year average SunTrust Robinson Humphrey ratings distribution (as of 12/21/2016): Coverage Universe Investment Banking Clients Past 12 Months Rating Count Percent Rating Count Percent Buy 373 58.01% Buy 91 24.40% Hold/Neutral 268 41.68% Hold/Neutral 48 17.91% Sell/Reduce 2 0.31% Sell/Reduce 0 0.00% Other Disclosures Information contained herein has been derived from sources believed to be reliable but is not guaranteed as to accuracy and does not purport to be a complete analysis of the security, company or industry involved. This report is not to be construed as an offer to sell or a solicitation of an offer to buy any security. SunTrust Robinson Humphrey, Inc. and/or its officers or employees may have positions in any securities, options, rights or warrants. The firm and/or associated persons may sell to or buy from customers on a principal basis. Investors may be prohibited in certain states from purchasing some over- the-counter securities mentioned herein. Opinions expressed are subject to change without notice. The information herein is for persons residing in the United States only and is not intended for any person in any other jurisdiction. SunTrust Robinson Humphrey, Inc.’s research is provided to and intended for use by Institutional Accounts as defined in FINRA Rule 4512(c). The term “Institutional Account" shall mean the account of: (1) a bank, savings and loan association, insurance company or registered investment company; (2) an investment adviser registered either with the SEC under Section 203 of the Investment Advisers Act or with a state securities commission (or any agency or office performing like functions); or (3) any other person (whether a natural person, corporation, partnership, trust or otherwise) with total assets of at least $50 million. SunTrust Robinson Humphrey, Inc. is a registered broker-dealer and a member of FINRA and SIPC. It is a service mark of SunTrust Banks, Inc. SunTrust Robinson Humphrey, Inc. is owned by SunTrust Banks, Inc. ("SunTrust") and affiliated with SunTrust Investment Services, Inc. Despite this affiliation, securities recommended, offered, sold by, or held at SunTrust Robinson Humphrey, Inc. and at SunTrust Investment Services, Inc. (i) are not insured by the Federal Deposit Insurance Corporation; (ii) are not deposits or other obligations of any insured depository institution (including SunTrust Bank); and (iii) are subject to investment risks, including the possible loss of the principal amount invested. SunTrust Bank may have a lending relationship with companies mentioned herein. Please see our Disclosure Database to search by ticker or company name for the current required disclosures, including risks to the price targets, Link: https://suntrust.bluematrix.com/sellside/ Disclosures.action Please visit the STRH equity research library for current reports and the analyst roster with contact information, Link (password protected): STRH RESEARCH LIBRARY SunTrust Robinson Humphrey, Inc., member FINRA and SIPC. SunTrust and SunTrust Robinson Humphrey are service marks of SunTrust Banks, Inc. If you no longer wish to receive this type of communication, please request removal by sending an email to STRHEquityResearchDepartment@SunTrust.com © SunTrust Robinson Humphrey, Inc. 2016 . All rights reserved. Reproduction or quotation in whole or part without permission is forbidden. ADDITIONAL INFORMATION IS AVAILABLE at our website, www.suntrustrh.com, or by writing to: SunTrust Robinson Humphrey, Research Department, 3333 Peachtree Road N.E., Atlanta, GA 30326-1070 Columbia Property Trust, Inc. Page 37 of 37