SlideShare a Scribd company logo
1 of 38
Download to read offline
INITIATE Buy
October 18, 2016 Easterly Government
Properties, Inc. (DEA)
Initiate Buy
Price Target: $21.00
Price (Oct. 17, 2016) $18.84
52-Wk Range $20.60-$16.53
Market Cap ($M) $836
ADTV 278,520
Shares Out (M) 44.4
Short Interest Ratio/% Of Float 6.5%
Dividend/Yield $0.94/5.0%
TR to Target 16.5%
NAV/Share $16.97
2015A 2016E 2017E
Curr. Prior Curr. Prior
FFO
1Q $0.26 $0.30A -- $0.30 --
2Q $0.26 $0.30A -- $0.30 --
3Q $0.26 $0.29 -- $0.30 --
4Q $0.26 $0.31 -- $0.31 --
CY $1.04 $1.19 -- $1.22 --
P/FFO 18.1x 15.8x 15.4x
Consensus
CY -- $1.20 $1.26
FYE Dec
Michael Lewis, CFA
212-319-5659
michael.lewis@suntrust.com
Kevin Cheng, CFA
212-303-4149
kevin.cheng@suntrust.com
Correction: Initiating at Buy with $21
Price Target
This note corrects our NAV model and estimate
Investment Thesis: DEA owns/operates select buildings leased to mission-
critical U.S. government agencies, such as the DEA, FBI and IRS. We expect
this niche to contribute to strong risk-adjusted earnings from long government
leases with high renewal rates and notable expense reimbursements. The
experienced management team is focused on a targeted group of potential
acquisition opportunities and typically faces limited competition from other
investors – which should drive healthy external growth via acquisitions and
build-to-suit development. DEA is one of the lowest-levered office REITs in our
coverage universe and offers the highest dividend yield (albeit at a high payout
ratio), supported by predictable cash flows. The relative valuation is not heavily
discounted (particularly P/NAV), but we think the stock is attractive at current
levels, considering all factors.
Challenges/Risks: We expect DEA to produce attractive risk-adjusted returns
(which it has since its IPO), supported by stable portfolio cash flow, high-
yield acquisitions/development and a low-levered balance sheet. That said, we
highlight three specific risks. First, GSA tenants offer strong credit and high
renewal rates, but DEA has high property and tenant concentration risk that
is tied to government decisions. Re-leasing assets could prove difficult/costly
should a large tenant vacate an entire building. Second, the company’s small
size is evident in its high G&A expense relative to revenue. DEA needs to
continue to grow, which means continuing to execute acquisitions, while relying
on accessible and cost-effective capital to maintain the balance sheet. Finally,
DEA has exhibited a high correlation with the 10-year Treasury yield in its
relatively short time as a public company. It may be viewed as more bond-
like, even compared with other REITs, and the stock could be susceptible to
underperformance in a rising interest rate environment.
Estimates: We are introducing a 2016 FFO estimate of $1.19 per share
($1.23ps excluding acquisition costs) and 2017 estimate of $1.22ps ($1.24ps).
We conservatively assume an equity raise in early 2017, as well as gradual
acquisition pacing and slightly less development than Management has
suggested. Our estimates imply 14.3% YOY normalized FFO growth in 2016,
0.6% in 2017, and an average of 4.5% annually from 2016-2021.
Valuation and Price Target: DEA trades at a 1% premium to our office
coverage universe on P/2016E FFO and a 30% discount on P/FAD. It trades at
a 11% premium to our $16.97 NAV estimate (6.2% implied cap rate) versus a
9% average discount for the group. Our $21 price target is based on a $23.59
discounted cash flow (50% weighting) and our projected NAV a year from now
(50%). It implies a 16.5% total return, including the 5.0% projected dividend
yield.
SEE PAGE 36 FOR REQUIRED DISCLOSURE INFORMATION Page 1
Equity Research
Please don't forward - Exclusive use: stan.fediuk@suntrust.com
Table of Contents
Scenario Analysis...........................................................................................................................................3
Company Profile............................................................................................................................................4
Investment Summary....................................................................................................................................5
Portfolio Profile.............................................................................................................................................9
Internal Growth...........................................................................................................................................12
External Growth..........................................................................................................................................15
Earnings and NAV Estimates.......................................................................................................................20
Balance Sheet and Leverage .......................................................................................................................23
High Dividend Yield (and Payout Ratio) ......................................................................................................26
Management Team.....................................................................................................................................27
Valuation.....................................................................................................................................................30
Investment Recommendation and Price Target.........................................................................................35
Easterly Government Properties, Inc.
Page 2 of 38
Scenario Analysis
Figure 1: DEA Scenario Analysis
Source: Company documents; STRH
Target Price Upside Target Price Target Price Downside
$22.50 $21.00 $17.25
Probability Probability Probability
25% 65% 10%
Bull Case STRH Case Bear Case
The GSA continues to grow its leased
private sector portfolio at above average
growth rates.
The GSA determines its leased footprint is
appropriate and grows the portfolio at
historical rates.
The GSA materially reduces its footprint as
leases expire.
Development yields and volume are better
than expected, thus improving external
growth.
Development yields and volume are in line
with our model ($100 million over the next
five years at 7.5%).
DEA develops less than $200 million of
projects over the next five years and/or
yields come in below our expectations.
Steady/lower interest rates and investor
demand for yield drives property values
and/or income stocks higher.
Interest rates are range-bound and cap
rates stabilize near current levels.
Higher interest rates contribute to a
modest increase in cap rates and income
stocks become relatively less attractive.
DEA completes acquisitions above the high
end of management's $75-$125 million
annual guidance and yields are a bit better.
Acquisition volume and yields are roughly
in line with our expectations ($120 million
annually at 7%).
Acquisition volume and/or yields fall short
of our estimates.
Limited supply and healthy demand lead to
rent spreads above historical averages
(which are around +20%).
Market rents gradually increase, driving
rent spreads not dissimilar from historical
averages. Nearly all leases are renewed.
Market rents slip or another factor causes
the government to negotiate less favorable
renewal terms for the landlord. One or
more tenants move out.
Easterly Government Properties, Inc.
Page 3 of 38
Company Profile
Easterly Government Properties is a publicly-traded (NYSE: DEA), self-managed, fully-integrated office
REIT headquartered in Washington D.C. DEA is focused on the acquisition, development and
management of Class A commercial properties that are primarily leased to mission-critical U.S.
Government agencies, including but not limited to the DEA, FBI, ICE and IRS. DEA was originally founded
in 2011 as Easterly Partners, LLC, and subsequently merged with Western Devcon to form Easterly
Government Properties, Inc. The company completed its IPO on February 5, 2015. Following several
acquisitions, it now owns 41 properties (including three 3Q16 acquisitions) encompassing 2.8 million sf
(as of 6/30/16) and has a market cap of $0.8 billion (as of 10/17/16).
Figure 2: Company Profile
Source: Company documents; SNL Financial; Factset; STRH
Institution Name Easterly Government Properties, Inc.
Trading Symbol & Exchange DEA-US
Exchange NYSE
Industry Real Estate
Property Type Office
Address 2101 L Street NW
City, State, Zip Washington, DC 20037
Phone Number (202) 595-9500
State of Incorporation MD
Web Address http://www.easterlyreit.com
Company Description
Corporate Headquarters
Chief Executive Officer William C. Trimble III
Chief Financial Officer Meghan G. Baivier
Chief Operating Officer Meghan G. Baivier
Chief Accounting Officer Alison M. Bernard
EVP Development & Acquisitions Michael P. Ibe
EVP Government Relations Ron E. Kendall
Investor Relations Professional Lindsay Winterhalter
Chairman of the Board Darrell W. Crate
IPO Date (mm/dd/yyyy) 2/5/2015
IPO Price (Reported) 15.00
IPO Gross Proceeds (Reported) 207,000,000
IPO Details
Management
Easterly Government Properties, Inc.
Page 4 of 38
Investment Summary
Strategy
We believe DEA’s competitive advantage stems from management leveraging its extensive network of
relationships and experience/knowledge of GSA real estate needs to win attractive acquisition and
development opportunities. Approximately 96% of annualized base rent is from GSA leases at
properties which often require specialized security features and credentialed personnel to
manage/service them. As of 2Q16, the DEA, FBI and ICE accounted for ~44% of the company’s total
revenue.
The company has a disciplined acquisition strategy, with only about 500 properties across the country
that it would consider owning. It targets class-A buildings greater than 40,000 sf that are at least 85%
leased to a single U.S. government tenant. The property must be strategically located and less than 20
years old with a 10-year minimum lease term (for developments). DEA also prefers security-related,
growing federal agencies with an enduring mission and increasing priority. DEA is currently tracking
~$700 million of properties and actively evaluating around $200 million (the 41 currently-owned
properties, totaling nearly 3 million sf, were all acquired since 2010). Management intends to acquire
$75-$125 million of assets per year going forward; we model $120 million annually at a 7% cap rate. The
company also pursues build-to-suit opportunities (we model $200 million total at a 7.6% yield over the
next five years, versus $250 million suggested by management).
DEA maintains one of the lowest-levered balance sheets in our coverage universe, while paying out
nearly all of its free cash flow as dividends to investors. We believe it is important to the company’s
growth and leverage plans that the capital markets remain open and available.
Positive Investment Thesis
In our view, DEA should be a steady growing income vehicle. Long leases (with expense increase
reimbursements) to government tenants at very select locations should underpin predictable, low-
volatility earnings. Meanwhile, management will continue to leverage its relationships and knowledge of
GSA real estate requirements to source acquisitions and build-to-suit development opportunities. DEA is
one of the lowest-levered office REITs in our coverage universe and offers the highest dividend yield
(albeit at a high payout ratio), supported by predictable cash flows.
Figure 3: Investment Summary
Source: STRH
Secure High-Quality Cash Flows: The company’s portfolio is 100% leased and the U.S. Government
accounts for 96% of DEA’s annual base rent. These GSA leases are paid through the Federal Buildings
Fund (which is not subject to direct federal appropriations) and there has never been a default.
Additional factors contributing to steady cash flows include 1) long 10- to 20-year initial leases and five-
to 10-year renewals, 2) high renewal rates historically in the low-90% range, supported by significant
Investment Positives Keep an Eye On…
Expectation of more predictable, lower-volatility earnings. Modest premium to NAV relative to other office REITs.
Large, selective group of acquisition targets with limited competition. Below-average projected internal growth.
Unparalleled tenant credit. Potentially challenging re-leasing/repurposing if tenant leaves.
Low average age for property portfolio (<12 years). Tenant concentration risk (even if it is great credit).
Long leases with high renewal rates and expense reimbursements. Some leases have early-out clauses.
Strong relationships, market knowledge and expertise in niche. Small size and high G&A expense as percentage of revenue.
Strong balance sheet; low financial leverage. Continued capital markets accessibility is important.
Highest dividend yield in our office coverage universe. High FAD payout ratio.
Easterly Government Properties, Inc.
Page 5 of 38
capex spend on behalf of the tenant, and 3) CPI-based tenant reimbursement of operating expense
increases and usually reimbursement for all property tax increases. According to DEA, renewal rent
spreads have averaged 18%-26% historically.
Well-Positioned For Acquisitions/Development: Management’s experience and relationships in its
niche provide an advantage sourcing/closing acquisitions, with limited competition. DEA maintains a
proprietary database of thousands of properties and is targeting a subset of about 500 leases/locations
that meet specific criteria. DEA is currently tracking ~$700 million of potential acquisitions and is
actively evaluating roughly $200 million. The GSA’s shift to more leased properties works in DEA’s favor,
and naturally, the average age of U.S. Government-owned properties is 47 years and GSA leased
inventory has grown 29% since 1998. We are modeling $120 million of annual acquisitions at a 7% yield,
which are the primary drivers of our conservative 4.5% projected annual FFO growth over the next five
years. DEA will also pursue build-to-suit development opportunities, which could drive upside to our
estimates (we model $200 million at 7.6% yields over the next five years, but management suggested
$250 million).
Strong Balance Sheet and High Yield: DEA has one of the strongest balance sheets within our office
coverage universe and looks to maintain one to two years of capital capacity before it would need to
access the capital markets. DEA’s net debt-to-market capitalization is 31% (versus a 38% average for our
office coverage universe), its net debt-to-EBITDA is 4.9x at 2Q16 (versus 7.7x for the group) and its net-
debt to GAV is 25% (versus 38%). Management is targeting 40% net debt-to-EV and 6x net debt-to-
EBITDA.
Expect Good Risk-Adjusted Returns: The stock has returned 30% since its 2/6/15 IPO versus 5% for the
RMS and 3% on average for our office coverage universe. Meanwhile, the stock’s daily standard
deviation of 1.5% was only slightly higher than the 1.3% average for our office coverage (1.0% for the
RMZ), supported by the stability of portfolio cash flow and low-levered balance sheet. Said differently,
DEA has exhibited a better return per unit of risk than every office REIT we cover other than PDM (and
better than the RMS) during its relatively short time as a publicly-traded company. We expect DEA to
continue to offer an attractive combination of growth and stability. Introducing valuation into the
equation, we calculate attractive five-year FFO and FAD PEG ratios (2016-2021 growth over 2016E
earnings multiples) that rank in the top half of our 13-company office coverage universe.
Differentiated Business Model with Experienced Management: The company’s unique investment
strategy focuses on owning and operating high-quality assets that are occupied by mission-critical
government agencies (i.e. the DEA, FBI, ICE, IRS). We believe the company is most often compared with
Government Properties Income Trust (GOV, $20.92, Not Rated) and Corporate Office Properties (OFC,
$27.68, Buy). Relative to GOV, we think DEA has a higher-quality portfolio, more shareholder-friendly
internal management structure and better balance sheet. DEA primarily leases to the GSA, whereas
OFC’s properties are typically leased to defense contractors (OFC also owns a significant amount of
conventional office properties). Notably, the Department of Justice budget has grown by a 3.4% CAGR
over the past 10 years, versus a -0.4% CAGR for the Department of Defense.
DEA’s senior management team averages more than 18 years of GSA-related experience and has
extensive experience with government real estate management, development, and property & asset
management. These relationships should serve as a key competitive advantage in sourcing acquisitions
(both on- and off-market) and developments, and retaining tenants.
Easterly Government Properties, Inc.
Page 6 of 38
Key Challenges/Risks
Tenant Concentration Risk: The U.S. government accounts for 91% of DEA’s total square footage and
96% of its annualized base rent (“ABR”). More specifically, the DEA, FBI and ICE account for ~44% of
total ABR.
We believe DEA’s specific tenants (and locations) are at low risk of cutbacks due to budgetary
restrictions or changes in policy, but the locations and specialized nature of the buildings could make
many challenging/expensive to re-lease in the event of a move-out. It is notable that 21% of DEA’s
leases (by revenue) are in “soft term,” which is a period near the end of some GSA leases during which
the lease has not expired, but the tenant has the option of moving out.
Property Concentration Risk: Related to the risk above, as of 2Q16, DEA’s four largest buildings (IRS-
Fresno, PTO-Arlington, FBI–San Antonio & Omaha) accounted for ~26% of ABR. None of the tenants are
expected to move out, but even one could significantly impact earnings.
GSA Downsizing/Political Risk: In January 2016, the Government Accountability Office (“GAO”) issued a
report which examined the GSA’s leasing costs. The scope of the report was to identify any
opportunities to increase efficiency and reduce leasing costs paid to the private sector. The report
suggested that the GSA should: 1) enhance competition by encouraging tenants to modify their
geographic and building requirements; 2) consider seeking the ability to use the Federal Building Fund
balances to reduce interest rates related to amortized tenant improvements; and 3) provide tenants
with an option to reduce fees by choosing non-cancelable occupancy agreements (no soft term). The
GSA has agreed with the first two suggestions, but not the third.
We believe loosening GSA real estate requirements (location or specific building requirements) could
increase competition for DEA. However, any potential changes to the current strategy/mandate are
likely to take a significant amount of time to implement.
Long-term trends remain favorable for DEA, as GSA leased inventory has grown 29% since 1998.
However, the GAO report signifies that the government is cognizant of the need for cost containment,
which could represent a longer-term risk. Of course, the upcoming presidential election also adds an
element of uncertainty with respect to budget growth and priorities.
Acquisition/Capital Markets Risk: Though the core portfolio should provide steady cash flow, the
primary earnings growth drivers will be acquisitions and development. The company’s relatively narrow
focus could mean there may be times when transaction opportunities are light. Moreover, DEA will
need to access the capital markets (both debt and equity) in order to continue its much-needed growth.
DEA’s small size presents some challenges, particularly because one tenant move-out could be fairly
damaging at this point. G&A expense is currently around 11% of revenue, evidence that efficiencies are
possible with scale – both a risk and an opportunity.
Interest Rate Risk: Management seeks to limit the impact of interest rate changes on earnings and cash
flow, primarily through a moderate level of overall borrowings and interest rate swap agreements.
However, DEA’s valuation may still be more influenced by adverse interest rate movements than other
office REITs, given the bond-like characteristics of the company. In its relatively brief history as a public
company, the stock has had a stronger correlation with the 10-year Treasury yield (-80%) and lower beta
(0.48) than other stocks in our office coverage universe (see Figure 48). Therefore, DEA could
Easterly Government Properties, Inc.
Page 7 of 38
underperform if bond yields rise significantly, although there may still be diversification benefits to
owning it in a portfolio.
We should note that we are not convinced long-term interest rates will move significantly higher in the
near term. Additionally, we think it is too early to tell how the stock will correlate with rates and the
broader market over time. The company does have long-term leases typically without rent escalators,
but GSA tenants are less likely to be impacted by broader economic shifts and the relative likelihood of
an earnings miss appears low. Meanwhile, DEA maintains one to two years of capital capacity to meet
its external growth goals, so it could take advantage (at least for a while) in the event of any increase in
acquisition cap rates.
Easterly Government Properties, Inc.
Page 8 of 38
Portfolio Profile
As of 6/30/16, Easterly’s consolidated portfolio included 38 properties, totaling 2.8 million square feet
across 44 leases (up from 29 properties and 2.1 million sf at the 1Q15 IPO). California, Texas and
Virginia account for 54% of the portfolio (by NOI), which is mostly office space (78%) with smaller
allocations to laboratory (11%) courthouse (8%) and warehouse (3%) properties. DEA’s three largest
tenants, the Drug Enforcement Agency (DEA, 19%), Federal Bureau of Investigation (FBI, 16%) and
Immigration and Customs Enforcement (9%), account for a combined ~44% of annualized lease income.
In total, 96% of the portfolio is leased to the U.S. government, including more than 60% to security-
related agencies. The portfolio has a weighted average lease term of approximately seven years, an
average annual rental rate of $32.68 psf and an average age of 11.8 years (making it one of the youngest
office REIT portfolios).
Figure 4: DEA 2Q16 NOI by State Figure 5: DEA 2Q16 NOI by Property Type
Source: Company documents; SNL Financial; STRH
DEA Knows What It Wants: The company has identified roughly 500 properties in the U.S. that fit its
investment criteria. These are strategically-located, class-A buildings that are less than 20 years old,
greater than 40,000 sf, and at least 85% leased to a single government agency. DEA prefers security-
related, growing federal agencies with an enduring mission and increasing priority (see Figure 6 & Figure
7 for tenant list and recent budget growth rates). Developments must have a minimum lease term of 10
years. There is also increased focus on environmental sustainability, which has become a more
important factor for the government when considering potential locations.
CA, 30%
TX, 14%
VA, 10%
NM, 9%
NE, 10%
CO, 6%
AR, 2%
SC, 4%
WV, 2%
MS, 2%
GA, 3%
MT, 2% NY, 1% FL, 4%
Office, 77%
Warehouse/
Distribution,
3%
Courthouse/
Office, 8%
Laboratory,
11%
Easterly Government Properties, Inc.
Page 9 of 38
Figure 6: DEA – Top 10 Tenants
Source: Company documents; SNL Financial; STRH
Figure 7: DEA – Government agency tenant budget growth (2005 – 2015)1
Note
1
: White bars denote top 3 DEA tenants
Source: Company documents; SNL Financial; STRH
Market fundamentals are not as important to DEA’s performance as they are for other REITs, due to the
company’s niche tenant base. That said, we provide a look at office employment, occupancy and rent
growth for reference below.
The company’s top three properties (Fresno, Metro DC/NoVA, and San Antonio) account for a combined
21% of total rent. Fresno and Metro DC are expected to experience annual employment growth of 0.4%
and 0.3%, respectively, over the next five years, which fall below the national average of 1.1%.
However, San Antonio is expected to outpace the national average with employment growth of 1.8%
annually.
Tenant
Leased
sqft (000s)
Ann. Lease
Income ($'000s)
% of Total
Ann. Revenue
1 Drug Enforcement Administration ("DEA") 405 $17,478 19.8%
2 Federal Bureau of Investigation ("FBI") 459 $14,250 16.2%
3 Immigration and Customs Enforcement ("ICE") 183 $7,663 8.7%
4 Internal Revenue Service ("IRS") 180 $7,430 8.5%
5 Administrative Office of the U.S. Courts ("AOC") 184 $7,309 8.1%
6 Patent and Trademark Office ("PTO") 190 $6,530 7.3%
7 U.S. Forest Service ("USFS") 191 $5,440 6.1%
8 Customs and Border Protection ("CBP") 127 $5,373 6.0%
9 Department of Transportation ("DOT") 130 $3,697 4.2%
10 U.S. Citizens and Immigration Services ("USCIS") 138 $3,242 3.7%
2,187 $78,412 88.6%Total
-20%
0%
20%
40%
60%
80%
100%
120%
PTO
CBP
FBI
MEPCOM
ICE
SSA
USCG
DEA
AOC
DoT
DoE
IRS
DoD
USFS
Easterly Government Properties, Inc.
Page 10 of 38
Figure 8: Cumulative Office Job Growth Since 4Q06
Source: Company documents; STRH
As shown below, CBRE forecasts improving occupancy for Northern VA over the next five years (+2.1 pps
to 84.2%), but occupancy declines for Fresno (-0.4pps to 86.5%) and San Antonio (-4.3pps to 81.8%). For
reference, the national office occupancy rate is expected to drop 1.6pps to 85.4% over the same period.
CBRE forecasts above-average rental growth over the next five years for Fresno (+2.5% annually) and
San Antonio (+2.5%), while Northern VA will likely lag (-0.4%). National office rent growth is expected to
average 0.7% annually over the next five years.
Figure 9: Office Occupancy for DEA’s Top Markets Figure 10: Rental Rates for DEA’s Top Markets
Source: CBRE; STRH
-20%
-10%
0%
10%
20%
30%
40% 4Q2006
4Q2007
4Q2008
4Q2009
4Q2010
4Q2011
4Q2012
4Q2013
4Q2014
4Q2015
4Q2016
4Q2017
4Q2018
4Q2019
4Q2020
4Q2021
Fresno Metro DC San Antonio US
65%
70%
75%
80%
85%
90%
95%
100%
1994
1996
1998
2000
2002
2004
2006
2008
2010
2012
2014
2016
2018
2020
Fresno Northern VA SanAntonio US
$5
$10
$15
$20
$25
$30
$35
$40
1990
1992
1994
1996
1998
2000
2002
2004
2006
2008
2010
2012
2014
2016
2018
2020
Fresno Northern VA San Antonio US
Easterly Government Properties, Inc.
Page 11 of 38
Internal Growth
More Stability than Growth
Long-term leases without annual rent escalators (albeit with expense growth reimbursements) should
lead to limited core growth. We are modeling 99%-100% occupancy over the next few years, with rent
spreads near historical averages (lower in the near-term and higher in the later years of our model).
DEA is not yet to the point of providing same-store NOI growth, but we estimate it will likely run in the
low single-digit range. Management has identified three key drivers of internal growth, which we
discuss below.
1) Strong Lease Renewal Spreads (Albeit Spread Over a Long Time)
GSA leases do not contain annual rent bumps and the new base rent upon renewal is typically reset
based on several factors, including 1) inflation, 2) the replacement cost of the building and 3) property
enhancements since the prior lease renewal. As illustrated in Figure 11, between 2006 and 2014, the
average rent increase for GSA leases within DEA’s target market (class A federal buildings greater than
40,000 sf at least 85% leased to a government tenant) was approximately 18% for leases with terms of
10 to 15 years and about 26% for leases with terms of 15 years or more – which implies about a 1-2%
CAGR over that duration.
Notably, initial leases are typically 10-20 years, and renewals 5-10 years. In DEA’s experience, single-
tenant properties larger than 50,000 sf that are 100% leased to the U.S. Government have renewed with
93%-95% frequency.
Figure 11: Target Market Lease Renewal Spreads1
Note
1
: Represents change in rent/sf for properties in the company’s target market, renewed between Jan 2006 and Sep 2014
Source: Company documents; STRH
Leases totaling only 6.4% of annualized base rent are scheduled to expire through 2017 (see Figure 12).
While the low tenant rollover implies a stable revenue stream, it also implies that there is limited rent
growth opportunity from a relatively small amount of flat leases rolling over. Two larger leases (8.5% of
17.7%
26.1%
0%
5%
10%
15%
20%
25%
30%
10-15 year leases 15 year+ leases
Easterly Government Properties, Inc.
Page 12 of 38
ABR at IRS–Fresno and 1.9% of ABR at CBP–Chula Vista) are set to expire in 2018, though like essentially
all of the company’s leases, the likelihood of renewal is high.
Importantly, the lease expiration schedule does not reflect that tenants representing 21% of rent are
currently on “soft term,” which is a period near the end of the lease when the tenant has the right to
vacate prior to scheduled expiration. It is common for GSA tenants pay higher rent in order to include
this option in the lease, though it is rarely (if ever) used (the GAO actually recommended the GSA stop
paying for this option because it goes unused, but the GSA appears to like it).
Figure 12: DEA - Lease Expiration Schedule by % of Total Annualized Income
Source: Company documents; STRH
2) Value Enhancing Asset Management
One of DEA’s key focuses includes efficient property management and property improvements, which
increase the asset’s value to its tenants and improve the likelihood of lease renewal. DEA’s asset
management team conducts frequent audits of existing properties to keep the facilities in optimal
condition. Moreover, DEA will work in close partnership with the tenant agencies to manage the
construction of specialized, agency-specific design enhancements. These custom build-outs typically
generate a construction management fee paid by the tenant (~15% of the construction costs). For
example, DEA recently worked in collaboration with the FBI to construct a new visitor screening facility
at the entrance of its Little Rock property. The enhancement significantly increased the security of the
facility and improved tenant access, helping solidify DEA’s relationship with the FBI (and the FBI’s
preference for the building).
In addition, DEA will seek to reduce the operating costs on properties by implementing energy efficiency
programs. These programs are designed to help the U.S. Government achieve its conservation and
efficiency goals. Currently, DEA owns 11 LEED (“Leadership in Energy & Environmental Design”) certified
buildings. Overall, we believe the in-place portfolio can generate stable organic growth of 1%-2%
annually, through rent roll-ups and cost efficiency improvements.
0.4%
5.8%
10.1% 10.5%
8.1%
65.1%
0%
10%
20%
30%
40%
50%
60%
70%
2016 2017 2018 2019 2020 Thereafter
Easterly Government Properties, Inc.
Page 13 of 38
3) Reimbursement of Operating Expense Increases
GSA leases typically provide for an annual operating cost adjustment designed to compensate the
company for operating cost increases (i.e. costs related to cleaning services, supplies, maintenance,
trash removal, landscaping, heating, electricity, etc.). This operating cost adjustment is calculated by
multiplying an operating expense base (negotiated at the commencement of the lease), by the
percentage change in the urban CPI. Moreover, many of these leases also contain a provision in the
event that the tenant vacates the property. This provision allows the tenant to reduce its operating
expense reimbursement by the portion of the property that is no longer in use. Leases structured this
way typically require the tenant to pay a modestly higher fee to account for the risk of a GSA vacancy
(which benefits Easterly given its high renewal rates).
Additionally, the tenant is required to pay for any increases in property taxes and many of DEA’s leases
include a tenant improvement allowance within base rent, which is amortized over the life of the lease
at a market rate. In general, many of DEA’s GSA leases are structured in which the tenant pays for the
majority of the costs (with the exception of insurance). Also of note, GSA leases generally require that
rent is paid monthly in arrears, whereas commercial leases typically require a payment in advance.
Easterly Government Properties, Inc.
Page 14 of 38
External Growth
Acquisitions & Development Are DEA’s Key Growth Drivers
Our positive investment thesis on the stock is largely predicated on DEA’s ability to complete accretive
acquisitions and build-to-suit developments. As previously mentioned, senior management has an
extensive network of relationships and knowledge of the GSA sector, which it can draw upon to source
both on- and off-market acquisitions. The company is very disciplined in its approach, with only very
specific assets meeting its investment criteria. We believe competition is limited within DEA’s niche,
supporting attractive acquisition/development yields and risk-adjusted returns. We are modeling $120
million of annual acquisitions at a 7% cap rate and $200 million of development over the next five years
at a 7.6% yield – consistent with management’s acquisition guidance and slightly conservative relative to
its development expectations.
Advantage of Relationships/Experience: As a group, DEA’s senior management has worked on the
acquisition of ~2.1 million sf and development of ~1.2 million sf of GSA-leased properties. Along with its
proven track record of building and operating specialized GSA buildings, DEA has a large network of
government agency relationships which provide a competitive advantage. Perhaps most notably, Senior
Advisor Joseph Moravec (former EVP of Government Relations) and EVP of Government Relations Ron
Kendall both have had previous roles within the GSA. Mr. Moravec served as the commissioner of the
Public Building Service, while Mr. Kendall served as the National Director of Leasing Policy for the Public
Building Service. We believe the perspective and relationships management has cultivated over many
years provide DEA with an important competitive advantage within its GSA real estate niche. Figure 13
reveals how fragmented the market for GSA-leased properties is and, combined with Figure 14 and
Figure 15, hints at how large the opportunity can be.
Figure 13: Top GSA Landlords By Square Footage
Source: Company documents; STRH
The Target Market: The US government is the largest employer in the world, and the largest office
tenant in the US. The General Services Administration (GSA) is an independent agency of the United
States government that helps manage and support a number of federal agencies. The GSA owns and
leases more than 377 million square feet across 9,600 buildings across the country. As illustrated in
% Market
Top 10 Owners RSF (000s) Ownership
Government Properties Trust 6,887 3.6%
The JBG Companies 5,038 2.6%
Corporate Office Properties Trust 3,776 2.0%
Vornado Realty Trust 3,752 1.9%
NGP 3,175 1.6%
Easterly Government Properties 2,417 1.3%
LCOR 2,387 1.2%
Brookfield Office Properties 2,099 1.1%
Boyd Watterson 2,085 1.1%
Urban America Advisors 2,057 1.1%
Top 10 Owners 33,673 17.4%
Total GSA-Leased RSF 193,007 100.0%
Easterly Government Properties, Inc.
Page 15 of 38
Figure 14, the square footage of property leased by the GSA has steadily increased in recent years (29%
since 1998), while the amount of federally owned space has declined by a modest amount (-1.3% since
1998). As of 2014, the GSA leased 193.4 million sf, versus the 183.4 million sf owned.
Figure 14: GSA-Leased Inventory Versus GSA-Owned Inventory
Source: Company documents; STRH
The robust growth in GSA-leased assets is a positive driver for DEA, and there are reasons to believe the
shift from owned to leased assets could continue. Much of the Government owned space is so old (47
years on average versus 12 for DEA’s portfolio) and inefficient from a space/energy usage perspective
that the properties would not qualify for a lease under the Government’s own energy efficiency
requirements. This implies that the Government would likely require significant capital expenditures in
order to bring these owned properties up to par. We think this is a strong argument for why the
government is likely continue to grow its allocation of leased properties versus owned.
Figure 15: DEA Focuses on Mission-Critical U.S. Government Agencies
Source: Company documents; STRH
• U.S. Federal Leases
• 550M rsf (55,000 locations)
• GSA Inventory
• 195M rsf (8,400 leases; 7,000 locations)
• >40,000 rsf properties
• 125M rsf (1,050 leases; 950 Locations)
• Target Market: Single Tenant Leased
• 70M rsf (500 Leases & Locations)
Easterly Government Properties, Inc.
Page 16 of 38
As discussed earlier, management maintains a proprietary database of GSA-leased properties and knows
exactly which roughly 500 meet its investment criteria (see Figure 15 and the detailed description). DEA
is only focusing on about 12% of the existing federal lease market right now or ~35% of total GSA
inventory. Management has stated that its acquisition pipeline remains robust at about $700 million,
including approximately $200 million in active discussions.
Acquisitions: Management has guided towards a long term acquisition target of $75-$125 million. That
said, DEA closed $171 million of acquisitions in 2015 and is now guiding to $175 million in 2016,
following a $97.4 million portfolio purchase in 3Q16 which brought year-to-date activity to $129 million.
There is certainly no guarantee that DEA will continue to outpace acquisition volume expectations, but
the past two years suggest there could be upside.
DEA recently announced the off-market acquisition of a four-property portfolio totaling 302,000 sf for
$97.4 million. Below, we provide a brief description of the four properties, the first three of which
closed on 7/1/16, while the final property (FBI–Albany) is expected to close in 4Q16. We think this
portfolio is a good example of the types of properties DEA owns and will look to own in the future.
 DEA – Birmingham: This build-to-suit was completed in 2005 and houses one of three DEA district
offices within the New Orleans Division and one of four Alabama field offices for the Bureau of
Alcohol, Tobacco, Firearms and Explosives (“ATF”). The property encompasses 35,616 sf and is
100% leased to the GSA through 2020. It features 90-foot setbacks, holding cells, anti-climb security
fencing and a fenced sally port.
 EPA – Kansas City: This 71,979 sf build-to-suit laboratory was completed in 2003, is LEED gold and is
100% leased to the GSA through 2023. This EPA laboratory is one of 10 in the region and serves as a
special-purpose laboratory where scientists perform chemical and biological analyses using state of
the art instruments.
 FBI – Birmingham: This 96,278 sf property is one of the 56 field offices of the FBI and is 100% leased
to the GSA through 2020. The build-to-suit property was completed in 2005 and possesses a
number of security features including 100-foot setbacks, reinforced security fencing and vehicle
barriers, and redundant power systems.
 FBI – Albany: This 98,184 sf property is one of the 56 field offices of the FBI and one of two in
Albany; it is 100% leased to the GSA through 2018 and was acquired for $20.2 million. The build-to-
suit property was completed in 1998, and possesses security features including 100-foot setbacks,
reinforced security fencing and vehicle barriers, blast-resistant envelope and window features, and
intrusion detection systems. FBI–Albany is responsible for the oversight of eight resident FBI
agencies in the region.
Easterly Government Properties, Inc.
Page 17 of 38
Figure 16: DEA - Birmingham Figure 17: EPA – Kansas City
Source: SNL Financial; STRH
Figure 18: FBI - Birmingham Figure 19: FBI – Albany
Source: Company Reports; STRH
Development: Management recently announced an FDA laboratory build-to-suit in Alameda CA, and
suggested to us that it could develop around $250 million of assets at high-7% initial yields over the next
five years. The company will not take any speculative development risk and will require at least 10 years
of lease term for any build-to-suit project.
Dispositions: DEA has not sold any properties since it became a public company early last year.
However, we think there are few properties that could become a source of funds in the medium-term,
including perhaps two SSA properties in California which total about 1% of DEA’s total rental revenue.
External Growth Assumptions. We are modeling $174 million of 2016 acquisitions (including $122
million in 2H16) at a 7.3% cap rate, in line with management’s guidance of $175 million. We assume
$120 million of acquisition in each future year, at a 7.0% cap rate. This is consistent with management’s
suggestion of $75-$125 million per year, despite higher recent volume. Our model does not include any
property dispositions until 2020 ($60 million at a 7.5% cap rate). We are assuming $200 million of
developments at a 7.6% yield over the next five years, slightly conservative relative to the $250 million
that management suggested it could do.
Easterly Government Properties, Inc.
Page 18 of 38
Figure 20: DEA NOI Growth Profile
Source: Company documents; STRH
- 0 1 2 2 3
7
-
4
15
26
39
52
65
- - - - - - --
10
20
30
40
50
60
70
2015 2016E 2017E 2018E 2019E 2020E 2021E
Internal NOI External NOI Base NOI
Easterly Government Properties, Inc.
Page 19 of 38
Earnings and NAV Estimates
Funds From Operations: Our 2016 FFO estimate is $1.19 per share, or $1.23ps on a normalized basis
(which excludes acquisition costs). This is at the low end of management’s $1.19-$1.23ps guidance and
a penny per share below the $1.20ps consensus (we believe the consensus reflects estimated
transaction costs, but cannot be certain). Our 2017 FFO estimate is $1.22ps, or $1.24ps on a normalized
basis, versus the consensus of $1.27ps.
Our estimates imply 14.3% YOY normalized FFO growth in 2016, largely driven by $174 million of
acquisitions, and only 0.6% growth in 2017, impacted by higher interest expense and assumed equity
issuance. We conservatively model an equity raise in early 2017, and development spending that does
not generate resulting NOI until late-2018, weighing on 2017 growth. We project 4.5% annual
normalized FFO growth from 2016-2021, which ranks sixth within our 13-company office coverage
universe.
Figure 21: DEA NAREIT FFOps
Source: Company documents; SNL Financial; STRH
Figure 22: DEA FFOps Beats and Misses
Source: Factset; STRH
$1.04
$1.19
$1.22 $1.25 $1.32
$1.41
$1.52
0%
2%
4%
6%
8%
10%
12%
14%
16%
$0.00
$0.20
$0.40
$0.60
$0.80
$1.00
$1.20
$1.40
$1.60
2015 2016E 2017E 2018E 2019E 2020E 2021E
NAREIT FFO FFO Growth (YoY % chg)
Easterly Government Properties, Inc.
Page 20 of 38
Funds Available for Distribution: Long leases and very low tenant rollover, as well as tenant
improvements paid for by tenants, should support healthy cash flow. We estimate FAD of $0.97 per
share in 2016 and $1.03ps in 2017, implying a 15.9% YOY increase in 2016 followed by 6.1% growth. Our
model implies 7.2% annual FADps growth from 2016-2021. Management aims to pay a common
dividend as close to 100% of cash flow as possible, which means similar dividend growth (the current
dividend yield is 5.0%).
Figure 23: DEA Income Statement ($ thousands)
Source: Company documents; STRH
Easterly Government Properties, Inc
SunTrust Robinson Humprey
2015 1Q16 2Q16 3Q16E 4Q16E 2016E 2017E 2018E 2019E 2020E 2021E
Revenues
Rental revenue 72,728 21,736 22,291 22,526 22,526 89,080 89,977 89,621 89,669 91,315 95,805
Tenant reimbursements 6,883 2,155 2,476 2,129 2,460 9,220 9,173 10,058 10,304 10,535 10,747
Expansion portfolio 1,999 3,118 5,117 20,454 34,359 52,822 69,598 83,003
Other income 212 80 154 101 102 437 418 431 444 457 471
Total revenues 79,823 23,971 24,921 26,755 28,207 103,853 120,023 134,469 153,238 171,904 190,027
Expenses
Property operating expenses 14,743 4,333 5,085 4,731 4,731 18,879 18,918 18,798 18,853 19,199 20,142
Expansion portfolio 600 935 1,535 6,136 10,308 15,846 20,879 24,901
Real estate taxes 7,786 2,368 2,332 2,410 2,545 9,656 9,717 9,601 9,595 9,679 10,060
Depreciation and amortization 37,662 10,863 11,074 11,074 11,074 44,085 44,296 44,296 44,296 44,296 44,296
Depreciation and amortization - expansion portfolio 817 1,512 2,329 10,055 16,856 25,204 30,673 34,338
Acquisition costs 1,670 333 346 772 452 1,903 1,200 1,200 1,200 1,200 1,200
General, administrative and leasing expenses 8,941 3,036 3,052 3,050 3,060 12,198 12,712 13,166 13,817 14,646 15,520
Impairment losses 0 0 0 0 0 0 0 0 0
Other expenses 0 0 0 0 0 0 0 0 0
Total operating expenses 70,802 20,933 21,889 23,454 24,309 90,585 103,035 114,225 128,810 140,573 150,457
Net Operating Income 57,294 17,270 17,504 19,014 19,995 73,783 85,251 95,763 108,944 122,147 134,924
Operating income 9,021 3,038 3,032 3,301 3,897 13,268 16,988 20,244 24,428 31,332 39,570
Interest expense, net (5,559) (1,929) (1,995) (2,255) (2,601) (8,780) (11,363) (13,924) (16,885) (18,240) (20,070)
Interest expense - expansion portfolio - - 0 0 0 0 0 0
Interest and other income 0 0 0 - - 0 0 0 0 0 0
Loss on early extinguishment of debt 0 0 0 0 0 0 0 0 0 0 0
Loss on interest rate derivatives 0 0 0 0 0 0 0 0 0 0
Equity in income of unconsolidated entities 0 0 0 - - 0 0 0 0 0 0
Income tax expense 0 - - 0 0 0 0 0 0 0 0
Income from continuing operations 3,462 1,109 1,037 1,046 1,296 4,488 5,625 6,320 7,543 13,092 19,500
Discontinued operations 0 0 0 0 0 0 0 0 0 0 0
Gain on sales of real estate 0 0 0 0 0 0 0 0 0 0 0
Net income (loss) 3,462 1,109 1,037 1,046 1,296 4,488 5,625 6,320 7,543 13,092 19,500
Net (income) loss attributable to noncontrolling interests
Common units in LP 0 0 0 0 0 0 (585)
Preferred units in LP 0 0 0 0 0 0 0
Non-controlling interest in OP (1,355) (434) (338) (408) (506) (1,685) (2,194) (2,465) (2,942) (5,106) (7,605)
Preferred share dividends 0 0 0 0 0 0 0 0 0
Issuance costs associated with redeemed preferred shares 0 0 0 0 0 0 0 0 0
Net income attributable to DEA common shareholders 2,107 675 699 638 791 2,803 3,431 3,855 4,601 7,986 11,3100.05
FFO
Real estate-related depreciation and amortization 37,662 10,863 11,074 11,891 12,586 46,414 54,351 61,152 69,500 74,969 78,634
Gain on sales of real estate (from continuing ops.) 0 0 0 0 0 0 0 0 0 0 0
Depreciation and amortization of unconsolidated real estate entities 0 0 0 0 0 0 0 0 0 0 0
Impairment losses on previously depreciated operating properties 0 0 0 0 0 0 0 0 0 0 0
Non-controlling Interests - preferred units in the OP 0 0 0 0 0 0 0 0 0 0 0
FFO allocable to other noncontrolling interests 0 0 0 0 0 0 0 0 0 0 0
FFO allocable to restricted shares 0 0 0 0 0 0 0 0 0 0 0
FFO attributable to preferred 0 0 0 0 0 0 0 0 0 0 0
Basic FFO (NAREIT) 41,124 11,972 12,111 12,937 13,882 50,902 59,977 67,473 77,042 88,061 98,134
Dividends on dilutive conv. prefs 0 0 0 0 0 0 0 0 0 0
Distributions on dilutive pref units in the OP 0 0 0 0 0 0 0 0 0 0
Diluted FFO (NAREIT) 41,124 11,972 12,111 12,937 13,882 50,902 59,977 67,473 77,042 88,061 98,134
Topic D-42 Charges 0 0 0 0 0 0 0 0 0 0 0
Early Retirement of Debt 0 0 0 0 0 0 0 0 0 0 0
Operating property acquisition costs 1,670 333 346 772 452 1,903 1,200 1,200 1,200 1,200 1,200
Impairment Losses / Gains on Real Estate 0 0 0 0 0 0 0 0 0 0 0
Other non recurring/ M2M gains/losses 0 0 0 0 0 0 0 0 0 0 0
FFO - Normalized 42,794 12,305 12,457 13,709 14,334 52,805 61,177 68,673 78,242 89,261 99,334
Straight-line rent & above/below mrkt amort (5,680) (1,710) (1,666) (1,680) (1,680) (6,736) (6,720) (6,720) (6,720) (6,720) (6,720)
TI/LC and recurring Cap Ex (508) (75) (252) (181) (147) (654) (873) (1,080) (1,142) (1,106) (1,894)
Other and other depreciation (1,680) (508) (517) (452) (412) (1,889) (1,537) (1,243) (902) (746) (536)
Diluted FAD 33,256 9,679 9,676 10,625 11,643 41,623 50,846 58,430 68,278 79,489 88,984
Weighted-average shares outstanding-diluted (FFO NAREIT) 39,702 39,712 40,964 44,447 45,197 42,861 49,352 54,189 58,189 62,439 64,689
Weighted-average shares outstanding-diluted (FFO norm.) 39,702 39,712 40,964 44,447 45,197 42,861 49,352 54,189 58,189 62,439 64,689
Diluted shares at period end 39,712 39,712 44,447 44,447 45,947 45,947 50,689 54,689 58,689 64,689 64,689
FFO per Share - "NAREIT" (diluted) $1.04 $0.30 $0.30 $0.29 $0.31 $1.19 $1.22 $1.25 $1.32 $1.41 $1.52
FFO per share as adjusted, as reported $1.00 $0.29 $0.29 $0.29 $0.30 $1.16 $1.19 $1.23 $1.31 $1.40 $1.51
Normalized FFO per share $1.08 $0.31 $0.30 $0.31 $0.32 $1.23 $1.24 $1.27 $1.34 $1.43 $1.54
Cash Available for Distribution, as reported $0.89 $0.26 $0.25 $0.25 $0.27 $1.04 $1.09 $1.13 $1.22 $1.32 $1.42
Diluted FAD per share $0.84 $0.24 $0.24 $0.24 $0.26 $0.97 $1.03 $1.08 $1.17 $1.27 $1.38
DIV per Share $0.65 $0.22 $0.23 $0.23 $0.23 $0.91 $0.96 $1.04 $1.12 $1.16 $1.24
Easterly Government Properties, Inc.
Page 21 of 38
Net Asset Value: We estimate Easterly’s NAV at $16.97 per share based on a nominal cap rate of 6.8%.
At the current stock price, DEA is trading at a 6.2% implied cap rate and an 11% premium to NAV, versus
a 9% simple average discount for our office coverage universe. We estimate DEA is trading at the highest
P/NAV in our 13-company office coverage universe (HIW is next and trades at an 8% premium to NAV).
Figure 24: DEA Net Asset Value ($ thousands)
Source: Company documents; STRH
Easterly Government Properties, Inc
SunTrust Robinson Humprey
Net Asset Value
in $ thousands 2Q16 2Q17E
NAV per Share $16.97 $17.64
Forward Twelve-Month NOI $70,571 $84,167
Less: Straight-line rent (6,720) (6,720)
Forward Twelve-Month Cash NOI $63,851 $77,447
Nominal Cap Rate 6.75% 6.83% 6.75%
Real Estate Value $945,934 $1,147,359
Management & Other Fee Income $410 $424
Cap Rate 10.00% 10.00%
Value of Management Income $4,101 $4,244
Cash & Cash Equivalents $83,057 $81,313
Accounts Receivable $10,629 $10,629
Other Tangible Assets $1,469 $979
Accounts Payable and Other Liabilities (9,949) (9,949)
Other Assets/Liabilities $85,206 $82,972
Gross Asset Value $1,035,240 $1,263,146
Senior Unsecured Notes $0 $1
Unsecured Term Loans $0 $100,000
Line of Credit $198,167 $205,000
Mortgage Notes Payable $82,289 $82,290
Mark-to-Market Debt Adjustment 363 (809)
Perpetual Preferred Stock 0 0
Long Term Debt/Preferred $280,819 $386,483
Net Asset Value $754,421 $876,663
Shares Outstanding 44,447 49,697
Fully Diluted Shares & Units Outstanding 44,447 49,697
Net Asset Value / Share $16.97 $17.64
Current Stock Price $18.84 $18.84
Premium / Discount to NAV 11.0% 6.8%
Implied Cap Rate 6.2% 6.4%
Applied Value / Sq. Ft. $342 $344
Implied Value / Sq. Ft. $372 $361
Easterly Government Properties, Inc.
Page 22 of 38
Balance Sheet and Leverage
DEA maintains one of the most conservative capital structures in our office REIT coverage universe.
Specifically, the company has among the very lowest net debt-to-EBITDA (4.9x at 2Q16), net debt-to-
GAV (25%) and net debt-to-total market cap (31%) ratios in the group. Management is targeting 40%
D/TEV and 6x D/EBITDA. The company’s capital position provides some runway to execute on its
external growth initiatives, though we expect a return to the capital markets in the near-term, assuming
investment opportunities continue to emerge.
Figure 25: DEA Capital Structure ($ Billions)1
Note
1
: as of 2Q/16;
Source: Company documents; SNL Financial; STRH
Figure 26: Office comps: Net Debt/EBITDA1
Figure 27: Office comps: Net Debt/GAV1
Note 1: As of 2Q/16
Source: Factset; SNL Financial; STRH
Net Debt $0.3Equity Market
Cap $0.8
4.5x
4.9x 5.0x
6.0x 6.2x
6.6x
6.9x
7.3x
7.6x 7.7x
8.0x
9.1x
9.4x
0x
1x
2x
3x
4x
5x
6x
7x
8x
9x
10x
CUZ
DEA
HIW
BXP
PDM
WRE
BDN
FPO
OFC
CLI
SLG
VNO
NYRT
25%
28%
30%
33%
35% 36%
39% 41%
41%
45% 46% 48%
53%
0%
10%
20%
30%
40%
50%
60%
DEA CUZ BXP HIW WRE PDM VNO NYRT SLG OFC BDN CLI FPO
Easterly Government Properties, Inc.
Page 23 of 38
DEA’s debt maturities are well-laddered such that no significant mortgages come due over the next five
years, as illustrated in Figure 28. The only significant maturity during that period is the $198 million
drawn (as of 2Q16) on the $400 million credit facility, which accounted for 71% of all debt outstanding
as of 2Q16 and matures in 2019. Notably, DEA closed a $100 million, seven-year unsecured term loan at
L+170 earlier this month (included in our estimates, but not the maturity schedule below) and we are
modeling $75 million of new equity in 2017.
Figure 28: DEA Debt Maturity Schedule ($ millions)1
Note 1:Of the 2019 debt maturities, $198.2M is in the form of a unsecured revolving credit facility
Source: Company documents; STRH
$1.4 $3.0 $3.1
$201.4
$3.4
$67.7
$0
$50
$100
$150
$200
$250
2016 2017 2018 2019 2020 Thereafter
$M
Easterly Government Properties, Inc.
Page 24 of 38
Figure 29: DEA Balance Sheet ($ thousands)
Source: Company documents; SNL Financial; STRH
Easterly Government Properties, Inc
SunTrust Robinson Humprey
2015 1Q16 2Q16 3Q16E 4Q16E 2016E 2017E 2018E 2019E 2020E 2021E
BALANCE SHEET
ASSETS
Real estate properties 788,597 819,934 835,860 913,092 958,292 958,292 1,078,557 1,227,607 1,405,276 1,522,909 1,641,316
Accumulated depreciation (16,590) (22,054) (27,683) (39,574) (52,160) (52,160) (106,511) (167,664) (237,163) (312,132) (390,766)
Construction and redevelopment in progress, including land 0 0 0 0 0 0 0 0
Land held for future development and pre-construction costs 0 0 0 0 0 0 0 0 0
Total properties, net 772,007 797,880 808,177 873,518 906,132 906,132 972,046 1,059,944 1,168,113 1,210,777 1,250,549
Assets held for sale, net 0 0 0 0 0 0 0 0 0
Cash and cash equivalents 8,176 4,380 3,704 11,910 5,967 5,967 4,882 5,728 4,204 28,289 3,962
Restricted cash 1,736 1,521 79,353 79,353 79,353 79,353 79,353 79,353 79,353 79,353 79,353
Rents receivable 6,629 6,920 6,920 6,920 6,920 6,920 6,920 6,920 6,920 6,920
Accounts receivable 2,920 3,832 3,709 3,709 3,709 3,709 3,709 3,709 3,709 3,709 3,709
Deferred financing, net 2,767 2,511 2,296 2,296 2,296 2,296 2,296 2,296 2,296 2,296 2,296
Intangible assets, net 115,198 111,728 111,728 111,728 111,728 111,728 111,728 111,728 111,728 111,728
Prepaid expenses and other assets 1,509 2,723 1,958 1,958 1,958 1,958 1,958 1,958 1,958 1,958 1,958
Total assets 789,115 934,674 1,017,845 1,091,392 1,118,063 1,118,063 1,182,892 1,271,636 1,378,281 1,445,030 1,460,476
Liabilities and equity
Revolving credit facility 154,417 184,417 198,167 283,167 205,667 205,667 285,000 300,000 310,000 290,000 295,000
Mortgage notes payable 83,020 82,289 82,290 82,290 82,290 82,290 142,290 202,290 202,290 262,290
Unsecured debt 3 100,002 100,002 100,002 100,002 100,002 100,002 100,002
Accrued expenses 0 0 0 0 0 0 0 0
Rents received in advance and security deposits 0 0 0 0 0 0 0 0
Dividends and distributions payable 0 0 0 0 0 0 0 0
Deferred revenue associated with operating leases 0 0 0 0 0 0 0 0
Intangible liabilities, net 44,605 44,081 42,119 42,119 42,119 42,119 42,119 42,119 42,119 42,119 42,119
Accounts payable and accrued liabilities 9,346 10,211 9,949 9,949 9,949 9,949 9,949 9,949 9,949 9,949 9,949
Total liabilities 208,368 321,729 332,524 417,528 440,027 440,027 519,360 594,360 664,360 644,360 709,360
Commitments and contingencies 0 0 0 0 0 0 0 0
Redeemable noncontrolling interest 0 0 0 0 0 0 0 0
Equity
Common stock, par value 241 241 346
Preferred stock 0 0 0 0 0 0 0 0
Additional paid-in capital 391,767 392,180 560,072
Retained (deficit) (1,694) (1,019) (320)
Cumlative dividends (13,051) (18,368) (25,857)
Total stockholders' equity 377,263 373,034 534,241 522,784 526,956 526,956 512,452 526,196 562,841 649,590 600,036
Non-controlling interests
Non-controlling interest in operating partnership 242,631 239,911 151,080 151,080 151,080 151,080 151,080 151,080 151,080 151,080 151,080
Preferred units in LP - 0 0 - - - - - - - -
Other consolidated entities 0 0 0 0 0 0 0 0 0 0 0
Noncontrolling interests 242,631 239,911 151,080 151,080 151,080 151,080 151,080 151,080 151,080 151,080 151,080
Total Equity 619,894 612,945 685,321 673,864 678,036 678,036 663,532 677,276 713,921 800,670 751,116
Total liabilities and equity 828,262 934,674 1,017,845 1,091,392 1,118,063 1,118,063 1,182,892 1,271,636 1,378,281 1,445,030 1,460,476
Easterly Government Properties, Inc.
Page 25 of 38
High Dividend Yield (and Payout Ratio)
DEA’s most recent quarterly dividend of $0.23 per share was paid on September 13 to shareholders of
record as of August 26. The company has already increased the quarterly dividend to $0.21ps in 3Q15,
to $0.22ps in 4Q15 and to the current $0.23ps in 2Q16.
The annualized dividend of $0.92 per share implies a current yield of 5.0% and equates to 90% of our
2017 FAD estimate of $1.03 per share. The yield is the highest in our office coverage universe (simple
average of 3.8%; range of 2.2% to 5.0%), while the 5-year FFO growth outlook (4.5%) is just above the
office comp average (4.3%). Management intends to pay close to all of its cash flow as dividends.
Based on our earnings estimates and assuming a FAD payout ratio in the mid-90% range, we project
6.4% annual dividend growth from 2016-2021. The current yield ranks first out of the 13 companies in
our office coverage universe, while the 2016 FAD coverage is 9th and the 2017 FAD coverage is 11th.
Figure 30: DEA Dividend per Share and Normalized Dividend Growth
Source: FactSet; Company documents; STRH
Figure 31: Office REIT Dividend Yields
Source: FactSet; Company documents; STRH
0%
2%
4%
6%
8%
10%
$0.00
$0.05
$0.10
$0.15
$0.20
$0.25
$0.30
$0.35
2Q15
4Q15
2Q16
4Q16E
2Q17E
4Q17E
2Q18E
4Q18E
2Q19E
4Q19E
2Q20E
4Q20E
2Q21E
4Q21E
Dividends per Share (LHS) Dividend Growth (YoY % chg, RHS)
0%
1%
2%
3%
4%
5%
6%
BXP CLI VNO SLG WRE CUZ OFC PDM BDN FPO HIW NYRT DEA
Easterly Government Properties, Inc.
Page 26 of 38
Management Team
Much of DEA’s competitive advantage is derived from its relationships and track record serving GSA
properties. The company has deep knowledge/understanding of the GSA procurement process,
protocols and culture. It also has a staff of personnel who can collaborate with the U.S. government and
are qualified to service these GSA properties. We view this as an advantage over many other
developers/landlords, effectively limiting the pool of competitors. DEA should continue to strengthen its
position as a go-to GSA landlord, as it continues to acquire/develop properties within this niche.
DEA has adopted what we consider shareholder-friendly corporate governance. The company is
internally managed, has no poison pill or staggered Board, has opted out of the Maryland Unsolicited
Takeover Act (which permits Boards to stagger its members without shareholder approval) and has a
majority of independent directors. There is no stockholder rights plan, and there are fully independent
audit/compensation and corporate governance committees.
William C. Trimble, III – Chief Executive Officer, President and Director
Mr. Trimble, is the company’s Chief Executive Officer, President and a member of the board of directors.
He co-founded Easterly Partners, LLC in 2011 and was the CEO and managing partner until DEA’s IPO in
February 2015. Previously, from April 2009 to August 2011, Mr. Trimble was the COO of PRP LLC, an
investment firm that managed funds that invested in properties leased to the GSA. Mr. Trimble also
worked for 10 years at Red Comb LLC as the head of client relations and five years as the head of
marketing at Winston Capital Management. Mr. Trimble earned his MBA and BA from Duke University.
Darrell W. Crate – Chairman of the Board of Directors
Mr. Crate was co-founder and Managing Partner of Easterly Capital in September 2009. From 1998 to
2011, he served as the CFO of Affiliated Managers Group, Inc (NYSE: AMG), a publicly-traded asset
management company. Prior to that, he was the Managing Director of the Financial Institution Group of
the Chase Manhattan Corporation. Mr. Crate also serves as a member of the executive committee of
the Board of Trustees of Bates College, and as the Vice Chairman of the Aircraft Owners and Pilots
Association. He serves on the advisory board of the Robert F. Kennedy Children’s Action Corps. Mr.
Crate earned his BA from Bates College and his MBA from Columbia Business School.
Michael Ibe – Vice-Chairman of the Board of Directors / EVP– Development and Acquisitions
Mr. Ibe is the Executive Vice-President of Development and Acquisitions and also serves as Vice
Chairman on the Board of Directors. In 1987, he co-founded Western Devcon, and served as the
President. Prior to that, he was the Vice President of Construction at Ibe Investments from 1980 to
1987. From 1970 to 1980, he worked at Lampco Industries as a vice president and general manager.
Mr. Ibe attended Mesa College and San Diego State University.
Meghan Baivier – EVP – Chief Financial Officer and Chief Operating Officer
Ms. Baivier currently serves as EVP, CFO (since May 2016) and COO (since May 2015). Previously, she
served as a VP for Citigroup’s Real Estate and Lodging investment banking group from August 2010 to
April 2015. Prior to that, Ms. Baivier was an Equity Research Associate with Chilton Investment Co. from
March 2005 to June 2007. Ms. Baivier began her career with Fidelity Management and Research as a
High Yield Research Associate. She received her MBA from Columbia Business School and her BA from
Wellesley College.
Easterly Government Properties, Inc.
Page 27 of 38
Alison Bernard– EVP – Chief Accounting Officer
Ms. Bernard was the company’s Chief Financial Officer from 2012 (Easterly Partners) through the
February 2015 IPO, before being named Chief Accounting Officer in March 2016. In 2011, Ms. Bernard
was employed at Summit Partners in the General Partner Services Group and from 2008 to 2011, she
was employed at PricewaterhouseCoopers. Ms. Bernard earned her MS in accounting from Boston
College and BA from the College of the Holy Cross. She is also a licensed CPA.
Ronald Kendall– EVP – Government Relations
Mr. Kendall currently serves as EVP – Government Relations. He joined the company’s predecessor in
2014 and was previously the president of Ron Kendall & Associates, a company that provides strategic
and tactical consulting to organizations pursuing or renewing federal real estate contracts. From 2010
to 2011, he served as a staff director at the US House of Representatives in the Transportation and
Infrastructure Committee, Subcommittee on Economic Development, Public Buildings, and Emergency
Management. Prior to that, Mr. Kendall directed the long-range facilities planning activities of the
federal Judiciary at the Administrative Office of the U.S. Courts from 2005-2010. Mr. Kendall earned his
MPA from American University and his BA from the University of Rochester.
Figure 32: Easterly’s Board of Directors
Source: Company documents; SNL Financial; STRH
Management Compensation
DEA has a compensation committee, which consists of the four independent directors, chaired by Mr.
Binnie. The primary functions of the committee include:
1) Reviewing and approving annual corporate goals and objectives relevant to the CEO’s
performance and determining/approving remuneration based on those objectives;
2) Reviewing and approving compensation for other executives and senior officers;
3) Implementing and administering incentive compensation and equity-based remuneration plans;
4) Reviewing, evaluating and recommending change to director compensation plans.
Figure 33: Easterly’s 2015 Executive Compensation
Note
1
: Includes matching 401K plans from February 11, 2015 through December 31, 2015
Source: Company documents, STRH, SNL Financial, as of 2015 Proxy
Name Position Age Independent
William C. Trimble III Chief Executive Officer, President and Director 54 -
Darrell W. Crate Chairman of the Board of Directors 49 -
Michael P. Ibe Vice Chairman of the Board of Directors & EVP - Development & Acquisitions 69 -
William H. Binnie Director 58 Yes
Cynthia A. Fisher Director 55 Yes
Emil W. Henry, Jr. Director 55 Yes
James E. Mead Director 56 Yes
Average Age 57
Name Base Salary Bonus
Other Annual
Comp.
Stock Granted1
Total
Darrell W. Crate $111,538 $125,000 $0 $1,950,750 $2,187,288
Michael P. Ibe $111,538 $125,000 $6,764 $1,950,750 $2,194,052
William C. Trimble III $223,077 $250,000 $2,427 $2,921,790 $3,397,294
Easterly Government Properties, Inc.
Page 28 of 38
The company has a long-term incentive plan (LTIP) that pays out based on DEA’s annualized shareholder
return from IPO through 2017 (no payout up to 8% and full payout at or above 16%), as well as
performance relative to the NAREIT US Equity REIT index (no payout up to 95% and full payment at or
above 125%). The payout will range from 0% to 5% of the company at IPO. We are modeling the
midpoint by assuming 1 million shares are issued at the end of 2017.
Insider Ownership
Vice Chairman Darrell Crate is the largest direct inside owner with 91,453 shares (nearly 0.3% of the
outstanding shares), worth ~$1.8 million. CEO William Trimble and Director Cynthia Fisher each have
ownership stakes valued at about ~$1.5 million.
Figure 34: Easterly Direct Insider Ownership
Source: Company data, STRH, Bloomberg, Market value and share positions as of 10/17/2016
Name Position Market Value ($) Shares Out (%)
Crate Darrell W 91,453 $1,734,854 0.26%
Trimble III William C. 81,713 $1,550,087 0.23%
Fisher Cynthia A. 80,247 $1,522,278 0.23%
Mead James E. 32,699 $620,297 0.09%
Binnie William H 10,699 $202,959 0.03%
Henry Emil W 10,699 $202,959 0.03%
Ibe Michael P. 10,000 $189,699 0.03%
Bernard Alison M. 510 $9,675 0.00%
Easterly Government Properties, Inc.
Page 29 of 38
Valuation
DEA trades at 15.3x 2016 normalized FFO, a 1% premium to our office coverage universe simple average
(15.2x), and 18.2x 2016 FAD, a 30% discount (24.4x). We think relative multiples can improve a bit, due
to the company’s competitive earnings growth, low financial leverage and low-volatility earnings.
Increasing the size of the company should also help reduce volatility/risk. The stock currently trades at
111% of our $16.97 NAV estimate, versus 91% on average for our office coverage universe (notably,
DEA’s own transactions are heavily considered in triangulating our 6.8% assumed cap rate). Our 12-
month price target of $21 (methodology below) implies 16.9x 2017 FFO and 20.4x 2017 FAD.
Figure 35: Historical P/FFO Multiples Figure 36: Historical P/NAV
Source: Factset; SNL Financial; STRH
Figure 37: Price/2016E Norm. FFO Comparison Figure 38: Price/2016E FAD Comparison
Source: Factset; SNL Financial; STRH
10
12
14
16
18
1Q15
2Q15
3Q15
4Q15
1Q16
2Q16
3Q16
Current
DEA P/FFO Peer Average P/FFO
-25%
-20%
-15%
-10%
-5%
0%
5%
10%
15%
Mar-15
Jun-15
Sep-15
Dec-15
Mar-16
Jun-16
Sep-16
DEA Peer Average
8.6
10.1
11.9 12.3 12.9
13.7
15.1 15.3 15.6
17.1
19.7
21.1
23.5
0
5
10
15
20
25
FPO
CUZ
BDN
CLI
PDM
OFC
SLG
DEA
HIW
WRE
VNO
BXP
NYRT
10.8
15.9 16.8 16.9 18.2
19.6 20.4
23.1
30.5 31.6 32.2
37.8
43.3
0
5
10
15
20
25
30
35
40
45
50
FPO
PDM
BDN
OFC
DEA
SLG
WRE
HIW
CLI
NYRT
BXP
CUZ
VNO
Easterly Government Properties, Inc.
Page 30 of 38
Figure 39: NAV Premium/(Discount) Comparison1
Figure 40: Applied Cap Rate Comparison
Note 1: NAV as of 2Q/16; CUZ cap rate reflects 2Q/17E
Source: Factset; SNL Financial; STRH
We expect DEA’s 2016-2021 annual FFOps growth to rank fifth out of the 13 office REITs we cover, while
its P/2016E FFO multiple is the eighth-lowest, resulting in the third-most attractive PEG ratio. DEA has
the sixth-highest FAD growth and fifth-lowest multiple for a PEG ratio that ranks fourth-most attractive.
We consider the stock’s growth undervalued, particularly considering its below-average financial
leverage (second-lowest net D/EBITDA; as of 2Q16).
Figure 41: P/2016 FFO vs ’16-’21 FFO Growth Figure 42: P/2016 FAD vs ’16-’21 FAD Growth
Source: Factset; SNL Financial; STRH
-26% -25%
-19%
-15%
-10% -10%
-8% -8% -7% -6%
-3%
8%
11%
-30%
-25%
-20%
-15%
-10%
-5%
0%
5%
10%
15% FPO
SLG
VNO
NYRT
BXP
CLI
OFC
PDM
BDN
WRE
CUZ
HIW
DEA
7.4%
7.0% 7.0% 6.8% 6.8% 6.4% 6.3% 6.1% 6.0%
4.8% 4.6% 4.5% 4.4%
0%
1%
2%
3%
4%
5%
6%
7%
8%
CLI
FPO
OFC
DEA
BDN
CUZ
HIW
WRE
PDM
BXP
VNO
NYRT
SLG
Average 6.0%
0x
5x
10x
15x
20x
25x
0% 1% 2% 3% 4% 5% 6% 7%
Price/2016Norm.FFO
Annual Normalized FFO Growth '16-'21
BXPNYRT
VNO
SLG
WRE
CUZ
HIW
OFC
BDN
PDM
FPO
CLI
DEA
0x
5x
10x
15x
20x
25x
30x
35x
40x
45x
50x
0% 5% 10% 15% 20% 25%
Price/2016FAD
Annual FAD Growth '16-'21
BXP
NYRT
VNO
SLG
WRE
CUZ
HIW
OFC BDNPDM
FPO
CLI
DEA
Easterly Government Properties, Inc.
Page 31 of 38
Figure 43: Office Comp Sheet1
Note
1
: CUZ NAV and cap rates are as of 2Q17, reflects Houston spin-off; GOV FFO/FAD estimates are consensus
Source: SNL Financial; Factset; STRH
Strong Risk-Adjusted Return Since IPO
Since DEA’s IPO in February 2015, the stock is up 30.3% versus 4.5% for the MSCI US REIT Index (RMS).
Over that time, the stock has also outperformed the more government-focused office REITs, GOV and
OFC, by 23.3pps and 31.0pps, respectively. However, while topping the RMZ year-to-date (9.7% versus
4.1%), it has lagged GOV (31.8%) and OFC (26.8%).
Figure 44: Easterly Total Return vs. SNL US REIT Equity and SNL US REIT Office
Source: SNL Financial; STRH
U.S. REITs Comp Sheet
SunTrust Robinson Humphrey
Equity Prem./ Applied Implied Net debt
Stock Target Market NAV Disc. Cap Cap Div. + Pref /
Ticker Rating Price Price Cap 2016E 2017E 2016E 2017E 2016E NAV Rate Rate Yield EBITDA
($ Bn) (x) (x) (x) (x) ($) (%) (%) (%) (%) (x)
BDN Buy $15.35 $18.00 $2.7 11.9x 10.7x 16.8x 15.7x $16.50 (7.0%) 6.75% 7.07% 4.2% 6.9x
BXP Hold $126.51 $137.00 $19.4 21.1x 19.9x 32.2x 27.8x $141.19 (10.4%) 4.80% 5.21% 2.1% 6.0x
CLI Hold $26.26 $28.00 $2.6 12.3x 12.3x 30.5x 29.9x $29.21 (10.1%) 7.35% 7.84% 2.3% 7.7x
CUZ Buy $7.91 $9.00 $1.7 10.1x 12.5x 37.8x 20.4x $12.34 (35.9%) 6.25% 6.44% 4.0% 4.5x
DEA Buy $18.84 $21.00 $0.8 15.3x 15.2x 19.4x 18.3x $16.97 11.0% 6.75% 6.26% 4.9% 4.9x
FPO Buy $8.89 $11.00 $0.5 8.6x 10.2x 10.8x 14.5x $12.05 (26.2%) 7.00% 8.06% 4.5% 7.3x
GOV NR $20.92 NR $1.5 9.0x 9.4x 12.7x 13.2x $20.04 4.4% 7.73% NR 8.2% 7.1x
HIW Hold $50.58 $53.00 $5.1 15.6x 15.0x 23.1x 21.1x $46.88 7.9% 6.30% 5.95% 3.4% 5.0x
NYRT Hold $10.54 $10.00 $1.8 26.5x 24.6x 31.6x 33.3x $10.99 (4.1%) 4.50% 4.62% 4.4% 9.4x
OFC Buy $27.68 $31.00 $2.7 13.7x 13.3x 16.9x 15.9x $30.23 (8.4%) 7.00% 7.37% 4.0% 7.6x
PDM Hold $21.00 $22.00 $3.0 12.9x 12.4x 15.9x 14.5x $22.80 (7.9%) 6.00% 6.32% 4.0% 6.2x
SLG Buy $105.17 $129.00 $11.0 15.1x 15.0x 19.6x 22.0x $140.61 (25.2%) 4.40% 5.31% 2.7% 8.0x
VNO Hold $95.37 $107.00 $19.2 19.7x 18.0x 43.3x 29.6x $118.39 (19.4%) 4.55% 5.32% 2.6% 9.1x
WRE Hold $30.25 $32.00 $2.2 17.1x 17.0x 20.4x 20.3x $32.34 (6.5%) 6.05% 6.33% 4.0% 6.6x
P/FFO
Multiple
P/FAD
Multiple
-20
-10
0
10
20
30
40
50
Feb-15 May-15 Aug-15 Nov-15 Feb-16 May-16 Aug-16
DEA SNL U.S. REIT Equity MSCI US REIT (RMS)
Easterly Government Properties, Inc.
Page 32 of 38
Figure 45: Easterly Total Return vs. GOV and OFC
Source: SNL Financial; STRH
Since its February 2015 IPO, the stock has outperformed the average return for our office coverage
universe by ~27pps. Perhaps more notable, as illustrated in Figure 46, DEA had the second-highest ratio
of total return over daily standard deviation of the 13 office stocks we cover (only PDM was better). The
daily standard deviation of returns was a bit higher than we expected, though it was rewarded with
excess return and the monthly standard deviation was the lowest in the group.
Figure 46: Easterly Return vs. Risk
Source: SNL Financial, Factset; STRH
-50
-40
-30
-20
-10
0
10
20
30
40
50
Feb-15 May-15 Aug-15 Nov-15 Feb-16 May-16 Aug-16
DEA GOV OFC
-30%
-20%
-10%
0%
10%
20%
30%
40%
1.0% 1.2% 1.4% 1.6% 1.8% 2.0%
TotalReturnSinceIPO
Daily % change (standard deviation)
DEA
Easterly Government Properties, Inc.
Page 33 of 38
Notably, DEA has also had a very high correlation to the U.S. 10-year Treasury yield. As illustrated in
Figure 48 and Figure 47 below, Easterly’s correlation to the 10 year yield is -0.80, which is much stronger
than the -0.30 simple average for our office coverage universe. If this relationship continues to hold, it
would be concerning in a rising rate environment. Meanwhile, DEA’s stock market beta is very low
(0.48) relative to the rest of the group (0.86), suggesting greater diversification benefits in a broader
portfolio.
Figure 47: Easterly Correlation versus U.S. 10-Year Yield (inverted)
Source: Factset; SNL Financial, STRH
Figure 48: Easterly Correlation and Beta Metrics
Source: Factset; STRH
1.00%
1.20%
1.40%
1.60%
1.80%
2.00%
2.20%
2.40%
2.60%$14.00
$15.00
$16.00
$17.00
$18.00
$19.00
$20.00
$21.00
Feb-15 May-15 Aug-15 Nov-15 Feb-16 May-16 Aug-16
DEA (LHS) US 10-year yield (inverted; RHS)
Correlation Beta to
to US 10 yr S&P 500
DEA -0.81 0.48
BDN -0.58 0.93
BXP -0.37 0.92
CUZ -0.26 1.04
CLI -0.71 0.92
FPO 0.57 0.86
HIW -0.84 0.86
NYRT 0.46 0.69
OFC -0.57 0.72
PDM -0.76 0.68
SLG 0.31 1.05
WRE -0.76 0.74
VNO -0.07 0.94
U.S. Office Average -0.30 0.86
Easterly Government Properties, Inc.
Page 34 of 38
Investment Recommendation and Price Target
We are initiating coverage of Easterly with a Buy rating and a $21 price target, which implies a 16.5%
potential total return including a 5.0% forward dividend yield (versus a 3.0% simple average total return
for our office coverage universe). Our target is based on a $23.59 discounted cash flow value (50%
weighting) and 0% discount to our projected NAV a year from now (50%). Our target also implies 16.9x
2017E FFO and 20.4x 2017E FAD; the stock currently trades at 15.3x 2016E FFO and 19.4x 2016E FAD.
Figure 49: Price Target Calculation
Source: SNL Financial, Factset; STRH
Figure 50: Office Comp Sheet
Note
1
: CUZ NAV and cap rates are as of 2Q17, reflects Houston spin-off
Source: SNL Financial; STRH
Yr 1 Yr 2 Yr 3 Yr 4 Yr 5
FAD $1.01 $1.06 $1.12 $1.23 $1.34
Term Value (FAD) $23.84
Sub-total $1.01 $1.06 $1.12 $1.23 $25.18
NPV $21.93
Forward Equity Price $23.59 DCF Assumptions
Cost of Equity 7.6%
Net Asset Value $16.97 Year 5 Growth 4.3%
2Q17E Net Asset Value $17.64 Term. Growth Rate 1.7%
0% Premium to 2Q17E NAV $17.64
Forward Div. Yield 5.0%
Target Price $21.00 Implied Total Return 16.5%
Price Prem/Disc 5-Yr. Avg. 2Q17E Prem/Disc Adj. Fwd. Price Implied Dividend Implied
Ticker Rating 10/17/2016 NAV to NAV Prem/Disc NAV Applied NAV DCF Target Appreciation Yield Tot. Return
FPO Buy $8.89 $12.05 -26% -19% 12.49 -18% $10.30 $10.87 $11 23.7% 4.6% 28.3%
SLG Buy $105.17 $140.61 -25% -5% 146.11 -10% $131.50 $127.36 $129 22.7% 2.9% 25.6%
BDN Buy $15.35 $16.50 -7% -8% 16.84 0% $16.84 $18.39 $18 17.3% 4.2% 21.4%
CUZ Buy $7.91 $8.19 -3% -7% 8.19 0% $8.19 $9.14 $9 13.8% 4.0% 17.8%
DEA Buy $18.84 $16.97 11% -1% 17.64 0% $17.64 $23.59 $21 11.5% 5.0% 16.5%
OFC Buy $27.68 $30.23 -8% -13% 31.25 -5% $29.69 $31.34 $31 12.0% 4.1% 16.1%
VNO Hold $95.37 $118.39 -19% -3% 122.07 -8% $112.92 $100.84 $107 12.2% 2.6% 14.8%
NYRT Hold $9.35 $10.99 -15% -8% 11.18 -10% $10.06 $7.66 $10 7.0% 4.9% 11.9%
BXP Hold $126.51 $141.19 -10% -2% 143.43 0% $143.43 $129.61 $137 8.3% 2.2% 10.5%
WRE Hold $30.25 $32.34 -6% -12% 32.65 0% $32.65 $30.38 $32 5.8% 4.0% 9.8%
HIW Hold $50.58 $46.88 8% -2% 47.28 7% $50.82 $54.32 $53 4.8% 4.9% 9.6%
CLI Hold $26.26 $29.21 -10% -13% 29.54 -5% $28.06 $27.07 $28 6.6% 2.3% 8.9%
PDM Hold $21.00 $22.80 -8% -5% 22.67 -5% $21.53 $22.73 $22 4.8% 4.1% 8.9%
Simple Average -9% -8% -4% 11.6% 3.8% 15.4%
Easterly Government Properties, Inc.
Page 35 of 38
Company Description
Easterly Government Properties is a publicly-traded (NYSE: DEA), self-managed, fully-integrated
office REIT headquartered in Washington D.C. DEA is focused on the acquisition, development
and management of Class A commercial properties that are primarily leased to mission-critical U.S.
Government agencies, including but not limited to the DEA, FBI, ICE and IRS.
Investment Thesis
DEA should be a steady growing income vehicle. Long leases (with expense increase reimbursements)
to government tenants at very select locations should underpin predictable, low-volatility earnings.
Meanwhile, management will continue to leverage its relationships and knowledge of GSA real estate
requirements to source acquisitions and build-to-suit development opportunities. DEA is one of the
lowest-levered office REITs in our coverage universe and offers the highest dividend yield (albeit at a
high payout ratio), supported by predictable cash flows.
Valuation and Risks
DEA trades at a 1% premium to our office coverage universe on P/2016E FFO and a 30% discount on
P/FAD. It trades at a 11% premium to our $16.97 NAV estimate (6.2% implied cap rate) versus an 9%
average discount for the group. Our $21 price target is based on a $23.59 discounted cash flow (50%
weighting) and our projected NAV a year from now (50%). It implies a 16.5% total return, including the
5.0% projected dividend yield.
First, GSA tenants offer strong credit and high renewal rates, but DEA has high property and tenant
concentration risk that is tied to government decisions. Re-leasing assets could prove difficult/costly
should a large tenant vacate an entire building. Second, the company’s small size is evident in its
high G&A expense relative to revenue. DEA needs to continue to grow, which means continuing to
execute acquisitions, while relying on accessible and cost-effective capital to maintain the balance
sheet. Finally, DEA has exhibited a high correlation with the 10-year Treasury yield in its relatively short
time as a public company. It may be viewed as more bond-like, even compared with other REITs, and
the stock could be susceptible to underperformance in a rising interest rate environment.
Companies Mentioned in This Note
Easterly Government Properties, Inc. (DEA, $18.84, Buy, Michael Lewis)
Highwoods Properties, Inc. (HIW, $50.73, Hold, Michael Lewis)
Corporate Office Properties Trust (OFC, $27.72, Buy, Michael Lewis)
Piedmont Office Realty Trust, Inc. (PDM, $21.09, Hold, Michael Lewis)
Government Properties Income Trust (GOV, $20.69, NR)
Analyst Certification
I, Michael Lewis , hereby certify that the views expressed in this research report accurately reflect my
personal views about the subject company(ies) and its (their) securities. I also certify that I have not been,
am not, and will not be receiving direct or indirect compensation in exchange for expressing the specific
recommendation(s) in this report.
Required Disclosures
Analyst compensation is based upon stock price performance, quality of analysis, communication skills,
and the overall revenue and profitability of the firm, including investment banking revenue.
As a matter of policy and practice, the firm prohibits the offering of favorable research, a specific
research rating or a specific target price as consideration or inducement for the receipt of business or
compensation. In addition, associated persons preparing research reports are prohibited from owning
securities in the subject companies.
Charts indicating changes in ratings can be found in recent notes and/or reports at our website or by
contacting SunTrust Robinson Humphrey. Please see our disclosures page for more complete information
at https://suntrust.bluematrix.com/sellside/Disclosures.action.
STRH Ratings System for Equity Securities
Dissemination of Research
Easterly Government Properties, Inc.
Page 36 of 38
SunTrust Robinson Humphrey (STRH) seeks to make all reasonable efforts to provide research reports
simultaneously to all eligible clients. Reports are available as published in the restricted access area of
our website to all eligible clients who have requested a password. Institutional investors, corporates, and
members of the Press may also receive our research via third party vendors including: Thomson Reuters,
Bloomberg, FactSet, and S&P Capital IQ. Additional distribution may be done by sales personnel via
email, fax, or other electronic means, or regular mail.
For access to third party vendors or our Research website:
https://suntrustlibrary.bluematrix.com/client/library.jsp
please email the Research Department at STRHEquityResearchDepartment@SunTrust.com
or contact your STRH sales representative.
The rating system effective as of Oct. 7, 2016:
STRH Rating System for Equity Securities
SunTrust Robinson Humphrey (STRH) rates individual equities using a three-tiered system. Each stock
is rated relative to the broader market (generally the S&P 500) over the next 12-18 months (unless
otherwise indicated).
Buy (B) – the stock’s total return is expected to outperform the S&P 500 or relevant benchmark over the
next 12-18 months (unless otherwise indicated)
Hold (H) – the stock’s total return is expected to perform in line with the S&P 500 or relevant benchmark
over the next 12-18 months (unless otherwise indicated)
Sell (S) – the stock’s total return is expected to underperform the S&P 500 or relevant benchmark over
the next 12-18 months (unless otherwise indicated)
Not Rated (NR) – STRH does not have an investment rating or opinion on the stock
Coverage Suspended (CS) – indicates that STRH’s rating and/or target price have been temporarily
suspended due to applicable regulations and/or STRH Management discretion. The previously published
rating and target price should not be relied upon
STRH analysts have a price target on the stocks that they cover, unless otherwise indicated. The price
target represents that analyst's expectation of where the stock will trade in the next 12-18 months (unless
otherwise indicated). If an analyst believes that there are insufficient valuation drivers and/or investment
catalysts to derive a positive or negative investment view, they may elect with the approval of STRH
Research Management not to assign a target price; likewise certain stocks that trade under $5 may
exhibit volatility whereby assigning a price target would be unhelpful to making an investment decision.
As such, with Research Management‘s approval, an analyst may refrain from assigning a target to a sub-
$5 stock.
Legend for Rating and Price Target History Charts:
B = Buy
H = Hold
S = Sell
D = drop coverage
CS = Coverage Suspended
I = initiate coverage
T = transfer coverage
The prior rating system until Oct. 7, 2016:
3 designations based on total returns* within a 12-month period**
∙ Buy – total return ≥ 15% (10% for low-Beta securities)***
∙ Reduce – total return ≤ negative 10% (5% for low Beta securities)
∙ Neutral – total return is within the bounds above
∙ NR – NOT RATED, STRH does not provide equity research coverage
∙ CS – Coverage Suspended
*Total return (price appreciation + dividends); **Price targets are within a 12-month period, unless
otherwise noted; ***Low Beta defined as securities with an average Beta of 0.8 or less, using Bloomberg’s
5-year average
Easterly Government Properties, Inc.
Page 37 of 38
SunTrust Robinson Humphrey ratings distribution (as of 10/18/2016):
Coverage Universe Investment Banking Clients Past 12 Months
Rating Count Percent Rating Count Percent
Buy 381 59.44% Buy 82 21.52%
Hold/Neutral 258 40.25% Hold/Neutral 39 15.12%
Sell/Reduce 2 0.31% Sell/Reduce 0 0.00%
Other Disclosures
Information contained herein has been derived from sources believed to be reliable but is not guaranteed
as to accuracy and does not purport to be a complete analysis of the security, company or industry
involved. This report is not to be construed as an offer to sell or a solicitation of an offer to buy any
security. SunTrust Robinson Humphrey, Inc. and/or its officers or employees may have positions in
any securities, options, rights or warrants. The firm and/or associated persons may sell to or buy from
customers on a principal basis. Investors may be prohibited in certain states from purchasing some over-
the-counter securities mentioned herein. Opinions expressed are subject to change without notice. The
information herein is for persons residing in the United States only and is not intended for any person in
any other jurisdiction.
SunTrust Robinson Humphrey, Inc.’s research is provided to and intended for use by Institutional
Accounts as defined in FINRA Rule 4512(c). The term “Institutional Account" shall mean the account of:
(1) a bank, savings and loan association, insurance company or registered investment company; (2) an
investment adviser registered either with the SEC under Section 203 of the Investment Advisers Act or
with a state securities commission (or any agency or office performing like functions); or (3) any other
person (whether a natural person, corporation, partnership, trust or otherwise) with total assets of at least
$50 million.
SunTrust Robinson Humphrey, Inc. is a registered broker-dealer and a member of FINRA and SIPC. It is
a service mark of SunTrust Banks, Inc. SunTrust Robinson Humphrey, Inc. is owned by SunTrust Banks,
Inc. ("SunTrust") and affiliated with SunTrust Investment Services, Inc. Despite this affiliation, securities
recommended, offered, sold by, or held at SunTrust Robinson Humphrey, Inc. and at SunTrust Investment
Services, Inc. (i) are not insured by the Federal Deposit Insurance Corporation; (ii) are not deposits or
other obligations of any insured depository institution (including SunTrust Bank); and (iii) are subject to
investment risks, including the possible loss of the principal amount invested. SunTrust Bank may have a
lending relationship with companies mentioned herein.
Please see our Disclosure Database to search by ticker or company name for the current required
disclosures, including risks to the price targets, Link: https://suntrust.bluematrix.com/sellside/
Disclosures.action
Please visit the STRH equity research library for current reports and the analyst roster with contact
information, Link (password protected): STRH RESEARCH LIBRARY
SunTrust Robinson Humphrey, Inc., member FINRA and SIPC. SunTrust and SunTrust Robinson
Humphrey are service marks of SunTrust Banks, Inc.
If you no longer wish to receive this type of communication, please request removal by sending an email
to STRHEquityResearchDepartment@SunTrust.com
© SunTrust Robinson Humphrey, Inc. 2016 . All rights reserved. Reproduction or quotation in whole or
part without permission is forbidden.
ADDITIONAL INFORMATION IS AVAILABLE at our website, www.suntrustrh.com, or by writing to:
SunTrust Robinson Humphrey, Research Department, 3333 Peachtree Road N.E., Atlanta, GA
30326-1070
Easterly Government Properties, Inc.
Page 38 of 38

More Related Content

What's hot

Barclays Conference, Fred Tomczyk - September 2014
Barclays Conference, Fred Tomczyk - September 2014Barclays Conference, Fred Tomczyk - September 2014
Barclays Conference, Fred Tomczyk - September 2014investorsamtd
 
TD Ameritrade Barclays Americas Select Franchise Conference Presentation
TD Ameritrade Barclays Americas Select Franchise Conference PresentationTD Ameritrade Barclays Americas Select Franchise Conference Presentation
TD Ameritrade Barclays Americas Select Franchise Conference Presentationinvestorsamtd
 
Ladder Capital - Investor Presentation (March 2019)
Ladder Capital - Investor Presentation (March 2019)Ladder Capital - Investor Presentation (March 2019)
Ladder Capital - Investor Presentation (March 2019)Ladder Capital
 
Ladder Capital – Investor Presentation (March 2019)
Ladder Capital – Investor Presentation (March 2019)Ladder Capital – Investor Presentation (March 2019)
Ladder Capital – Investor Presentation (March 2019)David Merkur
 
Mercer Capital's Portfolio Valuation: Private Equity Marks and Trends | Q1 2016
Mercer Capital's Portfolio Valuation: Private Equity Marks and Trends | Q1 2016Mercer Capital's Portfolio Valuation: Private Equity Marks and Trends | Q1 2016
Mercer Capital's Portfolio Valuation: Private Equity Marks and Trends | Q1 2016Mercer Capital
 
Duncan going for gold in everything we do
Duncan   going for gold in everything we doDuncan   going for gold in everything we do
Duncan going for gold in everything we doREDB_East
 
Ladder Capital - Investor Presentation (October 2019)
Ladder Capital - Investor Presentation (October 2019)Ladder Capital - Investor Presentation (October 2019)
Ladder Capital - Investor Presentation (October 2019)David Merkur
 
Ladder Capital - Investor Presentation (March 2019)
Ladder Capital - Investor Presentation (March 2019)Ladder Capital - Investor Presentation (March 2019)
Ladder Capital - Investor Presentation (March 2019)David Merkur
 
Ladder Capital - Q2 2020 Earnings Supplemental Presentation (2020-07-30)
Ladder Capital - Q2 2020 Earnings Supplemental Presentation (2020-07-30)Ladder Capital - Q2 2020 Earnings Supplemental Presentation (2020-07-30)
Ladder Capital - Q2 2020 Earnings Supplemental Presentation (2020-07-30)David Merkur
 
Phoenix Pp Rev7
Phoenix Pp Rev7Phoenix Pp Rev7
Phoenix Pp Rev7stockz
 
Ladder Capital - Q2 2020 Earnings Supplemental Presentation
Ladder Capital - Q2 2020 Earnings Supplemental PresentationLadder Capital - Q2 2020 Earnings Supplemental Presentation
Ladder Capital - Q2 2020 Earnings Supplemental PresentationDavid Merkur
 
Ladder Capital - Q2 2020 Earnings Supplemental Presentation
Ladder Capital - Q2 2020 Earnings Supplemental PresentationLadder Capital - Q2 2020 Earnings Supplemental Presentation
Ladder Capital - Q2 2020 Earnings Supplemental PresentationDavid Merkur
 
Ladder Capital - Q2 2020 Earnings Supplemental Presentation
Ladder Capital - Q2 2020 Earnings Supplemental PresentationLadder Capital - Q2 2020 Earnings Supplemental Presentation
Ladder Capital - Q2 2020 Earnings Supplemental PresentationDavid Merkur
 
Ladder Capital - Investor Presentation (2021-05-14)
Ladder Capital - Investor Presentation (2021-05-14)Ladder Capital - Investor Presentation (2021-05-14)
Ladder Capital - Investor Presentation (2021-05-14)David Merkur
 
Zep Inc. Investor Presentation
Zep Inc. Investor Presentation Zep Inc. Investor Presentation
Zep Inc. Investor Presentation Zep Inc.
 
Sem group investor presentation post 4Q and FY 2016 earnings final
Sem group investor presentation post 4Q and FY 2016 earnings finalSem group investor presentation post 4Q and FY 2016 earnings final
Sem group investor presentation post 4Q and FY 2016 earnings finalSemGroupCorporation
 
Ladder Capital - Investor Presentation (May 2019)
Ladder Capital - Investor Presentation (May 2019)Ladder Capital - Investor Presentation (May 2019)
Ladder Capital - Investor Presentation (May 2019)David Merkur
 
Ladder Capital - Q2 2020 Earnings Supplemental Presentation
Ladder Capital - Q2 2020 Earnings Supplemental PresentationLadder Capital - Q2 2020 Earnings Supplemental Presentation
Ladder Capital - Q2 2020 Earnings Supplemental PresentationDavid Merkur
 
2017 en link midstream guidance
2017 en link midstream guidance2017 en link midstream guidance
2017 en link midstream guidanceEnLinkMidstreamLLC
 

What's hot (20)

Barclays Conference, Fred Tomczyk - September 2014
Barclays Conference, Fred Tomczyk - September 2014Barclays Conference, Fred Tomczyk - September 2014
Barclays Conference, Fred Tomczyk - September 2014
 
TD Ameritrade Barclays Americas Select Franchise Conference Presentation
TD Ameritrade Barclays Americas Select Franchise Conference PresentationTD Ameritrade Barclays Americas Select Franchise Conference Presentation
TD Ameritrade Barclays Americas Select Franchise Conference Presentation
 
Mic slides q3_2016_final
Mic slides q3_2016_finalMic slides q3_2016_final
Mic slides q3_2016_final
 
Ladder Capital - Investor Presentation (March 2019)
Ladder Capital - Investor Presentation (March 2019)Ladder Capital - Investor Presentation (March 2019)
Ladder Capital - Investor Presentation (March 2019)
 
Ladder Capital – Investor Presentation (March 2019)
Ladder Capital – Investor Presentation (March 2019)Ladder Capital – Investor Presentation (March 2019)
Ladder Capital – Investor Presentation (March 2019)
 
Mercer Capital's Portfolio Valuation: Private Equity Marks and Trends | Q1 2016
Mercer Capital's Portfolio Valuation: Private Equity Marks and Trends | Q1 2016Mercer Capital's Portfolio Valuation: Private Equity Marks and Trends | Q1 2016
Mercer Capital's Portfolio Valuation: Private Equity Marks and Trends | Q1 2016
 
Duncan going for gold in everything we do
Duncan   going for gold in everything we doDuncan   going for gold in everything we do
Duncan going for gold in everything we do
 
Ladder Capital - Investor Presentation (October 2019)
Ladder Capital - Investor Presentation (October 2019)Ladder Capital - Investor Presentation (October 2019)
Ladder Capital - Investor Presentation (October 2019)
 
Ladder Capital - Investor Presentation (March 2019)
Ladder Capital - Investor Presentation (March 2019)Ladder Capital - Investor Presentation (March 2019)
Ladder Capital - Investor Presentation (March 2019)
 
Ladder Capital - Q2 2020 Earnings Supplemental Presentation (2020-07-30)
Ladder Capital - Q2 2020 Earnings Supplemental Presentation (2020-07-30)Ladder Capital - Q2 2020 Earnings Supplemental Presentation (2020-07-30)
Ladder Capital - Q2 2020 Earnings Supplemental Presentation (2020-07-30)
 
Phoenix Pp Rev7
Phoenix Pp Rev7Phoenix Pp Rev7
Phoenix Pp Rev7
 
Ladder Capital - Q2 2020 Earnings Supplemental Presentation
Ladder Capital - Q2 2020 Earnings Supplemental PresentationLadder Capital - Q2 2020 Earnings Supplemental Presentation
Ladder Capital - Q2 2020 Earnings Supplemental Presentation
 
Ladder Capital - Q2 2020 Earnings Supplemental Presentation
Ladder Capital - Q2 2020 Earnings Supplemental PresentationLadder Capital - Q2 2020 Earnings Supplemental Presentation
Ladder Capital - Q2 2020 Earnings Supplemental Presentation
 
Ladder Capital - Q2 2020 Earnings Supplemental Presentation
Ladder Capital - Q2 2020 Earnings Supplemental PresentationLadder Capital - Q2 2020 Earnings Supplemental Presentation
Ladder Capital - Q2 2020 Earnings Supplemental Presentation
 
Ladder Capital - Investor Presentation (2021-05-14)
Ladder Capital - Investor Presentation (2021-05-14)Ladder Capital - Investor Presentation (2021-05-14)
Ladder Capital - Investor Presentation (2021-05-14)
 
Zep Inc. Investor Presentation
Zep Inc. Investor Presentation Zep Inc. Investor Presentation
Zep Inc. Investor Presentation
 
Sem group investor presentation post 4Q and FY 2016 earnings final
Sem group investor presentation post 4Q and FY 2016 earnings finalSem group investor presentation post 4Q and FY 2016 earnings final
Sem group investor presentation post 4Q and FY 2016 earnings final
 
Ladder Capital - Investor Presentation (May 2019)
Ladder Capital - Investor Presentation (May 2019)Ladder Capital - Investor Presentation (May 2019)
Ladder Capital - Investor Presentation (May 2019)
 
Ladder Capital - Q2 2020 Earnings Supplemental Presentation
Ladder Capital - Q2 2020 Earnings Supplemental PresentationLadder Capital - Q2 2020 Earnings Supplemental Presentation
Ladder Capital - Q2 2020 Earnings Supplemental Presentation
 
2017 en link midstream guidance
2017 en link midstream guidance2017 en link midstream guidance
2017 en link midstream guidance
 

Similar to DEA Initiation Report

Daseke acquires aveda transaction presentation - april 2018
Daseke acquires aveda   transaction presentation - april 2018Daseke acquires aveda   transaction presentation - april 2018
Daseke acquires aveda transaction presentation - april 2018irdaseke
 
Daseke acquires aveda transaction presentation - april 2018
Daseke acquires aveda   transaction presentation - april 2018Daseke acquires aveda   transaction presentation - april 2018
Daseke acquires aveda transaction presentation - april 2018irdaseke
 
5 Reasons Why Short-Term Municipal Bonds Make Sense Now
5 Reasons Why Short-Term Municipal Bonds Make Sense Now5 Reasons Why Short-Term Municipal Bonds Make Sense Now
5 Reasons Why Short-Term Municipal Bonds Make Sense NowU.S. Global Investors
 
Greenfield Seitz Capital - 2010
Greenfield Seitz Capital - 2010Greenfield Seitz Capital - 2010
Greenfield Seitz Capital - 2010stugreenfield
 
Cineplex Inc (CGX) Stock Analysis Report
Cineplex Inc (CGX) Stock Analysis ReportCineplex Inc (CGX) Stock Analysis Report
Cineplex Inc (CGX) Stock Analysis ReportStock Target Advisor
 
FDC Investment Overivew 10315 rlc
FDC Investment Overivew 10315 rlcFDC Investment Overivew 10315 rlc
FDC Investment Overivew 10315 rlcRon Coleman
 
REGION FINANCIAL CORPORATION
REGION FINANCIAL CORPORATIONREGION FINANCIAL CORPORATION
REGION FINANCIAL CORPORATIONNAWAF ALMUTAIRI
 
DSP Equity Oppotunities Fund
DSP Equity Oppotunities FundDSP Equity Oppotunities Fund
DSP Equity Oppotunities FundDSP Mutual Fund
 
Colliers DC YE Report 2014 V11
Colliers DC YE Report 2014 V11Colliers DC YE Report 2014 V11
Colliers DC YE Report 2014 V11William E. Kaye
 
Released August 19th, 2016 - Fundamental Research Corp. has updated their res...
Released August 19th, 2016 - Fundamental Research Corp. has updated their res...Released August 19th, 2016 - Fundamental Research Corp. has updated their res...
Released August 19th, 2016 - Fundamental Research Corp. has updated their res...Follow me on Twitter @Stockshaman
 
Tax Reform: Time for Rubber to meet the road!
Tax Reform: Time for Rubber to meet the road!Tax Reform: Time for Rubber to meet the road!
Tax Reform: Time for Rubber to meet the road!David Apted
 
Released Nov.16 2016 - Fundamental Research Corp. eXp World Holdings, Inc. (O...
Released Nov.16 2016 - Fundamental Research Corp. eXp World Holdings, Inc. (O...Released Nov.16 2016 - Fundamental Research Corp. eXp World Holdings, Inc. (O...
Released Nov.16 2016 - Fundamental Research Corp. eXp World Holdings, Inc. (O...Follow me on Twitter @Stockshaman
 

Similar to DEA Initiation Report (20)

Daseke acquires aveda transaction presentation - april 2018
Daseke acquires aveda   transaction presentation - april 2018Daseke acquires aveda   transaction presentation - april 2018
Daseke acquires aveda transaction presentation - april 2018
 
Daseke acquires aveda transaction presentation - april 2018
Daseke acquires aveda   transaction presentation - april 2018Daseke acquires aveda   transaction presentation - april 2018
Daseke acquires aveda transaction presentation - april 2018
 
5 Reasons Why Short-Term Municipal Bonds Make Sense Now
5 Reasons Why Short-Term Municipal Bonds Make Sense Now5 Reasons Why Short-Term Municipal Bonds Make Sense Now
5 Reasons Why Short-Term Municipal Bonds Make Sense Now
 
Greenfield Seitz Capital - 2010
Greenfield Seitz Capital - 2010Greenfield Seitz Capital - 2010
Greenfield Seitz Capital - 2010
 
Cineplex Inc (CGX) Stock Analysis Report
Cineplex Inc (CGX) Stock Analysis ReportCineplex Inc (CGX) Stock Analysis Report
Cineplex Inc (CGX) Stock Analysis Report
 
FDC Investment Overivew 10315 rlc
FDC Investment Overivew 10315 rlcFDC Investment Overivew 10315 rlc
FDC Investment Overivew 10315 rlc
 
New World
New WorldNew World
New World
 
DST
DSTDST
DST
 
Colliers International Group.pdf
Colliers International Group.pdfColliers International Group.pdf
Colliers International Group.pdf
 
REGION FINANCIAL CORPORATION
REGION FINANCIAL CORPORATIONREGION FINANCIAL CORPORATION
REGION FINANCIAL CORPORATION
 
DSP Equity Oppotunities Fund
DSP Equity Oppotunities FundDSP Equity Oppotunities Fund
DSP Equity Oppotunities Fund
 
AFP_Sept 2015_v3
AFP_Sept 2015_v3AFP_Sept 2015_v3
AFP_Sept 2015_v3
 
BX Initiation
BX InitiationBX Initiation
BX Initiation
 
Realty Income~Final
Realty Income~FinalRealty Income~Final
Realty Income~Final
 
Colliers DC YE Report 2014 V11
Colliers DC YE Report 2014 V11Colliers DC YE Report 2014 V11
Colliers DC YE Report 2014 V11
 
Released August 19th, 2016 - Fundamental Research Corp. has updated their res...
Released August 19th, 2016 - Fundamental Research Corp. has updated their res...Released August 19th, 2016 - Fundamental Research Corp. has updated their res...
Released August 19th, 2016 - Fundamental Research Corp. has updated their res...
 
Philadelphia cafr presentation with comments
Philadelphia cafr presentation with commentsPhiladelphia cafr presentation with comments
Philadelphia cafr presentation with comments
 
Tax Reform: Time for Rubber to meet the road!
Tax Reform: Time for Rubber to meet the road!Tax Reform: Time for Rubber to meet the road!
Tax Reform: Time for Rubber to meet the road!
 
Released Nov.16 2016 - Fundamental Research Corp. eXp World Holdings, Inc. (O...
Released Nov.16 2016 - Fundamental Research Corp. eXp World Holdings, Inc. (O...Released Nov.16 2016 - Fundamental Research Corp. eXp World Holdings, Inc. (O...
Released Nov.16 2016 - Fundamental Research Corp. eXp World Holdings, Inc. (O...
 
FIG Initiation
FIG InitiationFIG Initiation
FIG Initiation
 

More from Kevin Cheng, CFA

Equity Strategy - Consumer Staples
Equity Strategy - Consumer StaplesEquity Strategy - Consumer Staples
Equity Strategy - Consumer StaplesKevin Cheng, CFA
 
Brookfield Office Properties - BPO - Quarterly Earnings
Brookfield Office Properties - BPO - Quarterly EarningsBrookfield Office Properties - BPO - Quarterly Earnings
Brookfield Office Properties - BPO - Quarterly EarningsKevin Cheng, CFA
 
First Capital Realty - FCR
First Capital Realty - FCRFirst Capital Realty - FCR
First Capital Realty - FCRKevin Cheng, CFA
 
CXP initiation - Office REIT
CXP initiation - Office REITCXP initiation - Office REIT
CXP initiation - Office REITKevin Cheng, CFA
 
Canadian Asset Managers - Initiation Report
Canadian Asset Managers - Initiation ReportCanadian Asset Managers - Initiation Report
Canadian Asset Managers - Initiation ReportKevin Cheng, CFA
 
Equity Strategy - Staying Defensive
Equity Strategy - Staying DefensiveEquity Strategy - Staying Defensive
Equity Strategy - Staying DefensiveKevin Cheng, CFA
 
Asset Managers - Recession risks, Trust Banks & Asset Mgrs
Asset Managers - Recession risks, Trust Banks & Asset MgrsAsset Managers - Recession risks, Trust Banks & Asset Mgrs
Asset Managers - Recession risks, Trust Banks & Asset MgrsKevin Cheng, CFA
 
Asset Managers - Defensive But Not Immune
Asset Managers - Defensive But Not ImmuneAsset Managers - Defensive But Not Immune
Asset Managers - Defensive But Not ImmuneKevin Cheng, CFA
 

More from Kevin Cheng, CFA (14)

Equity Strategy - Consumer Staples
Equity Strategy - Consumer StaplesEquity Strategy - Consumer Staples
Equity Strategy - Consumer Staples
 
Brookfield Office Properties - BPO - Quarterly Earnings
Brookfield Office Properties - BPO - Quarterly EarningsBrookfield Office Properties - BPO - Quarterly Earnings
Brookfield Office Properties - BPO - Quarterly Earnings
 
First Capital Realty - FCR
First Capital Realty - FCRFirst Capital Realty - FCR
First Capital Realty - FCR
 
Equity Strategy - TSX
Equity Strategy - TSXEquity Strategy - TSX
Equity Strategy - TSX
 
Focus - Economic Research
Focus - Economic ResearchFocus - Economic Research
Focus - Economic Research
 
CXP initiation - Office REIT
CXP initiation - Office REITCXP initiation - Office REIT
CXP initiation - Office REIT
 
Canadian Asset Managers - Initiation Report
Canadian Asset Managers - Initiation ReportCanadian Asset Managers - Initiation Report
Canadian Asset Managers - Initiation Report
 
Agf market outlook
Agf market outlookAgf market outlook
Agf market outlook
 
Equity Strategy - Staying Defensive
Equity Strategy - Staying DefensiveEquity Strategy - Staying Defensive
Equity Strategy - Staying Defensive
 
Asset Managers - Recession risks, Trust Banks & Asset Mgrs
Asset Managers - Recession risks, Trust Banks & Asset MgrsAsset Managers - Recession risks, Trust Banks & Asset Mgrs
Asset Managers - Recession risks, Trust Banks & Asset Mgrs
 
Asset Managers - Defensive But Not Immune
Asset Managers - Defensive But Not ImmuneAsset Managers - Defensive But Not Immune
Asset Managers - Defensive But Not Immune
 
The deleveraging cycle
The deleveraging cycleThe deleveraging cycle
The deleveraging cycle
 
Market Strategy
Market StrategyMarket Strategy
Market Strategy
 
U.S. Real Rates
U.S. Real RatesU.S. Real Rates
U.S. Real Rates
 

Recently uploaded

VIP Kolkata Call Girl Jodhpur Park 👉 8250192130 Available With Room
VIP Kolkata Call Girl Jodhpur Park 👉 8250192130  Available With RoomVIP Kolkata Call Girl Jodhpur Park 👉 8250192130  Available With Room
VIP Kolkata Call Girl Jodhpur Park 👉 8250192130 Available With Roomdivyansh0kumar0
 
VIP Call Girls LB Nagar ( Hyderabad ) Phone 8250192130 | ₹5k To 25k With Room...
VIP Call Girls LB Nagar ( Hyderabad ) Phone 8250192130 | ₹5k To 25k With Room...VIP Call Girls LB Nagar ( Hyderabad ) Phone 8250192130 | ₹5k To 25k With Room...
VIP Call Girls LB Nagar ( Hyderabad ) Phone 8250192130 | ₹5k To 25k With Room...Suhani Kapoor
 
Andheri Call Girls In 9825968104 Mumbai Hot Models
Andheri Call Girls In 9825968104 Mumbai Hot ModelsAndheri Call Girls In 9825968104 Mumbai Hot Models
Andheri Call Girls In 9825968104 Mumbai Hot Modelshematsharma006
 
(办理原版一样)QUT毕业证昆士兰科技大学毕业证学位证留信学历认证成绩单补办
(办理原版一样)QUT毕业证昆士兰科技大学毕业证学位证留信学历认证成绩单补办(办理原版一样)QUT毕业证昆士兰科技大学毕业证学位证留信学历认证成绩单补办
(办理原版一样)QUT毕业证昆士兰科技大学毕业证学位证留信学历认证成绩单补办fqiuho152
 
Unveiling the Top Chartered Accountants in India and Their Staggering Net Worth
Unveiling the Top Chartered Accountants in India and Their Staggering Net WorthUnveiling the Top Chartered Accountants in India and Their Staggering Net Worth
Unveiling the Top Chartered Accountants in India and Their Staggering Net WorthShaheen Kumar
 
Interimreport1 January–31 March2024 Elo Mutual Pension Insurance Company
Interimreport1 January–31 March2024 Elo Mutual Pension Insurance CompanyInterimreport1 January–31 March2024 Elo Mutual Pension Insurance Company
Interimreport1 January–31 March2024 Elo Mutual Pension Insurance CompanyTyöeläkeyhtiö Elo
 
Instant Issue Debit Cards - High School Spirit
Instant Issue Debit Cards - High School SpiritInstant Issue Debit Cards - High School Spirit
Instant Issue Debit Cards - High School Spiritegoetzinger
 
原版1:1复刻温哥华岛大学毕业证Vancouver毕业证留信学历认证
原版1:1复刻温哥华岛大学毕业证Vancouver毕业证留信学历认证原版1:1复刻温哥华岛大学毕业证Vancouver毕业证留信学历认证
原版1:1复刻温哥华岛大学毕业证Vancouver毕业证留信学历认证rjrjkk
 
Vp Girls near me Delhi Call Now or WhatsApp
Vp Girls near me Delhi Call Now or WhatsAppVp Girls near me Delhi Call Now or WhatsApp
Vp Girls near me Delhi Call Now or WhatsAppmiss dipika
 
Call Girls In Yusuf Sarai Women Seeking Men 9654467111
Call Girls In Yusuf Sarai Women Seeking Men 9654467111Call Girls In Yusuf Sarai Women Seeking Men 9654467111
Call Girls In Yusuf Sarai Women Seeking Men 9654467111Sapana Sha
 
government_intervention_in_business_ownership[1].pdf
government_intervention_in_business_ownership[1].pdfgovernment_intervention_in_business_ownership[1].pdf
government_intervention_in_business_ownership[1].pdfshaunmashale756
 
Quantitative Analysis of Retail Sector Companies
Quantitative Analysis of Retail Sector CompaniesQuantitative Analysis of Retail Sector Companies
Quantitative Analysis of Retail Sector Companiesprashantbhati354
 
Call Girls Service Nagpur Maya Call 7001035870 Meet With Nagpur Escorts
Call Girls Service Nagpur Maya Call 7001035870 Meet With Nagpur EscortsCall Girls Service Nagpur Maya Call 7001035870 Meet With Nagpur Escorts
Call Girls Service Nagpur Maya Call 7001035870 Meet With Nagpur Escortsranjana rawat
 
Attachment Of Assets......................
Attachment Of Assets......................Attachment Of Assets......................
Attachment Of Assets......................AmanBajaj36
 
Vip B Aizawl Call Girls #9907093804 Contact Number Escorts Service Aizawl
Vip B Aizawl Call Girls #9907093804 Contact Number Escorts Service AizawlVip B Aizawl Call Girls #9907093804 Contact Number Escorts Service Aizawl
Vip B Aizawl Call Girls #9907093804 Contact Number Escorts Service Aizawlmakika9823
 
call girls in Nand Nagri (DELHI) 🔝 >༒9953330565🔝 genuine Escort Service 🔝✔️✔️
call girls in  Nand Nagri (DELHI) 🔝 >༒9953330565🔝 genuine Escort Service 🔝✔️✔️call girls in  Nand Nagri (DELHI) 🔝 >༒9953330565🔝 genuine Escort Service 🔝✔️✔️
call girls in Nand Nagri (DELHI) 🔝 >༒9953330565🔝 genuine Escort Service 🔝✔️✔️9953056974 Low Rate Call Girls In Saket, Delhi NCR
 
Log your LOA pain with Pension Lab's brilliant campaign
Log your LOA pain with Pension Lab's brilliant campaignLog your LOA pain with Pension Lab's brilliant campaign
Log your LOA pain with Pension Lab's brilliant campaignHenry Tapper
 
letter-from-the-chair-to-the-fca-relating-to-british-steel-pensions-scheme-15...
letter-from-the-chair-to-the-fca-relating-to-british-steel-pensions-scheme-15...letter-from-the-chair-to-the-fca-relating-to-british-steel-pensions-scheme-15...
letter-from-the-chair-to-the-fca-relating-to-british-steel-pensions-scheme-15...Henry Tapper
 
Bladex 1Q24 Earning Results Presentation
Bladex 1Q24 Earning Results PresentationBladex 1Q24 Earning Results Presentation
Bladex 1Q24 Earning Results PresentationBladex
 
Stock Market Brief Deck for "this does not happen often".pdf
Stock Market Brief Deck for "this does not happen often".pdfStock Market Brief Deck for "this does not happen often".pdf
Stock Market Brief Deck for "this does not happen often".pdfMichael Silva
 

Recently uploaded (20)

VIP Kolkata Call Girl Jodhpur Park 👉 8250192130 Available With Room
VIP Kolkata Call Girl Jodhpur Park 👉 8250192130  Available With RoomVIP Kolkata Call Girl Jodhpur Park 👉 8250192130  Available With Room
VIP Kolkata Call Girl Jodhpur Park 👉 8250192130 Available With Room
 
VIP Call Girls LB Nagar ( Hyderabad ) Phone 8250192130 | ₹5k To 25k With Room...
VIP Call Girls LB Nagar ( Hyderabad ) Phone 8250192130 | ₹5k To 25k With Room...VIP Call Girls LB Nagar ( Hyderabad ) Phone 8250192130 | ₹5k To 25k With Room...
VIP Call Girls LB Nagar ( Hyderabad ) Phone 8250192130 | ₹5k To 25k With Room...
 
Andheri Call Girls In 9825968104 Mumbai Hot Models
Andheri Call Girls In 9825968104 Mumbai Hot ModelsAndheri Call Girls In 9825968104 Mumbai Hot Models
Andheri Call Girls In 9825968104 Mumbai Hot Models
 
(办理原版一样)QUT毕业证昆士兰科技大学毕业证学位证留信学历认证成绩单补办
(办理原版一样)QUT毕业证昆士兰科技大学毕业证学位证留信学历认证成绩单补办(办理原版一样)QUT毕业证昆士兰科技大学毕业证学位证留信学历认证成绩单补办
(办理原版一样)QUT毕业证昆士兰科技大学毕业证学位证留信学历认证成绩单补办
 
Unveiling the Top Chartered Accountants in India and Their Staggering Net Worth
Unveiling the Top Chartered Accountants in India and Their Staggering Net WorthUnveiling the Top Chartered Accountants in India and Their Staggering Net Worth
Unveiling the Top Chartered Accountants in India and Their Staggering Net Worth
 
Interimreport1 January–31 March2024 Elo Mutual Pension Insurance Company
Interimreport1 January–31 March2024 Elo Mutual Pension Insurance CompanyInterimreport1 January–31 March2024 Elo Mutual Pension Insurance Company
Interimreport1 January–31 March2024 Elo Mutual Pension Insurance Company
 
Instant Issue Debit Cards - High School Spirit
Instant Issue Debit Cards - High School SpiritInstant Issue Debit Cards - High School Spirit
Instant Issue Debit Cards - High School Spirit
 
原版1:1复刻温哥华岛大学毕业证Vancouver毕业证留信学历认证
原版1:1复刻温哥华岛大学毕业证Vancouver毕业证留信学历认证原版1:1复刻温哥华岛大学毕业证Vancouver毕业证留信学历认证
原版1:1复刻温哥华岛大学毕业证Vancouver毕业证留信学历认证
 
Vp Girls near me Delhi Call Now or WhatsApp
Vp Girls near me Delhi Call Now or WhatsAppVp Girls near me Delhi Call Now or WhatsApp
Vp Girls near me Delhi Call Now or WhatsApp
 
Call Girls In Yusuf Sarai Women Seeking Men 9654467111
Call Girls In Yusuf Sarai Women Seeking Men 9654467111Call Girls In Yusuf Sarai Women Seeking Men 9654467111
Call Girls In Yusuf Sarai Women Seeking Men 9654467111
 
government_intervention_in_business_ownership[1].pdf
government_intervention_in_business_ownership[1].pdfgovernment_intervention_in_business_ownership[1].pdf
government_intervention_in_business_ownership[1].pdf
 
Quantitative Analysis of Retail Sector Companies
Quantitative Analysis of Retail Sector CompaniesQuantitative Analysis of Retail Sector Companies
Quantitative Analysis of Retail Sector Companies
 
Call Girls Service Nagpur Maya Call 7001035870 Meet With Nagpur Escorts
Call Girls Service Nagpur Maya Call 7001035870 Meet With Nagpur EscortsCall Girls Service Nagpur Maya Call 7001035870 Meet With Nagpur Escorts
Call Girls Service Nagpur Maya Call 7001035870 Meet With Nagpur Escorts
 
Attachment Of Assets......................
Attachment Of Assets......................Attachment Of Assets......................
Attachment Of Assets......................
 
Vip B Aizawl Call Girls #9907093804 Contact Number Escorts Service Aizawl
Vip B Aizawl Call Girls #9907093804 Contact Number Escorts Service AizawlVip B Aizawl Call Girls #9907093804 Contact Number Escorts Service Aizawl
Vip B Aizawl Call Girls #9907093804 Contact Number Escorts Service Aizawl
 
call girls in Nand Nagri (DELHI) 🔝 >༒9953330565🔝 genuine Escort Service 🔝✔️✔️
call girls in  Nand Nagri (DELHI) 🔝 >༒9953330565🔝 genuine Escort Service 🔝✔️✔️call girls in  Nand Nagri (DELHI) 🔝 >༒9953330565🔝 genuine Escort Service 🔝✔️✔️
call girls in Nand Nagri (DELHI) 🔝 >༒9953330565🔝 genuine Escort Service 🔝✔️✔️
 
Log your LOA pain with Pension Lab's brilliant campaign
Log your LOA pain with Pension Lab's brilliant campaignLog your LOA pain with Pension Lab's brilliant campaign
Log your LOA pain with Pension Lab's brilliant campaign
 
letter-from-the-chair-to-the-fca-relating-to-british-steel-pensions-scheme-15...
letter-from-the-chair-to-the-fca-relating-to-british-steel-pensions-scheme-15...letter-from-the-chair-to-the-fca-relating-to-british-steel-pensions-scheme-15...
letter-from-the-chair-to-the-fca-relating-to-british-steel-pensions-scheme-15...
 
Bladex 1Q24 Earning Results Presentation
Bladex 1Q24 Earning Results PresentationBladex 1Q24 Earning Results Presentation
Bladex 1Q24 Earning Results Presentation
 
Stock Market Brief Deck for "this does not happen often".pdf
Stock Market Brief Deck for "this does not happen often".pdfStock Market Brief Deck for "this does not happen often".pdf
Stock Market Brief Deck for "this does not happen often".pdf
 

DEA Initiation Report

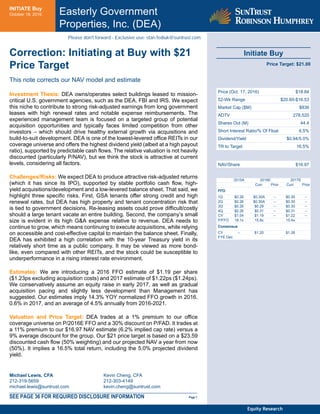
  • 1. INITIATE Buy October 18, 2016 Easterly Government Properties, Inc. (DEA) Initiate Buy Price Target: $21.00 Price (Oct. 17, 2016) $18.84 52-Wk Range $20.60-$16.53 Market Cap ($M) $836 ADTV 278,520 Shares Out (M) 44.4 Short Interest Ratio/% Of Float 6.5% Dividend/Yield $0.94/5.0% TR to Target 16.5% NAV/Share $16.97 2015A 2016E 2017E Curr. Prior Curr. Prior FFO 1Q $0.26 $0.30A -- $0.30 -- 2Q $0.26 $0.30A -- $0.30 -- 3Q $0.26 $0.29 -- $0.30 -- 4Q $0.26 $0.31 -- $0.31 -- CY $1.04 $1.19 -- $1.22 -- P/FFO 18.1x 15.8x 15.4x Consensus CY -- $1.20 $1.26 FYE Dec Michael Lewis, CFA 212-319-5659 michael.lewis@suntrust.com Kevin Cheng, CFA 212-303-4149 kevin.cheng@suntrust.com Correction: Initiating at Buy with $21 Price Target This note corrects our NAV model and estimate Investment Thesis: DEA owns/operates select buildings leased to mission- critical U.S. government agencies, such as the DEA, FBI and IRS. We expect this niche to contribute to strong risk-adjusted earnings from long government leases with high renewal rates and notable expense reimbursements. The experienced management team is focused on a targeted group of potential acquisition opportunities and typically faces limited competition from other investors – which should drive healthy external growth via acquisitions and build-to-suit development. DEA is one of the lowest-levered office REITs in our coverage universe and offers the highest dividend yield (albeit at a high payout ratio), supported by predictable cash flows. The relative valuation is not heavily discounted (particularly P/NAV), but we think the stock is attractive at current levels, considering all factors. Challenges/Risks: We expect DEA to produce attractive risk-adjusted returns (which it has since its IPO), supported by stable portfolio cash flow, high- yield acquisitions/development and a low-levered balance sheet. That said, we highlight three specific risks. First, GSA tenants offer strong credit and high renewal rates, but DEA has high property and tenant concentration risk that is tied to government decisions. Re-leasing assets could prove difficult/costly should a large tenant vacate an entire building. Second, the company’s small size is evident in its high G&A expense relative to revenue. DEA needs to continue to grow, which means continuing to execute acquisitions, while relying on accessible and cost-effective capital to maintain the balance sheet. Finally, DEA has exhibited a high correlation with the 10-year Treasury yield in its relatively short time as a public company. It may be viewed as more bond- like, even compared with other REITs, and the stock could be susceptible to underperformance in a rising interest rate environment. Estimates: We are introducing a 2016 FFO estimate of $1.19 per share ($1.23ps excluding acquisition costs) and 2017 estimate of $1.22ps ($1.24ps). We conservatively assume an equity raise in early 2017, as well as gradual acquisition pacing and slightly less development than Management has suggested. Our estimates imply 14.3% YOY normalized FFO growth in 2016, 0.6% in 2017, and an average of 4.5% annually from 2016-2021. Valuation and Price Target: DEA trades at a 1% premium to our office coverage universe on P/2016E FFO and a 30% discount on P/FAD. It trades at a 11% premium to our $16.97 NAV estimate (6.2% implied cap rate) versus a 9% average discount for the group. Our $21 price target is based on a $23.59 discounted cash flow (50% weighting) and our projected NAV a year from now (50%). It implies a 16.5% total return, including the 5.0% projected dividend yield. SEE PAGE 36 FOR REQUIRED DISCLOSURE INFORMATION Page 1 Equity Research Please don't forward - Exclusive use: stan.fediuk@suntrust.com
  • 2. Table of Contents Scenario Analysis...........................................................................................................................................3 Company Profile............................................................................................................................................4 Investment Summary....................................................................................................................................5 Portfolio Profile.............................................................................................................................................9 Internal Growth...........................................................................................................................................12 External Growth..........................................................................................................................................15 Earnings and NAV Estimates.......................................................................................................................20 Balance Sheet and Leverage .......................................................................................................................23 High Dividend Yield (and Payout Ratio) ......................................................................................................26 Management Team.....................................................................................................................................27 Valuation.....................................................................................................................................................30 Investment Recommendation and Price Target.........................................................................................35 Easterly Government Properties, Inc. Page 2 of 38
  • 3. Scenario Analysis Figure 1: DEA Scenario Analysis Source: Company documents; STRH Target Price Upside Target Price Target Price Downside $22.50 $21.00 $17.25 Probability Probability Probability 25% 65% 10% Bull Case STRH Case Bear Case The GSA continues to grow its leased private sector portfolio at above average growth rates. The GSA determines its leased footprint is appropriate and grows the portfolio at historical rates. The GSA materially reduces its footprint as leases expire. Development yields and volume are better than expected, thus improving external growth. Development yields and volume are in line with our model ($100 million over the next five years at 7.5%). DEA develops less than $200 million of projects over the next five years and/or yields come in below our expectations. Steady/lower interest rates and investor demand for yield drives property values and/or income stocks higher. Interest rates are range-bound and cap rates stabilize near current levels. Higher interest rates contribute to a modest increase in cap rates and income stocks become relatively less attractive. DEA completes acquisitions above the high end of management's $75-$125 million annual guidance and yields are a bit better. Acquisition volume and yields are roughly in line with our expectations ($120 million annually at 7%). Acquisition volume and/or yields fall short of our estimates. Limited supply and healthy demand lead to rent spreads above historical averages (which are around +20%). Market rents gradually increase, driving rent spreads not dissimilar from historical averages. Nearly all leases are renewed. Market rents slip or another factor causes the government to negotiate less favorable renewal terms for the landlord. One or more tenants move out. Easterly Government Properties, Inc. Page 3 of 38
  • 4. Company Profile Easterly Government Properties is a publicly-traded (NYSE: DEA), self-managed, fully-integrated office REIT headquartered in Washington D.C. DEA is focused on the acquisition, development and management of Class A commercial properties that are primarily leased to mission-critical U.S. Government agencies, including but not limited to the DEA, FBI, ICE and IRS. DEA was originally founded in 2011 as Easterly Partners, LLC, and subsequently merged with Western Devcon to form Easterly Government Properties, Inc. The company completed its IPO on February 5, 2015. Following several acquisitions, it now owns 41 properties (including three 3Q16 acquisitions) encompassing 2.8 million sf (as of 6/30/16) and has a market cap of $0.8 billion (as of 10/17/16). Figure 2: Company Profile Source: Company documents; SNL Financial; Factset; STRH Institution Name Easterly Government Properties, Inc. Trading Symbol & Exchange DEA-US Exchange NYSE Industry Real Estate Property Type Office Address 2101 L Street NW City, State, Zip Washington, DC 20037 Phone Number (202) 595-9500 State of Incorporation MD Web Address http://www.easterlyreit.com Company Description Corporate Headquarters Chief Executive Officer William C. Trimble III Chief Financial Officer Meghan G. Baivier Chief Operating Officer Meghan G. Baivier Chief Accounting Officer Alison M. Bernard EVP Development & Acquisitions Michael P. Ibe EVP Government Relations Ron E. Kendall Investor Relations Professional Lindsay Winterhalter Chairman of the Board Darrell W. Crate IPO Date (mm/dd/yyyy) 2/5/2015 IPO Price (Reported) 15.00 IPO Gross Proceeds (Reported) 207,000,000 IPO Details Management Easterly Government Properties, Inc. Page 4 of 38
  • 5. Investment Summary Strategy We believe DEA’s competitive advantage stems from management leveraging its extensive network of relationships and experience/knowledge of GSA real estate needs to win attractive acquisition and development opportunities. Approximately 96% of annualized base rent is from GSA leases at properties which often require specialized security features and credentialed personnel to manage/service them. As of 2Q16, the DEA, FBI and ICE accounted for ~44% of the company’s total revenue. The company has a disciplined acquisition strategy, with only about 500 properties across the country that it would consider owning. It targets class-A buildings greater than 40,000 sf that are at least 85% leased to a single U.S. government tenant. The property must be strategically located and less than 20 years old with a 10-year minimum lease term (for developments). DEA also prefers security-related, growing federal agencies with an enduring mission and increasing priority. DEA is currently tracking ~$700 million of properties and actively evaluating around $200 million (the 41 currently-owned properties, totaling nearly 3 million sf, were all acquired since 2010). Management intends to acquire $75-$125 million of assets per year going forward; we model $120 million annually at a 7% cap rate. The company also pursues build-to-suit opportunities (we model $200 million total at a 7.6% yield over the next five years, versus $250 million suggested by management). DEA maintains one of the lowest-levered balance sheets in our coverage universe, while paying out nearly all of its free cash flow as dividends to investors. We believe it is important to the company’s growth and leverage plans that the capital markets remain open and available. Positive Investment Thesis In our view, DEA should be a steady growing income vehicle. Long leases (with expense increase reimbursements) to government tenants at very select locations should underpin predictable, low- volatility earnings. Meanwhile, management will continue to leverage its relationships and knowledge of GSA real estate requirements to source acquisitions and build-to-suit development opportunities. DEA is one of the lowest-levered office REITs in our coverage universe and offers the highest dividend yield (albeit at a high payout ratio), supported by predictable cash flows. Figure 3: Investment Summary Source: STRH Secure High-Quality Cash Flows: The company’s portfolio is 100% leased and the U.S. Government accounts for 96% of DEA’s annual base rent. These GSA leases are paid through the Federal Buildings Fund (which is not subject to direct federal appropriations) and there has never been a default. Additional factors contributing to steady cash flows include 1) long 10- to 20-year initial leases and five- to 10-year renewals, 2) high renewal rates historically in the low-90% range, supported by significant Investment Positives Keep an Eye On… Expectation of more predictable, lower-volatility earnings. Modest premium to NAV relative to other office REITs. Large, selective group of acquisition targets with limited competition. Below-average projected internal growth. Unparalleled tenant credit. Potentially challenging re-leasing/repurposing if tenant leaves. Low average age for property portfolio (<12 years). Tenant concentration risk (even if it is great credit). Long leases with high renewal rates and expense reimbursements. Some leases have early-out clauses. Strong relationships, market knowledge and expertise in niche. Small size and high G&A expense as percentage of revenue. Strong balance sheet; low financial leverage. Continued capital markets accessibility is important. Highest dividend yield in our office coverage universe. High FAD payout ratio. Easterly Government Properties, Inc. Page 5 of 38
  • 6. capex spend on behalf of the tenant, and 3) CPI-based tenant reimbursement of operating expense increases and usually reimbursement for all property tax increases. According to DEA, renewal rent spreads have averaged 18%-26% historically. Well-Positioned For Acquisitions/Development: Management’s experience and relationships in its niche provide an advantage sourcing/closing acquisitions, with limited competition. DEA maintains a proprietary database of thousands of properties and is targeting a subset of about 500 leases/locations that meet specific criteria. DEA is currently tracking ~$700 million of potential acquisitions and is actively evaluating roughly $200 million. The GSA’s shift to more leased properties works in DEA’s favor, and naturally, the average age of U.S. Government-owned properties is 47 years and GSA leased inventory has grown 29% since 1998. We are modeling $120 million of annual acquisitions at a 7% yield, which are the primary drivers of our conservative 4.5% projected annual FFO growth over the next five years. DEA will also pursue build-to-suit development opportunities, which could drive upside to our estimates (we model $200 million at 7.6% yields over the next five years, but management suggested $250 million). Strong Balance Sheet and High Yield: DEA has one of the strongest balance sheets within our office coverage universe and looks to maintain one to two years of capital capacity before it would need to access the capital markets. DEA’s net debt-to-market capitalization is 31% (versus a 38% average for our office coverage universe), its net debt-to-EBITDA is 4.9x at 2Q16 (versus 7.7x for the group) and its net- debt to GAV is 25% (versus 38%). Management is targeting 40% net debt-to-EV and 6x net debt-to- EBITDA. Expect Good Risk-Adjusted Returns: The stock has returned 30% since its 2/6/15 IPO versus 5% for the RMS and 3% on average for our office coverage universe. Meanwhile, the stock’s daily standard deviation of 1.5% was only slightly higher than the 1.3% average for our office coverage (1.0% for the RMZ), supported by the stability of portfolio cash flow and low-levered balance sheet. Said differently, DEA has exhibited a better return per unit of risk than every office REIT we cover other than PDM (and better than the RMS) during its relatively short time as a publicly-traded company. We expect DEA to continue to offer an attractive combination of growth and stability. Introducing valuation into the equation, we calculate attractive five-year FFO and FAD PEG ratios (2016-2021 growth over 2016E earnings multiples) that rank in the top half of our 13-company office coverage universe. Differentiated Business Model with Experienced Management: The company’s unique investment strategy focuses on owning and operating high-quality assets that are occupied by mission-critical government agencies (i.e. the DEA, FBI, ICE, IRS). We believe the company is most often compared with Government Properties Income Trust (GOV, $20.92, Not Rated) and Corporate Office Properties (OFC, $27.68, Buy). Relative to GOV, we think DEA has a higher-quality portfolio, more shareholder-friendly internal management structure and better balance sheet. DEA primarily leases to the GSA, whereas OFC’s properties are typically leased to defense contractors (OFC also owns a significant amount of conventional office properties). Notably, the Department of Justice budget has grown by a 3.4% CAGR over the past 10 years, versus a -0.4% CAGR for the Department of Defense. DEA’s senior management team averages more than 18 years of GSA-related experience and has extensive experience with government real estate management, development, and property & asset management. These relationships should serve as a key competitive advantage in sourcing acquisitions (both on- and off-market) and developments, and retaining tenants. Easterly Government Properties, Inc. Page 6 of 38
  • 7. Key Challenges/Risks Tenant Concentration Risk: The U.S. government accounts for 91% of DEA’s total square footage and 96% of its annualized base rent (“ABR”). More specifically, the DEA, FBI and ICE account for ~44% of total ABR. We believe DEA’s specific tenants (and locations) are at low risk of cutbacks due to budgetary restrictions or changes in policy, but the locations and specialized nature of the buildings could make many challenging/expensive to re-lease in the event of a move-out. It is notable that 21% of DEA’s leases (by revenue) are in “soft term,” which is a period near the end of some GSA leases during which the lease has not expired, but the tenant has the option of moving out. Property Concentration Risk: Related to the risk above, as of 2Q16, DEA’s four largest buildings (IRS- Fresno, PTO-Arlington, FBI–San Antonio & Omaha) accounted for ~26% of ABR. None of the tenants are expected to move out, but even one could significantly impact earnings. GSA Downsizing/Political Risk: In January 2016, the Government Accountability Office (“GAO”) issued a report which examined the GSA’s leasing costs. The scope of the report was to identify any opportunities to increase efficiency and reduce leasing costs paid to the private sector. The report suggested that the GSA should: 1) enhance competition by encouraging tenants to modify their geographic and building requirements; 2) consider seeking the ability to use the Federal Building Fund balances to reduce interest rates related to amortized tenant improvements; and 3) provide tenants with an option to reduce fees by choosing non-cancelable occupancy agreements (no soft term). The GSA has agreed with the first two suggestions, but not the third. We believe loosening GSA real estate requirements (location or specific building requirements) could increase competition for DEA. However, any potential changes to the current strategy/mandate are likely to take a significant amount of time to implement. Long-term trends remain favorable for DEA, as GSA leased inventory has grown 29% since 1998. However, the GAO report signifies that the government is cognizant of the need for cost containment, which could represent a longer-term risk. Of course, the upcoming presidential election also adds an element of uncertainty with respect to budget growth and priorities. Acquisition/Capital Markets Risk: Though the core portfolio should provide steady cash flow, the primary earnings growth drivers will be acquisitions and development. The company’s relatively narrow focus could mean there may be times when transaction opportunities are light. Moreover, DEA will need to access the capital markets (both debt and equity) in order to continue its much-needed growth. DEA’s small size presents some challenges, particularly because one tenant move-out could be fairly damaging at this point. G&A expense is currently around 11% of revenue, evidence that efficiencies are possible with scale – both a risk and an opportunity. Interest Rate Risk: Management seeks to limit the impact of interest rate changes on earnings and cash flow, primarily through a moderate level of overall borrowings and interest rate swap agreements. However, DEA’s valuation may still be more influenced by adverse interest rate movements than other office REITs, given the bond-like characteristics of the company. In its relatively brief history as a public company, the stock has had a stronger correlation with the 10-year Treasury yield (-80%) and lower beta (0.48) than other stocks in our office coverage universe (see Figure 48). Therefore, DEA could Easterly Government Properties, Inc. Page 7 of 38
  • 8. underperform if bond yields rise significantly, although there may still be diversification benefits to owning it in a portfolio. We should note that we are not convinced long-term interest rates will move significantly higher in the near term. Additionally, we think it is too early to tell how the stock will correlate with rates and the broader market over time. The company does have long-term leases typically without rent escalators, but GSA tenants are less likely to be impacted by broader economic shifts and the relative likelihood of an earnings miss appears low. Meanwhile, DEA maintains one to two years of capital capacity to meet its external growth goals, so it could take advantage (at least for a while) in the event of any increase in acquisition cap rates. Easterly Government Properties, Inc. Page 8 of 38
  • 9. Portfolio Profile As of 6/30/16, Easterly’s consolidated portfolio included 38 properties, totaling 2.8 million square feet across 44 leases (up from 29 properties and 2.1 million sf at the 1Q15 IPO). California, Texas and Virginia account for 54% of the portfolio (by NOI), which is mostly office space (78%) with smaller allocations to laboratory (11%) courthouse (8%) and warehouse (3%) properties. DEA’s three largest tenants, the Drug Enforcement Agency (DEA, 19%), Federal Bureau of Investigation (FBI, 16%) and Immigration and Customs Enforcement (9%), account for a combined ~44% of annualized lease income. In total, 96% of the portfolio is leased to the U.S. government, including more than 60% to security- related agencies. The portfolio has a weighted average lease term of approximately seven years, an average annual rental rate of $32.68 psf and an average age of 11.8 years (making it one of the youngest office REIT portfolios). Figure 4: DEA 2Q16 NOI by State Figure 5: DEA 2Q16 NOI by Property Type Source: Company documents; SNL Financial; STRH DEA Knows What It Wants: The company has identified roughly 500 properties in the U.S. that fit its investment criteria. These are strategically-located, class-A buildings that are less than 20 years old, greater than 40,000 sf, and at least 85% leased to a single government agency. DEA prefers security- related, growing federal agencies with an enduring mission and increasing priority (see Figure 6 & Figure 7 for tenant list and recent budget growth rates). Developments must have a minimum lease term of 10 years. There is also increased focus on environmental sustainability, which has become a more important factor for the government when considering potential locations. CA, 30% TX, 14% VA, 10% NM, 9% NE, 10% CO, 6% AR, 2% SC, 4% WV, 2% MS, 2% GA, 3% MT, 2% NY, 1% FL, 4% Office, 77% Warehouse/ Distribution, 3% Courthouse/ Office, 8% Laboratory, 11% Easterly Government Properties, Inc. Page 9 of 38
  • 10. Figure 6: DEA – Top 10 Tenants Source: Company documents; SNL Financial; STRH Figure 7: DEA – Government agency tenant budget growth (2005 – 2015)1 Note 1 : White bars denote top 3 DEA tenants Source: Company documents; SNL Financial; STRH Market fundamentals are not as important to DEA’s performance as they are for other REITs, due to the company’s niche tenant base. That said, we provide a look at office employment, occupancy and rent growth for reference below. The company’s top three properties (Fresno, Metro DC/NoVA, and San Antonio) account for a combined 21% of total rent. Fresno and Metro DC are expected to experience annual employment growth of 0.4% and 0.3%, respectively, over the next five years, which fall below the national average of 1.1%. However, San Antonio is expected to outpace the national average with employment growth of 1.8% annually. Tenant Leased sqft (000s) Ann. Lease Income ($'000s) % of Total Ann. Revenue 1 Drug Enforcement Administration ("DEA") 405 $17,478 19.8% 2 Federal Bureau of Investigation ("FBI") 459 $14,250 16.2% 3 Immigration and Customs Enforcement ("ICE") 183 $7,663 8.7% 4 Internal Revenue Service ("IRS") 180 $7,430 8.5% 5 Administrative Office of the U.S. Courts ("AOC") 184 $7,309 8.1% 6 Patent and Trademark Office ("PTO") 190 $6,530 7.3% 7 U.S. Forest Service ("USFS") 191 $5,440 6.1% 8 Customs and Border Protection ("CBP") 127 $5,373 6.0% 9 Department of Transportation ("DOT") 130 $3,697 4.2% 10 U.S. Citizens and Immigration Services ("USCIS") 138 $3,242 3.7% 2,187 $78,412 88.6%Total -20% 0% 20% 40% 60% 80% 100% 120% PTO CBP FBI MEPCOM ICE SSA USCG DEA AOC DoT DoE IRS DoD USFS Easterly Government Properties, Inc. Page 10 of 38
  • 11. Figure 8: Cumulative Office Job Growth Since 4Q06 Source: Company documents; STRH As shown below, CBRE forecasts improving occupancy for Northern VA over the next five years (+2.1 pps to 84.2%), but occupancy declines for Fresno (-0.4pps to 86.5%) and San Antonio (-4.3pps to 81.8%). For reference, the national office occupancy rate is expected to drop 1.6pps to 85.4% over the same period. CBRE forecasts above-average rental growth over the next five years for Fresno (+2.5% annually) and San Antonio (+2.5%), while Northern VA will likely lag (-0.4%). National office rent growth is expected to average 0.7% annually over the next five years. Figure 9: Office Occupancy for DEA’s Top Markets Figure 10: Rental Rates for DEA’s Top Markets Source: CBRE; STRH -20% -10% 0% 10% 20% 30% 40% 4Q2006 4Q2007 4Q2008 4Q2009 4Q2010 4Q2011 4Q2012 4Q2013 4Q2014 4Q2015 4Q2016 4Q2017 4Q2018 4Q2019 4Q2020 4Q2021 Fresno Metro DC San Antonio US 65% 70% 75% 80% 85% 90% 95% 100% 1994 1996 1998 2000 2002 2004 2006 2008 2010 2012 2014 2016 2018 2020 Fresno Northern VA SanAntonio US $5 $10 $15 $20 $25 $30 $35 $40 1990 1992 1994 1996 1998 2000 2002 2004 2006 2008 2010 2012 2014 2016 2018 2020 Fresno Northern VA San Antonio US Easterly Government Properties, Inc. Page 11 of 38
  • 12. Internal Growth More Stability than Growth Long-term leases without annual rent escalators (albeit with expense growth reimbursements) should lead to limited core growth. We are modeling 99%-100% occupancy over the next few years, with rent spreads near historical averages (lower in the near-term and higher in the later years of our model). DEA is not yet to the point of providing same-store NOI growth, but we estimate it will likely run in the low single-digit range. Management has identified three key drivers of internal growth, which we discuss below. 1) Strong Lease Renewal Spreads (Albeit Spread Over a Long Time) GSA leases do not contain annual rent bumps and the new base rent upon renewal is typically reset based on several factors, including 1) inflation, 2) the replacement cost of the building and 3) property enhancements since the prior lease renewal. As illustrated in Figure 11, between 2006 and 2014, the average rent increase for GSA leases within DEA’s target market (class A federal buildings greater than 40,000 sf at least 85% leased to a government tenant) was approximately 18% for leases with terms of 10 to 15 years and about 26% for leases with terms of 15 years or more – which implies about a 1-2% CAGR over that duration. Notably, initial leases are typically 10-20 years, and renewals 5-10 years. In DEA’s experience, single- tenant properties larger than 50,000 sf that are 100% leased to the U.S. Government have renewed with 93%-95% frequency. Figure 11: Target Market Lease Renewal Spreads1 Note 1 : Represents change in rent/sf for properties in the company’s target market, renewed between Jan 2006 and Sep 2014 Source: Company documents; STRH Leases totaling only 6.4% of annualized base rent are scheduled to expire through 2017 (see Figure 12). While the low tenant rollover implies a stable revenue stream, it also implies that there is limited rent growth opportunity from a relatively small amount of flat leases rolling over. Two larger leases (8.5% of 17.7% 26.1% 0% 5% 10% 15% 20% 25% 30% 10-15 year leases 15 year+ leases Easterly Government Properties, Inc. Page 12 of 38
  • 13. ABR at IRS–Fresno and 1.9% of ABR at CBP–Chula Vista) are set to expire in 2018, though like essentially all of the company’s leases, the likelihood of renewal is high. Importantly, the lease expiration schedule does not reflect that tenants representing 21% of rent are currently on “soft term,” which is a period near the end of the lease when the tenant has the right to vacate prior to scheduled expiration. It is common for GSA tenants pay higher rent in order to include this option in the lease, though it is rarely (if ever) used (the GAO actually recommended the GSA stop paying for this option because it goes unused, but the GSA appears to like it). Figure 12: DEA - Lease Expiration Schedule by % of Total Annualized Income Source: Company documents; STRH 2) Value Enhancing Asset Management One of DEA’s key focuses includes efficient property management and property improvements, which increase the asset’s value to its tenants and improve the likelihood of lease renewal. DEA’s asset management team conducts frequent audits of existing properties to keep the facilities in optimal condition. Moreover, DEA will work in close partnership with the tenant agencies to manage the construction of specialized, agency-specific design enhancements. These custom build-outs typically generate a construction management fee paid by the tenant (~15% of the construction costs). For example, DEA recently worked in collaboration with the FBI to construct a new visitor screening facility at the entrance of its Little Rock property. The enhancement significantly increased the security of the facility and improved tenant access, helping solidify DEA’s relationship with the FBI (and the FBI’s preference for the building). In addition, DEA will seek to reduce the operating costs on properties by implementing energy efficiency programs. These programs are designed to help the U.S. Government achieve its conservation and efficiency goals. Currently, DEA owns 11 LEED (“Leadership in Energy & Environmental Design”) certified buildings. Overall, we believe the in-place portfolio can generate stable organic growth of 1%-2% annually, through rent roll-ups and cost efficiency improvements. 0.4% 5.8% 10.1% 10.5% 8.1% 65.1% 0% 10% 20% 30% 40% 50% 60% 70% 2016 2017 2018 2019 2020 Thereafter Easterly Government Properties, Inc. Page 13 of 38
  • 14. 3) Reimbursement of Operating Expense Increases GSA leases typically provide for an annual operating cost adjustment designed to compensate the company for operating cost increases (i.e. costs related to cleaning services, supplies, maintenance, trash removal, landscaping, heating, electricity, etc.). This operating cost adjustment is calculated by multiplying an operating expense base (negotiated at the commencement of the lease), by the percentage change in the urban CPI. Moreover, many of these leases also contain a provision in the event that the tenant vacates the property. This provision allows the tenant to reduce its operating expense reimbursement by the portion of the property that is no longer in use. Leases structured this way typically require the tenant to pay a modestly higher fee to account for the risk of a GSA vacancy (which benefits Easterly given its high renewal rates). Additionally, the tenant is required to pay for any increases in property taxes and many of DEA’s leases include a tenant improvement allowance within base rent, which is amortized over the life of the lease at a market rate. In general, many of DEA’s GSA leases are structured in which the tenant pays for the majority of the costs (with the exception of insurance). Also of note, GSA leases generally require that rent is paid monthly in arrears, whereas commercial leases typically require a payment in advance. Easterly Government Properties, Inc. Page 14 of 38
  • 15. External Growth Acquisitions & Development Are DEA’s Key Growth Drivers Our positive investment thesis on the stock is largely predicated on DEA’s ability to complete accretive acquisitions and build-to-suit developments. As previously mentioned, senior management has an extensive network of relationships and knowledge of the GSA sector, which it can draw upon to source both on- and off-market acquisitions. The company is very disciplined in its approach, with only very specific assets meeting its investment criteria. We believe competition is limited within DEA’s niche, supporting attractive acquisition/development yields and risk-adjusted returns. We are modeling $120 million of annual acquisitions at a 7% cap rate and $200 million of development over the next five years at a 7.6% yield – consistent with management’s acquisition guidance and slightly conservative relative to its development expectations. Advantage of Relationships/Experience: As a group, DEA’s senior management has worked on the acquisition of ~2.1 million sf and development of ~1.2 million sf of GSA-leased properties. Along with its proven track record of building and operating specialized GSA buildings, DEA has a large network of government agency relationships which provide a competitive advantage. Perhaps most notably, Senior Advisor Joseph Moravec (former EVP of Government Relations) and EVP of Government Relations Ron Kendall both have had previous roles within the GSA. Mr. Moravec served as the commissioner of the Public Building Service, while Mr. Kendall served as the National Director of Leasing Policy for the Public Building Service. We believe the perspective and relationships management has cultivated over many years provide DEA with an important competitive advantage within its GSA real estate niche. Figure 13 reveals how fragmented the market for GSA-leased properties is and, combined with Figure 14 and Figure 15, hints at how large the opportunity can be. Figure 13: Top GSA Landlords By Square Footage Source: Company documents; STRH The Target Market: The US government is the largest employer in the world, and the largest office tenant in the US. The General Services Administration (GSA) is an independent agency of the United States government that helps manage and support a number of federal agencies. The GSA owns and leases more than 377 million square feet across 9,600 buildings across the country. As illustrated in % Market Top 10 Owners RSF (000s) Ownership Government Properties Trust 6,887 3.6% The JBG Companies 5,038 2.6% Corporate Office Properties Trust 3,776 2.0% Vornado Realty Trust 3,752 1.9% NGP 3,175 1.6% Easterly Government Properties 2,417 1.3% LCOR 2,387 1.2% Brookfield Office Properties 2,099 1.1% Boyd Watterson 2,085 1.1% Urban America Advisors 2,057 1.1% Top 10 Owners 33,673 17.4% Total GSA-Leased RSF 193,007 100.0% Easterly Government Properties, Inc. Page 15 of 38
  • 16. Figure 14, the square footage of property leased by the GSA has steadily increased in recent years (29% since 1998), while the amount of federally owned space has declined by a modest amount (-1.3% since 1998). As of 2014, the GSA leased 193.4 million sf, versus the 183.4 million sf owned. Figure 14: GSA-Leased Inventory Versus GSA-Owned Inventory Source: Company documents; STRH The robust growth in GSA-leased assets is a positive driver for DEA, and there are reasons to believe the shift from owned to leased assets could continue. Much of the Government owned space is so old (47 years on average versus 12 for DEA’s portfolio) and inefficient from a space/energy usage perspective that the properties would not qualify for a lease under the Government’s own energy efficiency requirements. This implies that the Government would likely require significant capital expenditures in order to bring these owned properties up to par. We think this is a strong argument for why the government is likely continue to grow its allocation of leased properties versus owned. Figure 15: DEA Focuses on Mission-Critical U.S. Government Agencies Source: Company documents; STRH • U.S. Federal Leases • 550M rsf (55,000 locations) • GSA Inventory • 195M rsf (8,400 leases; 7,000 locations) • >40,000 rsf properties • 125M rsf (1,050 leases; 950 Locations) • Target Market: Single Tenant Leased • 70M rsf (500 Leases & Locations) Easterly Government Properties, Inc. Page 16 of 38
  • 17. As discussed earlier, management maintains a proprietary database of GSA-leased properties and knows exactly which roughly 500 meet its investment criteria (see Figure 15 and the detailed description). DEA is only focusing on about 12% of the existing federal lease market right now or ~35% of total GSA inventory. Management has stated that its acquisition pipeline remains robust at about $700 million, including approximately $200 million in active discussions. Acquisitions: Management has guided towards a long term acquisition target of $75-$125 million. That said, DEA closed $171 million of acquisitions in 2015 and is now guiding to $175 million in 2016, following a $97.4 million portfolio purchase in 3Q16 which brought year-to-date activity to $129 million. There is certainly no guarantee that DEA will continue to outpace acquisition volume expectations, but the past two years suggest there could be upside. DEA recently announced the off-market acquisition of a four-property portfolio totaling 302,000 sf for $97.4 million. Below, we provide a brief description of the four properties, the first three of which closed on 7/1/16, while the final property (FBI–Albany) is expected to close in 4Q16. We think this portfolio is a good example of the types of properties DEA owns and will look to own in the future.  DEA – Birmingham: This build-to-suit was completed in 2005 and houses one of three DEA district offices within the New Orleans Division and one of four Alabama field offices for the Bureau of Alcohol, Tobacco, Firearms and Explosives (“ATF”). The property encompasses 35,616 sf and is 100% leased to the GSA through 2020. It features 90-foot setbacks, holding cells, anti-climb security fencing and a fenced sally port.  EPA – Kansas City: This 71,979 sf build-to-suit laboratory was completed in 2003, is LEED gold and is 100% leased to the GSA through 2023. This EPA laboratory is one of 10 in the region and serves as a special-purpose laboratory where scientists perform chemical and biological analyses using state of the art instruments.  FBI – Birmingham: This 96,278 sf property is one of the 56 field offices of the FBI and is 100% leased to the GSA through 2020. The build-to-suit property was completed in 2005 and possesses a number of security features including 100-foot setbacks, reinforced security fencing and vehicle barriers, and redundant power systems.  FBI – Albany: This 98,184 sf property is one of the 56 field offices of the FBI and one of two in Albany; it is 100% leased to the GSA through 2018 and was acquired for $20.2 million. The build-to- suit property was completed in 1998, and possesses security features including 100-foot setbacks, reinforced security fencing and vehicle barriers, blast-resistant envelope and window features, and intrusion detection systems. FBI–Albany is responsible for the oversight of eight resident FBI agencies in the region. Easterly Government Properties, Inc. Page 17 of 38
  • 18. Figure 16: DEA - Birmingham Figure 17: EPA – Kansas City Source: SNL Financial; STRH Figure 18: FBI - Birmingham Figure 19: FBI – Albany Source: Company Reports; STRH Development: Management recently announced an FDA laboratory build-to-suit in Alameda CA, and suggested to us that it could develop around $250 million of assets at high-7% initial yields over the next five years. The company will not take any speculative development risk and will require at least 10 years of lease term for any build-to-suit project. Dispositions: DEA has not sold any properties since it became a public company early last year. However, we think there are few properties that could become a source of funds in the medium-term, including perhaps two SSA properties in California which total about 1% of DEA’s total rental revenue. External Growth Assumptions. We are modeling $174 million of 2016 acquisitions (including $122 million in 2H16) at a 7.3% cap rate, in line with management’s guidance of $175 million. We assume $120 million of acquisition in each future year, at a 7.0% cap rate. This is consistent with management’s suggestion of $75-$125 million per year, despite higher recent volume. Our model does not include any property dispositions until 2020 ($60 million at a 7.5% cap rate). We are assuming $200 million of developments at a 7.6% yield over the next five years, slightly conservative relative to the $250 million that management suggested it could do. Easterly Government Properties, Inc. Page 18 of 38
  • 19. Figure 20: DEA NOI Growth Profile Source: Company documents; STRH - 0 1 2 2 3 7 - 4 15 26 39 52 65 - - - - - - -- 10 20 30 40 50 60 70 2015 2016E 2017E 2018E 2019E 2020E 2021E Internal NOI External NOI Base NOI Easterly Government Properties, Inc. Page 19 of 38
  • 20. Earnings and NAV Estimates Funds From Operations: Our 2016 FFO estimate is $1.19 per share, or $1.23ps on a normalized basis (which excludes acquisition costs). This is at the low end of management’s $1.19-$1.23ps guidance and a penny per share below the $1.20ps consensus (we believe the consensus reflects estimated transaction costs, but cannot be certain). Our 2017 FFO estimate is $1.22ps, or $1.24ps on a normalized basis, versus the consensus of $1.27ps. Our estimates imply 14.3% YOY normalized FFO growth in 2016, largely driven by $174 million of acquisitions, and only 0.6% growth in 2017, impacted by higher interest expense and assumed equity issuance. We conservatively model an equity raise in early 2017, and development spending that does not generate resulting NOI until late-2018, weighing on 2017 growth. We project 4.5% annual normalized FFO growth from 2016-2021, which ranks sixth within our 13-company office coverage universe. Figure 21: DEA NAREIT FFOps Source: Company documents; SNL Financial; STRH Figure 22: DEA FFOps Beats and Misses Source: Factset; STRH $1.04 $1.19 $1.22 $1.25 $1.32 $1.41 $1.52 0% 2% 4% 6% 8% 10% 12% 14% 16% $0.00 $0.20 $0.40 $0.60 $0.80 $1.00 $1.20 $1.40 $1.60 2015 2016E 2017E 2018E 2019E 2020E 2021E NAREIT FFO FFO Growth (YoY % chg) Easterly Government Properties, Inc. Page 20 of 38
  • 21. Funds Available for Distribution: Long leases and very low tenant rollover, as well as tenant improvements paid for by tenants, should support healthy cash flow. We estimate FAD of $0.97 per share in 2016 and $1.03ps in 2017, implying a 15.9% YOY increase in 2016 followed by 6.1% growth. Our model implies 7.2% annual FADps growth from 2016-2021. Management aims to pay a common dividend as close to 100% of cash flow as possible, which means similar dividend growth (the current dividend yield is 5.0%). Figure 23: DEA Income Statement ($ thousands) Source: Company documents; STRH Easterly Government Properties, Inc SunTrust Robinson Humprey 2015 1Q16 2Q16 3Q16E 4Q16E 2016E 2017E 2018E 2019E 2020E 2021E Revenues Rental revenue 72,728 21,736 22,291 22,526 22,526 89,080 89,977 89,621 89,669 91,315 95,805 Tenant reimbursements 6,883 2,155 2,476 2,129 2,460 9,220 9,173 10,058 10,304 10,535 10,747 Expansion portfolio 1,999 3,118 5,117 20,454 34,359 52,822 69,598 83,003 Other income 212 80 154 101 102 437 418 431 444 457 471 Total revenues 79,823 23,971 24,921 26,755 28,207 103,853 120,023 134,469 153,238 171,904 190,027 Expenses Property operating expenses 14,743 4,333 5,085 4,731 4,731 18,879 18,918 18,798 18,853 19,199 20,142 Expansion portfolio 600 935 1,535 6,136 10,308 15,846 20,879 24,901 Real estate taxes 7,786 2,368 2,332 2,410 2,545 9,656 9,717 9,601 9,595 9,679 10,060 Depreciation and amortization 37,662 10,863 11,074 11,074 11,074 44,085 44,296 44,296 44,296 44,296 44,296 Depreciation and amortization - expansion portfolio 817 1,512 2,329 10,055 16,856 25,204 30,673 34,338 Acquisition costs 1,670 333 346 772 452 1,903 1,200 1,200 1,200 1,200 1,200 General, administrative and leasing expenses 8,941 3,036 3,052 3,050 3,060 12,198 12,712 13,166 13,817 14,646 15,520 Impairment losses 0 0 0 0 0 0 0 0 0 Other expenses 0 0 0 0 0 0 0 0 0 Total operating expenses 70,802 20,933 21,889 23,454 24,309 90,585 103,035 114,225 128,810 140,573 150,457 Net Operating Income 57,294 17,270 17,504 19,014 19,995 73,783 85,251 95,763 108,944 122,147 134,924 Operating income 9,021 3,038 3,032 3,301 3,897 13,268 16,988 20,244 24,428 31,332 39,570 Interest expense, net (5,559) (1,929) (1,995) (2,255) (2,601) (8,780) (11,363) (13,924) (16,885) (18,240) (20,070) Interest expense - expansion portfolio - - 0 0 0 0 0 0 Interest and other income 0 0 0 - - 0 0 0 0 0 0 Loss on early extinguishment of debt 0 0 0 0 0 0 0 0 0 0 0 Loss on interest rate derivatives 0 0 0 0 0 0 0 0 0 0 Equity in income of unconsolidated entities 0 0 0 - - 0 0 0 0 0 0 Income tax expense 0 - - 0 0 0 0 0 0 0 0 Income from continuing operations 3,462 1,109 1,037 1,046 1,296 4,488 5,625 6,320 7,543 13,092 19,500 Discontinued operations 0 0 0 0 0 0 0 0 0 0 0 Gain on sales of real estate 0 0 0 0 0 0 0 0 0 0 0 Net income (loss) 3,462 1,109 1,037 1,046 1,296 4,488 5,625 6,320 7,543 13,092 19,500 Net (income) loss attributable to noncontrolling interests Common units in LP 0 0 0 0 0 0 (585) Preferred units in LP 0 0 0 0 0 0 0 Non-controlling interest in OP (1,355) (434) (338) (408) (506) (1,685) (2,194) (2,465) (2,942) (5,106) (7,605) Preferred share dividends 0 0 0 0 0 0 0 0 0 Issuance costs associated with redeemed preferred shares 0 0 0 0 0 0 0 0 0 Net income attributable to DEA common shareholders 2,107 675 699 638 791 2,803 3,431 3,855 4,601 7,986 11,3100.05 FFO Real estate-related depreciation and amortization 37,662 10,863 11,074 11,891 12,586 46,414 54,351 61,152 69,500 74,969 78,634 Gain on sales of real estate (from continuing ops.) 0 0 0 0 0 0 0 0 0 0 0 Depreciation and amortization of unconsolidated real estate entities 0 0 0 0 0 0 0 0 0 0 0 Impairment losses on previously depreciated operating properties 0 0 0 0 0 0 0 0 0 0 0 Non-controlling Interests - preferred units in the OP 0 0 0 0 0 0 0 0 0 0 0 FFO allocable to other noncontrolling interests 0 0 0 0 0 0 0 0 0 0 0 FFO allocable to restricted shares 0 0 0 0 0 0 0 0 0 0 0 FFO attributable to preferred 0 0 0 0 0 0 0 0 0 0 0 Basic FFO (NAREIT) 41,124 11,972 12,111 12,937 13,882 50,902 59,977 67,473 77,042 88,061 98,134 Dividends on dilutive conv. prefs 0 0 0 0 0 0 0 0 0 0 Distributions on dilutive pref units in the OP 0 0 0 0 0 0 0 0 0 0 Diluted FFO (NAREIT) 41,124 11,972 12,111 12,937 13,882 50,902 59,977 67,473 77,042 88,061 98,134 Topic D-42 Charges 0 0 0 0 0 0 0 0 0 0 0 Early Retirement of Debt 0 0 0 0 0 0 0 0 0 0 0 Operating property acquisition costs 1,670 333 346 772 452 1,903 1,200 1,200 1,200 1,200 1,200 Impairment Losses / Gains on Real Estate 0 0 0 0 0 0 0 0 0 0 0 Other non recurring/ M2M gains/losses 0 0 0 0 0 0 0 0 0 0 0 FFO - Normalized 42,794 12,305 12,457 13,709 14,334 52,805 61,177 68,673 78,242 89,261 99,334 Straight-line rent & above/below mrkt amort (5,680) (1,710) (1,666) (1,680) (1,680) (6,736) (6,720) (6,720) (6,720) (6,720) (6,720) TI/LC and recurring Cap Ex (508) (75) (252) (181) (147) (654) (873) (1,080) (1,142) (1,106) (1,894) Other and other depreciation (1,680) (508) (517) (452) (412) (1,889) (1,537) (1,243) (902) (746) (536) Diluted FAD 33,256 9,679 9,676 10,625 11,643 41,623 50,846 58,430 68,278 79,489 88,984 Weighted-average shares outstanding-diluted (FFO NAREIT) 39,702 39,712 40,964 44,447 45,197 42,861 49,352 54,189 58,189 62,439 64,689 Weighted-average shares outstanding-diluted (FFO norm.) 39,702 39,712 40,964 44,447 45,197 42,861 49,352 54,189 58,189 62,439 64,689 Diluted shares at period end 39,712 39,712 44,447 44,447 45,947 45,947 50,689 54,689 58,689 64,689 64,689 FFO per Share - "NAREIT" (diluted) $1.04 $0.30 $0.30 $0.29 $0.31 $1.19 $1.22 $1.25 $1.32 $1.41 $1.52 FFO per share as adjusted, as reported $1.00 $0.29 $0.29 $0.29 $0.30 $1.16 $1.19 $1.23 $1.31 $1.40 $1.51 Normalized FFO per share $1.08 $0.31 $0.30 $0.31 $0.32 $1.23 $1.24 $1.27 $1.34 $1.43 $1.54 Cash Available for Distribution, as reported $0.89 $0.26 $0.25 $0.25 $0.27 $1.04 $1.09 $1.13 $1.22 $1.32 $1.42 Diluted FAD per share $0.84 $0.24 $0.24 $0.24 $0.26 $0.97 $1.03 $1.08 $1.17 $1.27 $1.38 DIV per Share $0.65 $0.22 $0.23 $0.23 $0.23 $0.91 $0.96 $1.04 $1.12 $1.16 $1.24 Easterly Government Properties, Inc. Page 21 of 38
  • 22. Net Asset Value: We estimate Easterly’s NAV at $16.97 per share based on a nominal cap rate of 6.8%. At the current stock price, DEA is trading at a 6.2% implied cap rate and an 11% premium to NAV, versus a 9% simple average discount for our office coverage universe. We estimate DEA is trading at the highest P/NAV in our 13-company office coverage universe (HIW is next and trades at an 8% premium to NAV). Figure 24: DEA Net Asset Value ($ thousands) Source: Company documents; STRH Easterly Government Properties, Inc SunTrust Robinson Humprey Net Asset Value in $ thousands 2Q16 2Q17E NAV per Share $16.97 $17.64 Forward Twelve-Month NOI $70,571 $84,167 Less: Straight-line rent (6,720) (6,720) Forward Twelve-Month Cash NOI $63,851 $77,447 Nominal Cap Rate 6.75% 6.83% 6.75% Real Estate Value $945,934 $1,147,359 Management & Other Fee Income $410 $424 Cap Rate 10.00% 10.00% Value of Management Income $4,101 $4,244 Cash & Cash Equivalents $83,057 $81,313 Accounts Receivable $10,629 $10,629 Other Tangible Assets $1,469 $979 Accounts Payable and Other Liabilities (9,949) (9,949) Other Assets/Liabilities $85,206 $82,972 Gross Asset Value $1,035,240 $1,263,146 Senior Unsecured Notes $0 $1 Unsecured Term Loans $0 $100,000 Line of Credit $198,167 $205,000 Mortgage Notes Payable $82,289 $82,290 Mark-to-Market Debt Adjustment 363 (809) Perpetual Preferred Stock 0 0 Long Term Debt/Preferred $280,819 $386,483 Net Asset Value $754,421 $876,663 Shares Outstanding 44,447 49,697 Fully Diluted Shares & Units Outstanding 44,447 49,697 Net Asset Value / Share $16.97 $17.64 Current Stock Price $18.84 $18.84 Premium / Discount to NAV 11.0% 6.8% Implied Cap Rate 6.2% 6.4% Applied Value / Sq. Ft. $342 $344 Implied Value / Sq. Ft. $372 $361 Easterly Government Properties, Inc. Page 22 of 38
  • 23. Balance Sheet and Leverage DEA maintains one of the most conservative capital structures in our office REIT coverage universe. Specifically, the company has among the very lowest net debt-to-EBITDA (4.9x at 2Q16), net debt-to- GAV (25%) and net debt-to-total market cap (31%) ratios in the group. Management is targeting 40% D/TEV and 6x D/EBITDA. The company’s capital position provides some runway to execute on its external growth initiatives, though we expect a return to the capital markets in the near-term, assuming investment opportunities continue to emerge. Figure 25: DEA Capital Structure ($ Billions)1 Note 1 : as of 2Q/16; Source: Company documents; SNL Financial; STRH Figure 26: Office comps: Net Debt/EBITDA1 Figure 27: Office comps: Net Debt/GAV1 Note 1: As of 2Q/16 Source: Factset; SNL Financial; STRH Net Debt $0.3Equity Market Cap $0.8 4.5x 4.9x 5.0x 6.0x 6.2x 6.6x 6.9x 7.3x 7.6x 7.7x 8.0x 9.1x 9.4x 0x 1x 2x 3x 4x 5x 6x 7x 8x 9x 10x CUZ DEA HIW BXP PDM WRE BDN FPO OFC CLI SLG VNO NYRT 25% 28% 30% 33% 35% 36% 39% 41% 41% 45% 46% 48% 53% 0% 10% 20% 30% 40% 50% 60% DEA CUZ BXP HIW WRE PDM VNO NYRT SLG OFC BDN CLI FPO Easterly Government Properties, Inc. Page 23 of 38
  • 24. DEA’s debt maturities are well-laddered such that no significant mortgages come due over the next five years, as illustrated in Figure 28. The only significant maturity during that period is the $198 million drawn (as of 2Q16) on the $400 million credit facility, which accounted for 71% of all debt outstanding as of 2Q16 and matures in 2019. Notably, DEA closed a $100 million, seven-year unsecured term loan at L+170 earlier this month (included in our estimates, but not the maturity schedule below) and we are modeling $75 million of new equity in 2017. Figure 28: DEA Debt Maturity Schedule ($ millions)1 Note 1:Of the 2019 debt maturities, $198.2M is in the form of a unsecured revolving credit facility Source: Company documents; STRH $1.4 $3.0 $3.1 $201.4 $3.4 $67.7 $0 $50 $100 $150 $200 $250 2016 2017 2018 2019 2020 Thereafter $M Easterly Government Properties, Inc. Page 24 of 38
  • 25. Figure 29: DEA Balance Sheet ($ thousands) Source: Company documents; SNL Financial; STRH Easterly Government Properties, Inc SunTrust Robinson Humprey 2015 1Q16 2Q16 3Q16E 4Q16E 2016E 2017E 2018E 2019E 2020E 2021E BALANCE SHEET ASSETS Real estate properties 788,597 819,934 835,860 913,092 958,292 958,292 1,078,557 1,227,607 1,405,276 1,522,909 1,641,316 Accumulated depreciation (16,590) (22,054) (27,683) (39,574) (52,160) (52,160) (106,511) (167,664) (237,163) (312,132) (390,766) Construction and redevelopment in progress, including land 0 0 0 0 0 0 0 0 Land held for future development and pre-construction costs 0 0 0 0 0 0 0 0 0 Total properties, net 772,007 797,880 808,177 873,518 906,132 906,132 972,046 1,059,944 1,168,113 1,210,777 1,250,549 Assets held for sale, net 0 0 0 0 0 0 0 0 0 Cash and cash equivalents 8,176 4,380 3,704 11,910 5,967 5,967 4,882 5,728 4,204 28,289 3,962 Restricted cash 1,736 1,521 79,353 79,353 79,353 79,353 79,353 79,353 79,353 79,353 79,353 Rents receivable 6,629 6,920 6,920 6,920 6,920 6,920 6,920 6,920 6,920 6,920 Accounts receivable 2,920 3,832 3,709 3,709 3,709 3,709 3,709 3,709 3,709 3,709 3,709 Deferred financing, net 2,767 2,511 2,296 2,296 2,296 2,296 2,296 2,296 2,296 2,296 2,296 Intangible assets, net 115,198 111,728 111,728 111,728 111,728 111,728 111,728 111,728 111,728 111,728 Prepaid expenses and other assets 1,509 2,723 1,958 1,958 1,958 1,958 1,958 1,958 1,958 1,958 1,958 Total assets 789,115 934,674 1,017,845 1,091,392 1,118,063 1,118,063 1,182,892 1,271,636 1,378,281 1,445,030 1,460,476 Liabilities and equity Revolving credit facility 154,417 184,417 198,167 283,167 205,667 205,667 285,000 300,000 310,000 290,000 295,000 Mortgage notes payable 83,020 82,289 82,290 82,290 82,290 82,290 142,290 202,290 202,290 262,290 Unsecured debt 3 100,002 100,002 100,002 100,002 100,002 100,002 100,002 Accrued expenses 0 0 0 0 0 0 0 0 Rents received in advance and security deposits 0 0 0 0 0 0 0 0 Dividends and distributions payable 0 0 0 0 0 0 0 0 Deferred revenue associated with operating leases 0 0 0 0 0 0 0 0 Intangible liabilities, net 44,605 44,081 42,119 42,119 42,119 42,119 42,119 42,119 42,119 42,119 42,119 Accounts payable and accrued liabilities 9,346 10,211 9,949 9,949 9,949 9,949 9,949 9,949 9,949 9,949 9,949 Total liabilities 208,368 321,729 332,524 417,528 440,027 440,027 519,360 594,360 664,360 644,360 709,360 Commitments and contingencies 0 0 0 0 0 0 0 0 Redeemable noncontrolling interest 0 0 0 0 0 0 0 0 Equity Common stock, par value 241 241 346 Preferred stock 0 0 0 0 0 0 0 0 Additional paid-in capital 391,767 392,180 560,072 Retained (deficit) (1,694) (1,019) (320) Cumlative dividends (13,051) (18,368) (25,857) Total stockholders' equity 377,263 373,034 534,241 522,784 526,956 526,956 512,452 526,196 562,841 649,590 600,036 Non-controlling interests Non-controlling interest in operating partnership 242,631 239,911 151,080 151,080 151,080 151,080 151,080 151,080 151,080 151,080 151,080 Preferred units in LP - 0 0 - - - - - - - - Other consolidated entities 0 0 0 0 0 0 0 0 0 0 0 Noncontrolling interests 242,631 239,911 151,080 151,080 151,080 151,080 151,080 151,080 151,080 151,080 151,080 Total Equity 619,894 612,945 685,321 673,864 678,036 678,036 663,532 677,276 713,921 800,670 751,116 Total liabilities and equity 828,262 934,674 1,017,845 1,091,392 1,118,063 1,118,063 1,182,892 1,271,636 1,378,281 1,445,030 1,460,476 Easterly Government Properties, Inc. Page 25 of 38
  • 26. High Dividend Yield (and Payout Ratio) DEA’s most recent quarterly dividend of $0.23 per share was paid on September 13 to shareholders of record as of August 26. The company has already increased the quarterly dividend to $0.21ps in 3Q15, to $0.22ps in 4Q15 and to the current $0.23ps in 2Q16. The annualized dividend of $0.92 per share implies a current yield of 5.0% and equates to 90% of our 2017 FAD estimate of $1.03 per share. The yield is the highest in our office coverage universe (simple average of 3.8%; range of 2.2% to 5.0%), while the 5-year FFO growth outlook (4.5%) is just above the office comp average (4.3%). Management intends to pay close to all of its cash flow as dividends. Based on our earnings estimates and assuming a FAD payout ratio in the mid-90% range, we project 6.4% annual dividend growth from 2016-2021. The current yield ranks first out of the 13 companies in our office coverage universe, while the 2016 FAD coverage is 9th and the 2017 FAD coverage is 11th. Figure 30: DEA Dividend per Share and Normalized Dividend Growth Source: FactSet; Company documents; STRH Figure 31: Office REIT Dividend Yields Source: FactSet; Company documents; STRH 0% 2% 4% 6% 8% 10% $0.00 $0.05 $0.10 $0.15 $0.20 $0.25 $0.30 $0.35 2Q15 4Q15 2Q16 4Q16E 2Q17E 4Q17E 2Q18E 4Q18E 2Q19E 4Q19E 2Q20E 4Q20E 2Q21E 4Q21E Dividends per Share (LHS) Dividend Growth (YoY % chg, RHS) 0% 1% 2% 3% 4% 5% 6% BXP CLI VNO SLG WRE CUZ OFC PDM BDN FPO HIW NYRT DEA Easterly Government Properties, Inc. Page 26 of 38
  • 27. Management Team Much of DEA’s competitive advantage is derived from its relationships and track record serving GSA properties. The company has deep knowledge/understanding of the GSA procurement process, protocols and culture. It also has a staff of personnel who can collaborate with the U.S. government and are qualified to service these GSA properties. We view this as an advantage over many other developers/landlords, effectively limiting the pool of competitors. DEA should continue to strengthen its position as a go-to GSA landlord, as it continues to acquire/develop properties within this niche. DEA has adopted what we consider shareholder-friendly corporate governance. The company is internally managed, has no poison pill or staggered Board, has opted out of the Maryland Unsolicited Takeover Act (which permits Boards to stagger its members without shareholder approval) and has a majority of independent directors. There is no stockholder rights plan, and there are fully independent audit/compensation and corporate governance committees. William C. Trimble, III – Chief Executive Officer, President and Director Mr. Trimble, is the company’s Chief Executive Officer, President and a member of the board of directors. He co-founded Easterly Partners, LLC in 2011 and was the CEO and managing partner until DEA’s IPO in February 2015. Previously, from April 2009 to August 2011, Mr. Trimble was the COO of PRP LLC, an investment firm that managed funds that invested in properties leased to the GSA. Mr. Trimble also worked for 10 years at Red Comb LLC as the head of client relations and five years as the head of marketing at Winston Capital Management. Mr. Trimble earned his MBA and BA from Duke University. Darrell W. Crate – Chairman of the Board of Directors Mr. Crate was co-founder and Managing Partner of Easterly Capital in September 2009. From 1998 to 2011, he served as the CFO of Affiliated Managers Group, Inc (NYSE: AMG), a publicly-traded asset management company. Prior to that, he was the Managing Director of the Financial Institution Group of the Chase Manhattan Corporation. Mr. Crate also serves as a member of the executive committee of the Board of Trustees of Bates College, and as the Vice Chairman of the Aircraft Owners and Pilots Association. He serves on the advisory board of the Robert F. Kennedy Children’s Action Corps. Mr. Crate earned his BA from Bates College and his MBA from Columbia Business School. Michael Ibe – Vice-Chairman of the Board of Directors / EVP– Development and Acquisitions Mr. Ibe is the Executive Vice-President of Development and Acquisitions and also serves as Vice Chairman on the Board of Directors. In 1987, he co-founded Western Devcon, and served as the President. Prior to that, he was the Vice President of Construction at Ibe Investments from 1980 to 1987. From 1970 to 1980, he worked at Lampco Industries as a vice president and general manager. Mr. Ibe attended Mesa College and San Diego State University. Meghan Baivier – EVP – Chief Financial Officer and Chief Operating Officer Ms. Baivier currently serves as EVP, CFO (since May 2016) and COO (since May 2015). Previously, she served as a VP for Citigroup’s Real Estate and Lodging investment banking group from August 2010 to April 2015. Prior to that, Ms. Baivier was an Equity Research Associate with Chilton Investment Co. from March 2005 to June 2007. Ms. Baivier began her career with Fidelity Management and Research as a High Yield Research Associate. She received her MBA from Columbia Business School and her BA from Wellesley College. Easterly Government Properties, Inc. Page 27 of 38
  • 28. Alison Bernard– EVP – Chief Accounting Officer Ms. Bernard was the company’s Chief Financial Officer from 2012 (Easterly Partners) through the February 2015 IPO, before being named Chief Accounting Officer in March 2016. In 2011, Ms. Bernard was employed at Summit Partners in the General Partner Services Group and from 2008 to 2011, she was employed at PricewaterhouseCoopers. Ms. Bernard earned her MS in accounting from Boston College and BA from the College of the Holy Cross. She is also a licensed CPA. Ronald Kendall– EVP – Government Relations Mr. Kendall currently serves as EVP – Government Relations. He joined the company’s predecessor in 2014 and was previously the president of Ron Kendall & Associates, a company that provides strategic and tactical consulting to organizations pursuing or renewing federal real estate contracts. From 2010 to 2011, he served as a staff director at the US House of Representatives in the Transportation and Infrastructure Committee, Subcommittee on Economic Development, Public Buildings, and Emergency Management. Prior to that, Mr. Kendall directed the long-range facilities planning activities of the federal Judiciary at the Administrative Office of the U.S. Courts from 2005-2010. Mr. Kendall earned his MPA from American University and his BA from the University of Rochester. Figure 32: Easterly’s Board of Directors Source: Company documents; SNL Financial; STRH Management Compensation DEA has a compensation committee, which consists of the four independent directors, chaired by Mr. Binnie. The primary functions of the committee include: 1) Reviewing and approving annual corporate goals and objectives relevant to the CEO’s performance and determining/approving remuneration based on those objectives; 2) Reviewing and approving compensation for other executives and senior officers; 3) Implementing and administering incentive compensation and equity-based remuneration plans; 4) Reviewing, evaluating and recommending change to director compensation plans. Figure 33: Easterly’s 2015 Executive Compensation Note 1 : Includes matching 401K plans from February 11, 2015 through December 31, 2015 Source: Company documents, STRH, SNL Financial, as of 2015 Proxy Name Position Age Independent William C. Trimble III Chief Executive Officer, President and Director 54 - Darrell W. Crate Chairman of the Board of Directors 49 - Michael P. Ibe Vice Chairman of the Board of Directors & EVP - Development & Acquisitions 69 - William H. Binnie Director 58 Yes Cynthia A. Fisher Director 55 Yes Emil W. Henry, Jr. Director 55 Yes James E. Mead Director 56 Yes Average Age 57 Name Base Salary Bonus Other Annual Comp. Stock Granted1 Total Darrell W. Crate $111,538 $125,000 $0 $1,950,750 $2,187,288 Michael P. Ibe $111,538 $125,000 $6,764 $1,950,750 $2,194,052 William C. Trimble III $223,077 $250,000 $2,427 $2,921,790 $3,397,294 Easterly Government Properties, Inc. Page 28 of 38
  • 29. The company has a long-term incentive plan (LTIP) that pays out based on DEA’s annualized shareholder return from IPO through 2017 (no payout up to 8% and full payout at or above 16%), as well as performance relative to the NAREIT US Equity REIT index (no payout up to 95% and full payment at or above 125%). The payout will range from 0% to 5% of the company at IPO. We are modeling the midpoint by assuming 1 million shares are issued at the end of 2017. Insider Ownership Vice Chairman Darrell Crate is the largest direct inside owner with 91,453 shares (nearly 0.3% of the outstanding shares), worth ~$1.8 million. CEO William Trimble and Director Cynthia Fisher each have ownership stakes valued at about ~$1.5 million. Figure 34: Easterly Direct Insider Ownership Source: Company data, STRH, Bloomberg, Market value and share positions as of 10/17/2016 Name Position Market Value ($) Shares Out (%) Crate Darrell W 91,453 $1,734,854 0.26% Trimble III William C. 81,713 $1,550,087 0.23% Fisher Cynthia A. 80,247 $1,522,278 0.23% Mead James E. 32,699 $620,297 0.09% Binnie William H 10,699 $202,959 0.03% Henry Emil W 10,699 $202,959 0.03% Ibe Michael P. 10,000 $189,699 0.03% Bernard Alison M. 510 $9,675 0.00% Easterly Government Properties, Inc. Page 29 of 38
  • 30. Valuation DEA trades at 15.3x 2016 normalized FFO, a 1% premium to our office coverage universe simple average (15.2x), and 18.2x 2016 FAD, a 30% discount (24.4x). We think relative multiples can improve a bit, due to the company’s competitive earnings growth, low financial leverage and low-volatility earnings. Increasing the size of the company should also help reduce volatility/risk. The stock currently trades at 111% of our $16.97 NAV estimate, versus 91% on average for our office coverage universe (notably, DEA’s own transactions are heavily considered in triangulating our 6.8% assumed cap rate). Our 12- month price target of $21 (methodology below) implies 16.9x 2017 FFO and 20.4x 2017 FAD. Figure 35: Historical P/FFO Multiples Figure 36: Historical P/NAV Source: Factset; SNL Financial; STRH Figure 37: Price/2016E Norm. FFO Comparison Figure 38: Price/2016E FAD Comparison Source: Factset; SNL Financial; STRH 10 12 14 16 18 1Q15 2Q15 3Q15 4Q15 1Q16 2Q16 3Q16 Current DEA P/FFO Peer Average P/FFO -25% -20% -15% -10% -5% 0% 5% 10% 15% Mar-15 Jun-15 Sep-15 Dec-15 Mar-16 Jun-16 Sep-16 DEA Peer Average 8.6 10.1 11.9 12.3 12.9 13.7 15.1 15.3 15.6 17.1 19.7 21.1 23.5 0 5 10 15 20 25 FPO CUZ BDN CLI PDM OFC SLG DEA HIW WRE VNO BXP NYRT 10.8 15.9 16.8 16.9 18.2 19.6 20.4 23.1 30.5 31.6 32.2 37.8 43.3 0 5 10 15 20 25 30 35 40 45 50 FPO PDM BDN OFC DEA SLG WRE HIW CLI NYRT BXP CUZ VNO Easterly Government Properties, Inc. Page 30 of 38
  • 31. Figure 39: NAV Premium/(Discount) Comparison1 Figure 40: Applied Cap Rate Comparison Note 1: NAV as of 2Q/16; CUZ cap rate reflects 2Q/17E Source: Factset; SNL Financial; STRH We expect DEA’s 2016-2021 annual FFOps growth to rank fifth out of the 13 office REITs we cover, while its P/2016E FFO multiple is the eighth-lowest, resulting in the third-most attractive PEG ratio. DEA has the sixth-highest FAD growth and fifth-lowest multiple for a PEG ratio that ranks fourth-most attractive. We consider the stock’s growth undervalued, particularly considering its below-average financial leverage (second-lowest net D/EBITDA; as of 2Q16). Figure 41: P/2016 FFO vs ’16-’21 FFO Growth Figure 42: P/2016 FAD vs ’16-’21 FAD Growth Source: Factset; SNL Financial; STRH -26% -25% -19% -15% -10% -10% -8% -8% -7% -6% -3% 8% 11% -30% -25% -20% -15% -10% -5% 0% 5% 10% 15% FPO SLG VNO NYRT BXP CLI OFC PDM BDN WRE CUZ HIW DEA 7.4% 7.0% 7.0% 6.8% 6.8% 6.4% 6.3% 6.1% 6.0% 4.8% 4.6% 4.5% 4.4% 0% 1% 2% 3% 4% 5% 6% 7% 8% CLI FPO OFC DEA BDN CUZ HIW WRE PDM BXP VNO NYRT SLG Average 6.0% 0x 5x 10x 15x 20x 25x 0% 1% 2% 3% 4% 5% 6% 7% Price/2016Norm.FFO Annual Normalized FFO Growth '16-'21 BXPNYRT VNO SLG WRE CUZ HIW OFC BDN PDM FPO CLI DEA 0x 5x 10x 15x 20x 25x 30x 35x 40x 45x 50x 0% 5% 10% 15% 20% 25% Price/2016FAD Annual FAD Growth '16-'21 BXP NYRT VNO SLG WRE CUZ HIW OFC BDNPDM FPO CLI DEA Easterly Government Properties, Inc. Page 31 of 38
  • 32. Figure 43: Office Comp Sheet1 Note 1 : CUZ NAV and cap rates are as of 2Q17, reflects Houston spin-off; GOV FFO/FAD estimates are consensus Source: SNL Financial; Factset; STRH Strong Risk-Adjusted Return Since IPO Since DEA’s IPO in February 2015, the stock is up 30.3% versus 4.5% for the MSCI US REIT Index (RMS). Over that time, the stock has also outperformed the more government-focused office REITs, GOV and OFC, by 23.3pps and 31.0pps, respectively. However, while topping the RMZ year-to-date (9.7% versus 4.1%), it has lagged GOV (31.8%) and OFC (26.8%). Figure 44: Easterly Total Return vs. SNL US REIT Equity and SNL US REIT Office Source: SNL Financial; STRH U.S. REITs Comp Sheet SunTrust Robinson Humphrey Equity Prem./ Applied Implied Net debt Stock Target Market NAV Disc. Cap Cap Div. + Pref / Ticker Rating Price Price Cap 2016E 2017E 2016E 2017E 2016E NAV Rate Rate Yield EBITDA ($ Bn) (x) (x) (x) (x) ($) (%) (%) (%) (%) (x) BDN Buy $15.35 $18.00 $2.7 11.9x 10.7x 16.8x 15.7x $16.50 (7.0%) 6.75% 7.07% 4.2% 6.9x BXP Hold $126.51 $137.00 $19.4 21.1x 19.9x 32.2x 27.8x $141.19 (10.4%) 4.80% 5.21% 2.1% 6.0x CLI Hold $26.26 $28.00 $2.6 12.3x 12.3x 30.5x 29.9x $29.21 (10.1%) 7.35% 7.84% 2.3% 7.7x CUZ Buy $7.91 $9.00 $1.7 10.1x 12.5x 37.8x 20.4x $12.34 (35.9%) 6.25% 6.44% 4.0% 4.5x DEA Buy $18.84 $21.00 $0.8 15.3x 15.2x 19.4x 18.3x $16.97 11.0% 6.75% 6.26% 4.9% 4.9x FPO Buy $8.89 $11.00 $0.5 8.6x 10.2x 10.8x 14.5x $12.05 (26.2%) 7.00% 8.06% 4.5% 7.3x GOV NR $20.92 NR $1.5 9.0x 9.4x 12.7x 13.2x $20.04 4.4% 7.73% NR 8.2% 7.1x HIW Hold $50.58 $53.00 $5.1 15.6x 15.0x 23.1x 21.1x $46.88 7.9% 6.30% 5.95% 3.4% 5.0x NYRT Hold $10.54 $10.00 $1.8 26.5x 24.6x 31.6x 33.3x $10.99 (4.1%) 4.50% 4.62% 4.4% 9.4x OFC Buy $27.68 $31.00 $2.7 13.7x 13.3x 16.9x 15.9x $30.23 (8.4%) 7.00% 7.37% 4.0% 7.6x PDM Hold $21.00 $22.00 $3.0 12.9x 12.4x 15.9x 14.5x $22.80 (7.9%) 6.00% 6.32% 4.0% 6.2x SLG Buy $105.17 $129.00 $11.0 15.1x 15.0x 19.6x 22.0x $140.61 (25.2%) 4.40% 5.31% 2.7% 8.0x VNO Hold $95.37 $107.00 $19.2 19.7x 18.0x 43.3x 29.6x $118.39 (19.4%) 4.55% 5.32% 2.6% 9.1x WRE Hold $30.25 $32.00 $2.2 17.1x 17.0x 20.4x 20.3x $32.34 (6.5%) 6.05% 6.33% 4.0% 6.6x P/FFO Multiple P/FAD Multiple -20 -10 0 10 20 30 40 50 Feb-15 May-15 Aug-15 Nov-15 Feb-16 May-16 Aug-16 DEA SNL U.S. REIT Equity MSCI US REIT (RMS) Easterly Government Properties, Inc. Page 32 of 38
  • 33. Figure 45: Easterly Total Return vs. GOV and OFC Source: SNL Financial; STRH Since its February 2015 IPO, the stock has outperformed the average return for our office coverage universe by ~27pps. Perhaps more notable, as illustrated in Figure 46, DEA had the second-highest ratio of total return over daily standard deviation of the 13 office stocks we cover (only PDM was better). The daily standard deviation of returns was a bit higher than we expected, though it was rewarded with excess return and the monthly standard deviation was the lowest in the group. Figure 46: Easterly Return vs. Risk Source: SNL Financial, Factset; STRH -50 -40 -30 -20 -10 0 10 20 30 40 50 Feb-15 May-15 Aug-15 Nov-15 Feb-16 May-16 Aug-16 DEA GOV OFC -30% -20% -10% 0% 10% 20% 30% 40% 1.0% 1.2% 1.4% 1.6% 1.8% 2.0% TotalReturnSinceIPO Daily % change (standard deviation) DEA Easterly Government Properties, Inc. Page 33 of 38
  • 34. Notably, DEA has also had a very high correlation to the U.S. 10-year Treasury yield. As illustrated in Figure 48 and Figure 47 below, Easterly’s correlation to the 10 year yield is -0.80, which is much stronger than the -0.30 simple average for our office coverage universe. If this relationship continues to hold, it would be concerning in a rising rate environment. Meanwhile, DEA’s stock market beta is very low (0.48) relative to the rest of the group (0.86), suggesting greater diversification benefits in a broader portfolio. Figure 47: Easterly Correlation versus U.S. 10-Year Yield (inverted) Source: Factset; SNL Financial, STRH Figure 48: Easterly Correlation and Beta Metrics Source: Factset; STRH 1.00% 1.20% 1.40% 1.60% 1.80% 2.00% 2.20% 2.40% 2.60%$14.00 $15.00 $16.00 $17.00 $18.00 $19.00 $20.00 $21.00 Feb-15 May-15 Aug-15 Nov-15 Feb-16 May-16 Aug-16 DEA (LHS) US 10-year yield (inverted; RHS) Correlation Beta to to US 10 yr S&P 500 DEA -0.81 0.48 BDN -0.58 0.93 BXP -0.37 0.92 CUZ -0.26 1.04 CLI -0.71 0.92 FPO 0.57 0.86 HIW -0.84 0.86 NYRT 0.46 0.69 OFC -0.57 0.72 PDM -0.76 0.68 SLG 0.31 1.05 WRE -0.76 0.74 VNO -0.07 0.94 U.S. Office Average -0.30 0.86 Easterly Government Properties, Inc. Page 34 of 38
  • 35. Investment Recommendation and Price Target We are initiating coverage of Easterly with a Buy rating and a $21 price target, which implies a 16.5% potential total return including a 5.0% forward dividend yield (versus a 3.0% simple average total return for our office coverage universe). Our target is based on a $23.59 discounted cash flow value (50% weighting) and 0% discount to our projected NAV a year from now (50%). Our target also implies 16.9x 2017E FFO and 20.4x 2017E FAD; the stock currently trades at 15.3x 2016E FFO and 19.4x 2016E FAD. Figure 49: Price Target Calculation Source: SNL Financial, Factset; STRH Figure 50: Office Comp Sheet Note 1 : CUZ NAV and cap rates are as of 2Q17, reflects Houston spin-off Source: SNL Financial; STRH Yr 1 Yr 2 Yr 3 Yr 4 Yr 5 FAD $1.01 $1.06 $1.12 $1.23 $1.34 Term Value (FAD) $23.84 Sub-total $1.01 $1.06 $1.12 $1.23 $25.18 NPV $21.93 Forward Equity Price $23.59 DCF Assumptions Cost of Equity 7.6% Net Asset Value $16.97 Year 5 Growth 4.3% 2Q17E Net Asset Value $17.64 Term. Growth Rate 1.7% 0% Premium to 2Q17E NAV $17.64 Forward Div. Yield 5.0% Target Price $21.00 Implied Total Return 16.5% Price Prem/Disc 5-Yr. Avg. 2Q17E Prem/Disc Adj. Fwd. Price Implied Dividend Implied Ticker Rating 10/17/2016 NAV to NAV Prem/Disc NAV Applied NAV DCF Target Appreciation Yield Tot. Return FPO Buy $8.89 $12.05 -26% -19% 12.49 -18% $10.30 $10.87 $11 23.7% 4.6% 28.3% SLG Buy $105.17 $140.61 -25% -5% 146.11 -10% $131.50 $127.36 $129 22.7% 2.9% 25.6% BDN Buy $15.35 $16.50 -7% -8% 16.84 0% $16.84 $18.39 $18 17.3% 4.2% 21.4% CUZ Buy $7.91 $8.19 -3% -7% 8.19 0% $8.19 $9.14 $9 13.8% 4.0% 17.8% DEA Buy $18.84 $16.97 11% -1% 17.64 0% $17.64 $23.59 $21 11.5% 5.0% 16.5% OFC Buy $27.68 $30.23 -8% -13% 31.25 -5% $29.69 $31.34 $31 12.0% 4.1% 16.1% VNO Hold $95.37 $118.39 -19% -3% 122.07 -8% $112.92 $100.84 $107 12.2% 2.6% 14.8% NYRT Hold $9.35 $10.99 -15% -8% 11.18 -10% $10.06 $7.66 $10 7.0% 4.9% 11.9% BXP Hold $126.51 $141.19 -10% -2% 143.43 0% $143.43 $129.61 $137 8.3% 2.2% 10.5% WRE Hold $30.25 $32.34 -6% -12% 32.65 0% $32.65 $30.38 $32 5.8% 4.0% 9.8% HIW Hold $50.58 $46.88 8% -2% 47.28 7% $50.82 $54.32 $53 4.8% 4.9% 9.6% CLI Hold $26.26 $29.21 -10% -13% 29.54 -5% $28.06 $27.07 $28 6.6% 2.3% 8.9% PDM Hold $21.00 $22.80 -8% -5% 22.67 -5% $21.53 $22.73 $22 4.8% 4.1% 8.9% Simple Average -9% -8% -4% 11.6% 3.8% 15.4% Easterly Government Properties, Inc. Page 35 of 38
  • 36. Company Description Easterly Government Properties is a publicly-traded (NYSE: DEA), self-managed, fully-integrated office REIT headquartered in Washington D.C. DEA is focused on the acquisition, development and management of Class A commercial properties that are primarily leased to mission-critical U.S. Government agencies, including but not limited to the DEA, FBI, ICE and IRS. Investment Thesis DEA should be a steady growing income vehicle. Long leases (with expense increase reimbursements) to government tenants at very select locations should underpin predictable, low-volatility earnings. Meanwhile, management will continue to leverage its relationships and knowledge of GSA real estate requirements to source acquisitions and build-to-suit development opportunities. DEA is one of the lowest-levered office REITs in our coverage universe and offers the highest dividend yield (albeit at a high payout ratio), supported by predictable cash flows. Valuation and Risks DEA trades at a 1% premium to our office coverage universe on P/2016E FFO and a 30% discount on P/FAD. It trades at a 11% premium to our $16.97 NAV estimate (6.2% implied cap rate) versus an 9% average discount for the group. Our $21 price target is based on a $23.59 discounted cash flow (50% weighting) and our projected NAV a year from now (50%). It implies a 16.5% total return, including the 5.0% projected dividend yield. First, GSA tenants offer strong credit and high renewal rates, but DEA has high property and tenant concentration risk that is tied to government decisions. Re-leasing assets could prove difficult/costly should a large tenant vacate an entire building. Second, the company’s small size is evident in its high G&A expense relative to revenue. DEA needs to continue to grow, which means continuing to execute acquisitions, while relying on accessible and cost-effective capital to maintain the balance sheet. Finally, DEA has exhibited a high correlation with the 10-year Treasury yield in its relatively short time as a public company. It may be viewed as more bond-like, even compared with other REITs, and the stock could be susceptible to underperformance in a rising interest rate environment. Companies Mentioned in This Note Easterly Government Properties, Inc. (DEA, $18.84, Buy, Michael Lewis) Highwoods Properties, Inc. (HIW, $50.73, Hold, Michael Lewis) Corporate Office Properties Trust (OFC, $27.72, Buy, Michael Lewis) Piedmont Office Realty Trust, Inc. (PDM, $21.09, Hold, Michael Lewis) Government Properties Income Trust (GOV, $20.69, NR) Analyst Certification I, Michael Lewis , hereby certify that the views expressed in this research report accurately reflect my personal views about the subject company(ies) and its (their) securities. I also certify that I have not been, am not, and will not be receiving direct or indirect compensation in exchange for expressing the specific recommendation(s) in this report. Required Disclosures Analyst compensation is based upon stock price performance, quality of analysis, communication skills, and the overall revenue and profitability of the firm, including investment banking revenue. As a matter of policy and practice, the firm prohibits the offering of favorable research, a specific research rating or a specific target price as consideration or inducement for the receipt of business or compensation. In addition, associated persons preparing research reports are prohibited from owning securities in the subject companies. Charts indicating changes in ratings can be found in recent notes and/or reports at our website or by contacting SunTrust Robinson Humphrey. Please see our disclosures page for more complete information at https://suntrust.bluematrix.com/sellside/Disclosures.action. STRH Ratings System for Equity Securities Dissemination of Research Easterly Government Properties, Inc. Page 36 of 38
  • 37. SunTrust Robinson Humphrey (STRH) seeks to make all reasonable efforts to provide research reports simultaneously to all eligible clients. Reports are available as published in the restricted access area of our website to all eligible clients who have requested a password. Institutional investors, corporates, and members of the Press may also receive our research via third party vendors including: Thomson Reuters, Bloomberg, FactSet, and S&P Capital IQ. Additional distribution may be done by sales personnel via email, fax, or other electronic means, or regular mail. For access to third party vendors or our Research website: https://suntrustlibrary.bluematrix.com/client/library.jsp please email the Research Department at STRHEquityResearchDepartment@SunTrust.com or contact your STRH sales representative. The rating system effective as of Oct. 7, 2016: STRH Rating System for Equity Securities SunTrust Robinson Humphrey (STRH) rates individual equities using a three-tiered system. Each stock is rated relative to the broader market (generally the S&P 500) over the next 12-18 months (unless otherwise indicated). Buy (B) – the stock’s total return is expected to outperform the S&P 500 or relevant benchmark over the next 12-18 months (unless otherwise indicated) Hold (H) – the stock’s total return is expected to perform in line with the S&P 500 or relevant benchmark over the next 12-18 months (unless otherwise indicated) Sell (S) – the stock’s total return is expected to underperform the S&P 500 or relevant benchmark over the next 12-18 months (unless otherwise indicated) Not Rated (NR) – STRH does not have an investment rating or opinion on the stock Coverage Suspended (CS) – indicates that STRH’s rating and/or target price have been temporarily suspended due to applicable regulations and/or STRH Management discretion. The previously published rating and target price should not be relied upon STRH analysts have a price target on the stocks that they cover, unless otherwise indicated. The price target represents that analyst's expectation of where the stock will trade in the next 12-18 months (unless otherwise indicated). If an analyst believes that there are insufficient valuation drivers and/or investment catalysts to derive a positive or negative investment view, they may elect with the approval of STRH Research Management not to assign a target price; likewise certain stocks that trade under $5 may exhibit volatility whereby assigning a price target would be unhelpful to making an investment decision. As such, with Research Management‘s approval, an analyst may refrain from assigning a target to a sub- $5 stock. Legend for Rating and Price Target History Charts: B = Buy H = Hold S = Sell D = drop coverage CS = Coverage Suspended I = initiate coverage T = transfer coverage The prior rating system until Oct. 7, 2016: 3 designations based on total returns* within a 12-month period** ∙ Buy – total return ≥ 15% (10% for low-Beta securities)*** ∙ Reduce – total return ≤ negative 10% (5% for low Beta securities) ∙ Neutral – total return is within the bounds above ∙ NR – NOT RATED, STRH does not provide equity research coverage ∙ CS – Coverage Suspended *Total return (price appreciation + dividends); **Price targets are within a 12-month period, unless otherwise noted; ***Low Beta defined as securities with an average Beta of 0.8 or less, using Bloomberg’s 5-year average Easterly Government Properties, Inc. Page 37 of 38
  • 38. SunTrust Robinson Humphrey ratings distribution (as of 10/18/2016): Coverage Universe Investment Banking Clients Past 12 Months Rating Count Percent Rating Count Percent Buy 381 59.44% Buy 82 21.52% Hold/Neutral 258 40.25% Hold/Neutral 39 15.12% Sell/Reduce 2 0.31% Sell/Reduce 0 0.00% Other Disclosures Information contained herein has been derived from sources believed to be reliable but is not guaranteed as to accuracy and does not purport to be a complete analysis of the security, company or industry involved. This report is not to be construed as an offer to sell or a solicitation of an offer to buy any security. SunTrust Robinson Humphrey, Inc. and/or its officers or employees may have positions in any securities, options, rights or warrants. The firm and/or associated persons may sell to or buy from customers on a principal basis. Investors may be prohibited in certain states from purchasing some over- the-counter securities mentioned herein. Opinions expressed are subject to change without notice. The information herein is for persons residing in the United States only and is not intended for any person in any other jurisdiction. SunTrust Robinson Humphrey, Inc.’s research is provided to and intended for use by Institutional Accounts as defined in FINRA Rule 4512(c). The term “Institutional Account" shall mean the account of: (1) a bank, savings and loan association, insurance company or registered investment company; (2) an investment adviser registered either with the SEC under Section 203 of the Investment Advisers Act or with a state securities commission (or any agency or office performing like functions); or (3) any other person (whether a natural person, corporation, partnership, trust or otherwise) with total assets of at least $50 million. SunTrust Robinson Humphrey, Inc. is a registered broker-dealer and a member of FINRA and SIPC. It is a service mark of SunTrust Banks, Inc. SunTrust Robinson Humphrey, Inc. is owned by SunTrust Banks, Inc. ("SunTrust") and affiliated with SunTrust Investment Services, Inc. Despite this affiliation, securities recommended, offered, sold by, or held at SunTrust Robinson Humphrey, Inc. and at SunTrust Investment Services, Inc. (i) are not insured by the Federal Deposit Insurance Corporation; (ii) are not deposits or other obligations of any insured depository institution (including SunTrust Bank); and (iii) are subject to investment risks, including the possible loss of the principal amount invested. SunTrust Bank may have a lending relationship with companies mentioned herein. Please see our Disclosure Database to search by ticker or company name for the current required disclosures, including risks to the price targets, Link: https://suntrust.bluematrix.com/sellside/ Disclosures.action Please visit the STRH equity research library for current reports and the analyst roster with contact information, Link (password protected): STRH RESEARCH LIBRARY SunTrust Robinson Humphrey, Inc., member FINRA and SIPC. SunTrust and SunTrust Robinson Humphrey are service marks of SunTrust Banks, Inc. If you no longer wish to receive this type of communication, please request removal by sending an email to STRHEquityResearchDepartment@SunTrust.com © SunTrust Robinson Humphrey, Inc. 2016 . All rights reserved. Reproduction or quotation in whole or part without permission is forbidden. ADDITIONAL INFORMATION IS AVAILABLE at our website, www.suntrustrh.com, or by writing to: SunTrust Robinson Humphrey, Research Department, 3333 Peachtree Road N.E., Atlanta, GA 30326-1070 Easterly Government Properties, Inc. Page 38 of 38