SlideShare a Scribd company logo
1 of 8
Download to read offline
MarketView Analyst Report
3rd Quarter 2012 July 19, 2012 Frank P. Corbett, Senior Analyst
1720 Washington Road, P.O. Box 1260 Washington, PA 15301 (724) 745-2300 Phone (724) 745-0900 Fax www.itsconnect.com
ITS-BDR-3-134-20120719For Professional Use Only — Not For UseWith the General Public
Technical
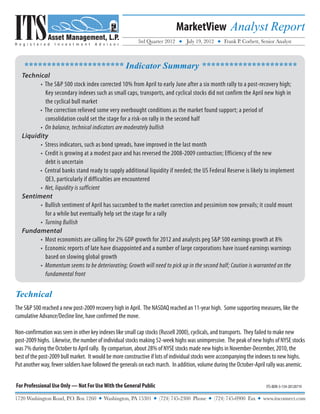
	 •  The S&P 500 stock index corrected 10% from April to early June after a six month rally to a post-recovery high;
                   Key secondary indexes such as small caps, transports, and cyclical stocks did not confirm the April new high in
                   the cyclical bull market
               •  The correction relieved some very overbought conditions as the market found support; a period of
                   consolidation could set the stage for a risk-on rally in the second half
	 •  On balance, technical indicators are moderately bullish
Liquidity
	 •  Stress indicators, such as bond spreads, have improved in the last month
	 •  Credit is growing at a modest pace and has reversed the 2008-2009 contraction; Efficiency of the new
                   debt is uncertain
               •  Central banks stand ready to supply additional liquidity if needed; the US Federal Reserve is likely to implement
                   QE3, particularly if difficulties are encountered
	 •  Net, liquidity is sufficient
Sentiment
	 •  Bullish sentiment of April has succumbed to the market correction and pessimism now prevails; it could mount
                   for a while but eventually help set the stage for a rally
               	•  Turning Bullish
Fundamental
	 •  Most economists are calling for 2% GDP growth for 2012 and analysts peg S&P 500 earnings growth at 8%
	 •  Economic reports of late have disappointed and a number of large corporations have issued earnings warnings
                   based on slowing global growth
	 • Momentum seems to be deteriorating; Growth will need to pick up in the second half; Caution is warranted on the
fundamental front
********************** Indicator Summary *********************
The S&P 500 reached a new post-2009 recovery high in April.  The NASDAQ reached an 11-year high.  Some supporting measures, like the
cumulative Advance/Decline line, have confirmed the move.
Non-confirmation was seen in other key indexes like small cap stocks (Russell 2000), cyclicals, and transports.  They failed to make new
post-2009 highs.  Likewise, the number of individual stocks making 52-week highs was unimpressive.  The peak of new highs of NYSE stocks
was 7% during the October to April rally.  By comparison, about 28% of NYSE stocks made new highs in November-December, 2010, the
best of the post-2009 bull market.  It would be more constructive if lots of individual stocks were accompanying the indexes to new highs.  
Put another way, fewer soldiers have followed the generals on each march.  In addition, volume during the October-April rally was anemic.
Technical
ITS MarketView Analyst Report Page 2
ITS MarketView Analyst Report, July 19, 2012
Of particular interest in the chart is the RSI (Relative
Strength Index) displayed on top of the S&P 500 stock
index.  It broke above 70 in the first two rallies of this
cyclical bull market.  It topped out near 68 on the rally
ending this past April and promptly rolled over.  That’s a tip-
off the rally lacked the“power”of the prior two.
We noted last quarter:“On at least a temporary basis, the
market is overbought and due for a pause or correction.”  
The market has pulled back and some of the overbought
conditions have ameliorated.  The S&P 500 is attempting to
stabilize around 1300, which is fairly decent support.
Having noted some negative technical aspects, the April
to early June price action of the general market looks like
a normal correction within an aging cyclical bull market.  
(The rally since March, 2009 has run 44 months compared
to the average 19 months for cyclical bull markets within
secular bears.  It’s the second longest such rally since 1900).
Some indicators on weekly charts such as BollingerBands
and MACD give clues the market may rally or at least
stabilize.  For now, the bull should be given the benefit
of the doubt.  As time goes on, more technical“negative
divergences”would be a potential reason to become more
bearish.  For now, holding or adding modestly to areas of
opportunity is reasonable.
Stock market tops are usually marked by declining liquidity.  Indicators of declining liquidity include Fed tightening, low credit creation,
declines in the money supply, an inverted yield curve, rising spreads on risky bonds, and falling commodity prices.  Historically, not every
one of these conditions needs to occur, but several generally have transpired as markets encounter difficulty.
A conspicuous concern is the spreads and CDS on peripheral European sovereign debt such as Italy and Spain.  They remain at elevated levels
and should be observed closely.  Europe is conceivably the one event that could cause rapid market deterioration.
Governments and central banks are of course monitoring circumstances and have repetitively intervened with QE, bailouts, LTRO, etc. to
re-liquefy the system.  Don’t expect to see a systemic event or recession without governments throwing everything they have at it.  
What about the Fed?  A new round of Quantitative Easing (QE) seems to be the option most likely to drive markets.  Under QE, the Fed buys
bonds and pays for them with newly created cash, injecting it directly into the system.  QE3 has a number of potential triggers.  First, GDP
growth could slip to the negative side.  Or inflation prints a low or negative number.  A marked rise in unemployement would be of
Liquidity
ITS MarketView Analyst Report Page 3
ITS MarketView Analyst Report, July 19, 2012
concern, given the dual mandate.  A shock, possibly from Europe, could set more QE in motion.  Some cynics claim a 15 to 20% decline in
stocks would by itself bring the Fed in.
Is QE a cure-all?  Several legitimate issues need to be raised.  One, the lag before action is taken and the effects pass to the economy
or markets may be such that damage may have already occurred.  Second, the benefits of QE to the real economy may be minimal and
diminishing.  Third, the effective staying power of these measures seems to ebbing but the effects (on stocks and commodities) can be
powerful for a time.
Credit creation is playing a role in maintaining liquidity.  Commercial loans and leases, Federal government debt, and student loans are
growing.  Unfortunately, the latter two sources of credit growth are not efficient in terms of additional GDP per dollar of debt.  Total credit
market debt outstanding, while now above 2007 levels, is growing at a modest annual rate of 2.5%.  By comparison, credit grew about 10%
yearly from 2000 to 2008.  Some observers, such as economist Richard Duncan, feel credit growth of 2% or less is insufficient to keep the
economy above water.  In summary, credit is growing but not productively and barely sufficiently.
Liquidity gauges in general for now demonstrate
sufficiently accommodative financial conditions.  
For example, high yield bond spreads have been
well behaved after last summer’s upsurge.  Lower
quality issues often react first in advance of a
withering economy so the spreads on high yield
bonds overTreasuries are always of interest.
On the whole, liquidity overall has slightly
improved from last quarter, citing the Bloomberg
Financial Conditions Index.  The St. Louis Fed Stress
Index is also trending tolerably.  (Both measures
are composites of various market indicators; they
moved up during May and have since recovered).
Sentiment is a tool we us a contrarian indicator.  Extremely pessimistic or exuberant outlooks on the market habitually, sooner or later,
result in the market moving the other way.  Last quarter, this report stated:“These indicators have shifted to a positive outlook on the
market…On balance it has been historically difficult for the market to mount a major rally, say 15% or greater, from sentiment levels like
this.”  So, sentiment said to not jump head-long into the market.
Sentiment has now shifted to the glum side. NedDavisResearch stated on June 16:“Sentiment has not gotten quite as pessimistic as in
2010 and 2011, but is pessimistic enough to support a bottoming process.”
In addition to polls, indicators involving a monetary commitment by investors are valuable.  The short interest on the NYSE is approaching
all-time highs.  The level of puts on individual equities remains elevated.  On June 6th the 21-day average put/call ratio nearly reached the
same level as last summer’s crisis levels.
Sentiment
ITS MarketView Analyst Report Page 4
ITS MarketView Analyst Report, July 19, 2012
45.0
50.0
55.0
60.0
65.0
70.0
75.0
80.0
85.0
90.0
95.0
650
750
850
950
1050
1150
1250
1350
1450
1550
5/23/06
11/23/06
5/23/07
11/23/07
5/23/08
11/23/08
5/23/09
11/23/09
5/23/10
11/23/10
5/23/11
11/23/11
5/23/12
S&P500 Equity Put/Call 21d ma
Source: CBOE & Dial Data
On the assumption investors have acted on their beliefs by selling, shorting or hedging with put options, some of the downside risk has
been alleviated.  Markets could fall more and pessimism could mount, but some of the air has been let out of the sentiment balloon.
The U.S. economy grew 1.7% in 2011, on the heels of 2010’s 3% growth.  Surveys of economist’s estimates for 2012 are centered on 2%.  
Few economists appearing in the financial news, except for ECRI, David Rosenberg, and John Hussman are calling for a recession.  Not one
of 49 economists in the WSJ July survey is predicting a recession for 2012, with a low estimate of 1% and a mean of 2%.  The 2012 average
estimate has dropped from 2.5% in April, perhaps as a result of recent data.
Earnings for the S&P 500 companies are expected to increase 8.4% in 2012.  2nd quarter earnings are expected to increase 3.3% year over
year.  Most of the year’s boost is anticipated to come in Q4, with a 14.7% y-o-y jump (Source:FactSet).  It will be a challenge.  Companies
such as FedEx, Bed, Bath & Beyond, Proctor and Gamble, McDonald’s, Ryder Systems, and Adobe have lowered guidance recently.
Recent economic reports continue to lose steam.  Some are moving in a disquieting trend.  The June Philadelphia Fed General Activity Index
dropped substantially to minus 16.6, the lowest reading since August 2011.  (The survey covers manufacturing activity in parts of several
Mid-Atlantic states).  The ISM Manufacturing Index fell below 50 in June, indicating contraction in the manufacturing sector.  Jobs growth
has slowed in recent months.  Retail sales fell in June for the third straight month.  The Citigroup Economic Surprise Index, which measures
how much reports are missing or beating the median estimates in Bloomberg surveys, was at a 10-month low in June.
Fundamentals
ITS MarketView Analyst Report Page 5
ITS MarketView Analyst Report, July 19, 2012
One driver of higher bottom line earnings is expected
to come from expanding margins.  US corporate profit
margins before taxes are just below the all-time high
of 14.63%.  The consensus forecast is for net profit
margins to keep rising, according to GoldmanSachs.
The firm’s equity strategist, David Kostin, takes a
different view and expects margins to decline.  That
would be in line with the historical norm—they have
never been sustainable in the past.
Many strategists have expressed concern about the
expiration of tax cuts and mandated automatic cuts
in government spending.  Instead of the dreaded
“fiscal cliff,”additional stimulative measures and
higher budget deficits may well prevail in the US and
elsewhere under the new-found cover of“growth”
policies.
In summing up the fundamental
side, expect slow growth in the U.S.  
A lot will have to go right for the 8%
earnings growth to materialize.  In
particular, a currently fatigued US
consumer will need to find a fresh
burst of energy as the year progresses.  
China and Europe will have to avoid
dispensing downside shocks.  When
all’s said and done, if a recession can
be avoided in the US, a major market
decline should be evaded as well.
4.00%
6.00%
8.00%
10.00%
12.00%
14.00%
16.00%
1950-I
1953-I
1956-I
1959-I
1962-I
1965-I
1968-I
1971-I
1974-I
1977-I
1980-I
1983-I
1986-I
1989-I
1992-I
1995-I
1998-I
2001-I
2004-I
2007-I
2010-I
Corporate Profits (blue), Recessions (gray), and Market Peaks (yellow)
Sources: NBER, BEA
Market Scenarios
Prior proposed scenarios for the 2nd Quarter 2012, offered in April 2012:
•  BaseCase:  The market is overbought and due for a pause.  Sentiment and seasonal factors also suggest a pause or more likely a correction
of 5 to 10 percent.  This would be healthy for the market.  Nothing grows to the sky and if the market were to advance further, it could set up
a more serious correction or an elongated consolidation.  The bulk of our indicators are nonetheless not bearish long-term.  So look for the
market to stall in the 1400 area with some downside action—60% probability.
ITS MarketView Analyst Report Page 6
ITS MarketView Analyst Report, July 19, 2012
•  BullCase:  Momentum is strong, there is sideline money waiting to come in and liquidity is positive.  Central banks will probably move to
add more liquidity if needed.  A further large advance is unrealistic now but a modest gain of 3 to 4 percent is plausible for Q2.  That would
place the S&P 500 in the 1450 zone—20% probability.
•  BearCase:  The waterfall decline of last summer was the first shot over the bow of the post-2009 cyclical bull market.  Spreads and stress
indicators exploded.  The rally since then is a classic“throwback”rally that was extended by massive liquidity.  Liquidity will do little in this
case to drive growth or heal over-leveraged economies.  Markets are putting in a long-term top and will not advance much further—20%
probability.
Outcome: TheBaseCasewonoutlastquarterasthemarketstalled.
Scenarios for the 3rd Quarter 2012
•  BaseCase:  The market is undergoing a corrective/consolidation phase.  The market is held down by anemic economic and earnings
reports, at least in the near term.  Conversely, the market is also sustained by hopes for 4th quarter growth and for more QE.  Both of these
divergent influences will likely carry on through the rest of the summer, with neither coming out on top.  Look for a choppy 3rd quarter with
the S&P 500 fluctuating within a range of 1250 to 1400—50% probability.
•  BullCase:  The market will be supported by modest economic growth.  Record S&P 500 earnings of $104 this year and then $117 next year
are expected.  Lower fuel prices will spur the consumer.  Auto sales are strong.  Housing is coming back.  Low rates will force investors out
of bonds into stocks.  Lots of cash is in money market funds earning nothing.  Congress will likely extend most of the tax cuts and spending
programs.  Central banks will move to add more liquidity if needed.  Europe will find a way to fix its problems by early next year.  China is
likely to stimulate.  The market will anticipate future developments and move to a new post-2009 high above 1422 this quarter—20%
probability.
•  BearCase:  The waterfall decline of last summer was the first shot over the bow of the post-2009 cyclical bull market.  The rally since
then is a classic“throwback”rally that was extended by massive liquidity.  Liquidity will do little in this case to drive growth or heal over-
leveraged economies.  The bear case is upped by 10% from last quarter due to the following factors: Company earnings warnings are
escalating, economic reports are dour, and there is no easy fix for Europe.  The high for post-2009 rally has been put in—30% probability.
THISPAGEINTENTIONALLYBLANK
Any outlooks, projections and/or commentary provided within this report are the opinion(s) of the analyst(s) and do not necessarily reflect the opinion of ITS. There is no
guarantee that the investment analysis or investment decisions made by ITS or its analyst(s) will protect against loss or prove profitable. Any market, economic and/or other
data presented herein was obtained from sources believed to be reliable, however ITS cannot guarantee its accuracy. PAST PERFORMANCE IS NO GUARANTEE
OF FUTURE RESULTS. This report was prepared for use by Solicitors of ITS and should not be construed as individual investment advice or utilized with clients.
Any use of text or graphics including reproduction, modification, distribution, or republication, without the prior written consent of ITS, is strictly prohibited. ALL
RIGHTS RESERVED.
1720Washington Road
P.O. Box 1260
Washington, PA 15301
1-800-765-4877
www.itsconnect.com

More Related Content

What's hot

Thiet ke Bao cao thuong nien - Vietcapital 2008
Thiet ke Bao cao thuong nien - Vietcapital 2008Thiet ke Bao cao thuong nien - Vietcapital 2008
Thiet ke Bao cao thuong nien - Vietcapital 2008
Viết Nội Dung
 
Putnam Fixed Income Outlook q313
Putnam Fixed Income Outlook q313Putnam Fixed Income Outlook q313
Putnam Fixed Income Outlook q313
Putnam Investments
 
InvestmentCommitteeResearch_AlchemyCapital_March2008
InvestmentCommitteeResearch_AlchemyCapital_March2008InvestmentCommitteeResearch_AlchemyCapital_March2008
InvestmentCommitteeResearch_AlchemyCapital_March2008
Jean-Marc Bloch-Lambert
 
Orbit barometer report october 2010
Orbit barometer report october 2010Orbit barometer report october 2010
Orbit barometer report october 2010
Frédéric Goblet
 
Avant garde wealth mgmt - Quarterly letter - 1312
Avant garde wealth mgmt  - Quarterly letter - 1312Avant garde wealth mgmt  - Quarterly letter - 1312
Avant garde wealth mgmt - Quarterly letter - 1312
Gaurav Jalan
 

What's hot (20)

Finlight Research - Market Perspectives - Nov 2015
Finlight Research - Market Perspectives - Nov 2015Finlight Research - Market Perspectives - Nov 2015
Finlight Research - Market Perspectives - Nov 2015
 
Sprung investment management commentary 3rd quarter, 2013
Sprung investment management commentary   3rd quarter, 2013Sprung investment management commentary   3rd quarter, 2013
Sprung investment management commentary 3rd quarter, 2013
 
Finlight Research - Market Perspectives - Oct 2014
Finlight Research - Market Perspectives - Oct 2014Finlight Research - Market Perspectives - Oct 2014
Finlight Research - Market Perspectives - Oct 2014
 
Putnam Perspectives: Fixed-Income Outlook Q3 2014
Putnam Perspectives: Fixed-Income Outlook Q3 2014Putnam Perspectives: Fixed-Income Outlook Q3 2014
Putnam Perspectives: Fixed-Income Outlook Q3 2014
 
Synovate economic $ummary q2 2010
Synovate economic $ummary q2 2010Synovate economic $ummary q2 2010
Synovate economic $ummary q2 2010
 
Putnam Perspectives: Fixed Income Outlook Q1 2014
Putnam Perspectives: Fixed Income Outlook Q1 2014Putnam Perspectives: Fixed Income Outlook Q1 2014
Putnam Perspectives: Fixed Income Outlook Q1 2014
 
Finlight Research - Market perspectives - Oct 2015
Finlight Research - Market perspectives - Oct 2015Finlight Research - Market perspectives - Oct 2015
Finlight Research - Market perspectives - Oct 2015
 
Thiet ke Bao cao thuong nien - Vietcapital 2008
Thiet ke Bao cao thuong nien - Vietcapital 2008Thiet ke Bao cao thuong nien - Vietcapital 2008
Thiet ke Bao cao thuong nien - Vietcapital 2008
 
2Q09 Asset Allocation
2Q09 Asset Allocation2Q09 Asset Allocation
2Q09 Asset Allocation
 
Putnam Fixed Income Outlook q313
Putnam Fixed Income Outlook q313Putnam Fixed Income Outlook q313
Putnam Fixed Income Outlook q313
 
InvestmentCommitteeResearch_AlchemyCapital_March2008
InvestmentCommitteeResearch_AlchemyCapital_March2008InvestmentCommitteeResearch_AlchemyCapital_March2008
InvestmentCommitteeResearch_AlchemyCapital_March2008
 
Petrocapita - Thoughts on 2011
Petrocapita - Thoughts on 2011Petrocapita - Thoughts on 2011
Petrocapita - Thoughts on 2011
 
FinLight Research - Market Perspectives Apr 2014
FinLight Research - Market Perspectives Apr 2014FinLight Research - Market Perspectives Apr 2014
FinLight Research - Market Perspectives Apr 2014
 
Outlook For Commodities
Outlook For CommoditiesOutlook For Commodities
Outlook For Commodities
 
Orbit barometer report october 2010
Orbit barometer report october 2010Orbit barometer report october 2010
Orbit barometer report october 2010
 
Putnam Perspectives: Equity Outlook Q3 2014
Putnam Perspectives: Equity Outlook Q3 2014Putnam Perspectives: Equity Outlook Q3 2014
Putnam Perspectives: Equity Outlook Q3 2014
 
Sprung Investment Management Commentary - 3rd Quarter, 2019
Sprung Investment Management Commentary - 3rd Quarter, 2019Sprung Investment Management Commentary - 3rd Quarter, 2019
Sprung Investment Management Commentary - 3rd Quarter, 2019
 
THIRD QUARTER 2015 RETROSPECTIVE AND PROSPECTIVE We’ve Seen This Movie Before
THIRD QUARTER 2015   RETROSPECTIVE AND PROSPECTIVE  We’ve Seen This Movie BeforeTHIRD QUARTER 2015   RETROSPECTIVE AND PROSPECTIVE  We’ve Seen This Movie Before
THIRD QUARTER 2015 RETROSPECTIVE AND PROSPECTIVE We’ve Seen This Movie Before
 
(287) are emerging markets really a problem
(287) are emerging markets really a problem(287) are emerging markets really a problem
(287) are emerging markets really a problem
 
Avant garde wealth mgmt - Quarterly letter - 1312
Avant garde wealth mgmt  - Quarterly letter - 1312Avant garde wealth mgmt  - Quarterly letter - 1312
Avant garde wealth mgmt - Quarterly letter - 1312
 

Viewers also liked (9)

Entry+Level+Resume
Entry+Level+ResumeEntry+Level+Resume
Entry+Level+Resume
 
Resume 2015
Resume 2015Resume 2015
Resume 2015
 
RESUME US 0316
RESUME US 0316RESUME US 0316
RESUME US 0316
 
Milton Dillards federal gov resume
Milton Dillards federal gov resumeMilton Dillards federal gov resume
Milton Dillards federal gov resume
 
Yue Xu's Resume with Recommendation Letters 2016
Yue Xu's Resume with Recommendation Letters 2016Yue Xu's Resume with Recommendation Letters 2016
Yue Xu's Resume with Recommendation Letters 2016
 
Trevor resume 2015
Trevor resume 2015 Trevor resume 2015
Trevor resume 2015
 
Resume_birara
Resume_biraraResume_birara
Resume_birara
 
Joe Ballou Resume
Joe Ballou ResumeJoe Ballou Resume
Joe Ballou Resume
 
MJA Resume 1-26-16
MJA Resume 1-26-16MJA Resume 1-26-16
MJA Resume 1-26-16
 

Similar to marketview-_7-12

BMO-TCH-Mid-Q3-Update_FINAL
BMO-TCH-Mid-Q3-Update_FINALBMO-TCH-Mid-Q3-Update_FINAL
BMO-TCH-Mid-Q3-Update_FINAL
Adam Phillips
 
Hyre Weekly Commentary
Hyre Weekly CommentaryHyre Weekly Commentary
Hyre Weekly Commentary
hyrejam
 
Credit_Suisse_Volatility_Outlook_Q3_11_14_July_2011
Credit_Suisse_Volatility_Outlook_Q3_11_14_July_2011Credit_Suisse_Volatility_Outlook_Q3_11_14_July_2011
Credit_Suisse_Volatility_Outlook_Q3_11_14_July_2011
Daniel Roy
 
2013.10.10 accuvest bpv-q4
2013.10.10 accuvest bpv-q42013.10.10 accuvest bpv-q4
2013.10.10 accuvest bpv-q4
advisorshares
 
Glc Market Matters
Glc Market MattersGlc Market Matters
Glc Market Matters
Martin Leduc
 
November 2010 commentary
November 2010 commentaryNovember 2010 commentary
November 2010 commentary
Martin Leduc
 
Brent woyat q1 2014 pimg commentary may2014
Brent woyat q1 2014 pimg commentary may2014Brent woyat q1 2014 pimg commentary may2014
Brent woyat q1 2014 pimg commentary may2014
bwoyat
 

Similar to marketview-_7-12 (20)

Trekking markets & more with Investrekk
Trekking markets & more with InvestrekkTrekking markets & more with Investrekk
Trekking markets & more with Investrekk
 
October 2010
October 2010October 2010
October 2010
 
October 2010
October 2010October 2010
October 2010
 
BMO-TCH-Mid-Q3-Update_FINAL
BMO-TCH-Mid-Q3-Update_FINALBMO-TCH-Mid-Q3-Update_FINAL
BMO-TCH-Mid-Q3-Update_FINAL
 
Finlight Research - Market Perspectives - Feb 2016
Finlight Research - Market Perspectives - Feb 2016Finlight Research - Market Perspectives - Feb 2016
Finlight Research - Market Perspectives - Feb 2016
 
Hyre Weekly Commentary
Hyre Weekly CommentaryHyre Weekly Commentary
Hyre Weekly Commentary
 
Finlight Research - Market Perspectives - Nov 2014
Finlight Research - Market Perspectives - Nov 2014Finlight Research - Market Perspectives - Nov 2014
Finlight Research - Market Perspectives - Nov 2014
 
Finlight Research - Market perspectives - Dec 2014
Finlight Research - Market perspectives - Dec 2014Finlight Research - Market perspectives - Dec 2014
Finlight Research - Market perspectives - Dec 2014
 
The deleveraging cycle
The deleveraging cycleThe deleveraging cycle
The deleveraging cycle
 
Vietnam's Recent Economic Development 2013
Vietnam's Recent Economic Development  2013Vietnam's Recent Economic Development  2013
Vietnam's Recent Economic Development 2013
 
2016 ETF and investment outlook
2016 ETF and investment outlook2016 ETF and investment outlook
2016 ETF and investment outlook
 
BlackRock: 2014 Outlook The List - What to Know, What to Do
BlackRock: 2014 Outlook The List - What to Know, What to DoBlackRock: 2014 Outlook The List - What to Know, What to Do
BlackRock: 2014 Outlook The List - What to Know, What to Do
 
Putnam Perspectives: Capital Markets Outlook Q3 2014
Putnam Perspectives: Capital Markets Outlook Q3 2014Putnam Perspectives: Capital Markets Outlook Q3 2014
Putnam Perspectives: Capital Markets Outlook Q3 2014
 
Credit_Suisse_Volatility_Outlook_Q3_11_14_July_2011
Credit_Suisse_Volatility_Outlook_Q3_11_14_July_2011Credit_Suisse_Volatility_Outlook_Q3_11_14_July_2011
Credit_Suisse_Volatility_Outlook_Q3_11_14_July_2011
 
2013.10.10 accuvest bpv-q4
2013.10.10 accuvest bpv-q42013.10.10 accuvest bpv-q4
2013.10.10 accuvest bpv-q4
 
Finlight Research - Market Perspectives - Aug 2016
Finlight Research - Market Perspectives - Aug 2016Finlight Research - Market Perspectives - Aug 2016
Finlight Research - Market Perspectives - Aug 2016
 
Glc Market Matters
Glc Market MattersGlc Market Matters
Glc Market Matters
 
Global Insight-Wake Me Up When September Begins
Global Insight-Wake Me Up When September BeginsGlobal Insight-Wake Me Up When September Begins
Global Insight-Wake Me Up When September Begins
 
November 2010 commentary
November 2010 commentaryNovember 2010 commentary
November 2010 commentary
 
Brent woyat q1 2014 pimg commentary may2014
Brent woyat q1 2014 pimg commentary may2014Brent woyat q1 2014 pimg commentary may2014
Brent woyat q1 2014 pimg commentary may2014
 

marketview-_7-12

  • 1. MarketView Analyst Report 3rd Quarter 2012 July 19, 2012 Frank P. Corbett, Senior Analyst 1720 Washington Road, P.O. Box 1260 Washington, PA 15301 (724) 745-2300 Phone (724) 745-0900 Fax www.itsconnect.com ITS-BDR-3-134-20120719For Professional Use Only — Not For UseWith the General Public Technical • The S&P 500 stock index corrected 10% from April to early June after a six month rally to a post-recovery high; Key secondary indexes such as small caps, transports, and cyclical stocks did not confirm the April new high in the cyclical bull market • The correction relieved some very overbought conditions as the market found support; a period of consolidation could set the stage for a risk-on rally in the second half • On balance, technical indicators are moderately bullish Liquidity • Stress indicators, such as bond spreads, have improved in the last month • Credit is growing at a modest pace and has reversed the 2008-2009 contraction; Efficiency of the new debt is uncertain • Central banks stand ready to supply additional liquidity if needed; the US Federal Reserve is likely to implement QE3, particularly if difficulties are encountered • Net, liquidity is sufficient Sentiment • Bullish sentiment of April has succumbed to the market correction and pessimism now prevails; it could mount for a while but eventually help set the stage for a rally • Turning Bullish Fundamental • Most economists are calling for 2% GDP growth for 2012 and analysts peg S&P 500 earnings growth at 8% • Economic reports of late have disappointed and a number of large corporations have issued earnings warnings based on slowing global growth • Momentum seems to be deteriorating; Growth will need to pick up in the second half; Caution is warranted on the fundamental front ********************** Indicator Summary ********************* The S&P 500 reached a new post-2009 recovery high in April. The NASDAQ reached an 11-year high. Some supporting measures, like the cumulative Advance/Decline line, have confirmed the move. Non-confirmation was seen in other key indexes like small cap stocks (Russell 2000), cyclicals, and transports. They failed to make new post-2009 highs. Likewise, the number of individual stocks making 52-week highs was unimpressive. The peak of new highs of NYSE stocks was 7% during the October to April rally. By comparison, about 28% of NYSE stocks made new highs in November-December, 2010, the best of the post-2009 bull market. It would be more constructive if lots of individual stocks were accompanying the indexes to new highs. Put another way, fewer soldiers have followed the generals on each march. In addition, volume during the October-April rally was anemic. Technical
  • 2. ITS MarketView Analyst Report Page 2 ITS MarketView Analyst Report, July 19, 2012 Of particular interest in the chart is the RSI (Relative Strength Index) displayed on top of the S&P 500 stock index. It broke above 70 in the first two rallies of this cyclical bull market. It topped out near 68 on the rally ending this past April and promptly rolled over. That’s a tip- off the rally lacked the“power”of the prior two. We noted last quarter:“On at least a temporary basis, the market is overbought and due for a pause or correction.” The market has pulled back and some of the overbought conditions have ameliorated. The S&P 500 is attempting to stabilize around 1300, which is fairly decent support. Having noted some negative technical aspects, the April to early June price action of the general market looks like a normal correction within an aging cyclical bull market. (The rally since March, 2009 has run 44 months compared to the average 19 months for cyclical bull markets within secular bears. It’s the second longest such rally since 1900). Some indicators on weekly charts such as BollingerBands and MACD give clues the market may rally or at least stabilize. For now, the bull should be given the benefit of the doubt. As time goes on, more technical“negative divergences”would be a potential reason to become more bearish. For now, holding or adding modestly to areas of opportunity is reasonable. Stock market tops are usually marked by declining liquidity. Indicators of declining liquidity include Fed tightening, low credit creation, declines in the money supply, an inverted yield curve, rising spreads on risky bonds, and falling commodity prices. Historically, not every one of these conditions needs to occur, but several generally have transpired as markets encounter difficulty. A conspicuous concern is the spreads and CDS on peripheral European sovereign debt such as Italy and Spain. They remain at elevated levels and should be observed closely. Europe is conceivably the one event that could cause rapid market deterioration. Governments and central banks are of course monitoring circumstances and have repetitively intervened with QE, bailouts, LTRO, etc. to re-liquefy the system. Don’t expect to see a systemic event or recession without governments throwing everything they have at it. What about the Fed? A new round of Quantitative Easing (QE) seems to be the option most likely to drive markets. Under QE, the Fed buys bonds and pays for them with newly created cash, injecting it directly into the system. QE3 has a number of potential triggers. First, GDP growth could slip to the negative side. Or inflation prints a low or negative number. A marked rise in unemployement would be of Liquidity
  • 3. ITS MarketView Analyst Report Page 3 ITS MarketView Analyst Report, July 19, 2012 concern, given the dual mandate. A shock, possibly from Europe, could set more QE in motion. Some cynics claim a 15 to 20% decline in stocks would by itself bring the Fed in. Is QE a cure-all? Several legitimate issues need to be raised. One, the lag before action is taken and the effects pass to the economy or markets may be such that damage may have already occurred. Second, the benefits of QE to the real economy may be minimal and diminishing. Third, the effective staying power of these measures seems to ebbing but the effects (on stocks and commodities) can be powerful for a time. Credit creation is playing a role in maintaining liquidity. Commercial loans and leases, Federal government debt, and student loans are growing. Unfortunately, the latter two sources of credit growth are not efficient in terms of additional GDP per dollar of debt. Total credit market debt outstanding, while now above 2007 levels, is growing at a modest annual rate of 2.5%. By comparison, credit grew about 10% yearly from 2000 to 2008. Some observers, such as economist Richard Duncan, feel credit growth of 2% or less is insufficient to keep the economy above water. In summary, credit is growing but not productively and barely sufficiently. Liquidity gauges in general for now demonstrate sufficiently accommodative financial conditions. For example, high yield bond spreads have been well behaved after last summer’s upsurge. Lower quality issues often react first in advance of a withering economy so the spreads on high yield bonds overTreasuries are always of interest. On the whole, liquidity overall has slightly improved from last quarter, citing the Bloomberg Financial Conditions Index. The St. Louis Fed Stress Index is also trending tolerably. (Both measures are composites of various market indicators; they moved up during May and have since recovered). Sentiment is a tool we us a contrarian indicator. Extremely pessimistic or exuberant outlooks on the market habitually, sooner or later, result in the market moving the other way. Last quarter, this report stated:“These indicators have shifted to a positive outlook on the market…On balance it has been historically difficult for the market to mount a major rally, say 15% or greater, from sentiment levels like this.” So, sentiment said to not jump head-long into the market. Sentiment has now shifted to the glum side. NedDavisResearch stated on June 16:“Sentiment has not gotten quite as pessimistic as in 2010 and 2011, but is pessimistic enough to support a bottoming process.” In addition to polls, indicators involving a monetary commitment by investors are valuable. The short interest on the NYSE is approaching all-time highs. The level of puts on individual equities remains elevated. On June 6th the 21-day average put/call ratio nearly reached the same level as last summer’s crisis levels. Sentiment
  • 4. ITS MarketView Analyst Report Page 4 ITS MarketView Analyst Report, July 19, 2012 45.0 50.0 55.0 60.0 65.0 70.0 75.0 80.0 85.0 90.0 95.0 650 750 850 950 1050 1150 1250 1350 1450 1550 5/23/06 11/23/06 5/23/07 11/23/07 5/23/08 11/23/08 5/23/09 11/23/09 5/23/10 11/23/10 5/23/11 11/23/11 5/23/12 S&P500 Equity Put/Call 21d ma Source: CBOE & Dial Data On the assumption investors have acted on their beliefs by selling, shorting or hedging with put options, some of the downside risk has been alleviated. Markets could fall more and pessimism could mount, but some of the air has been let out of the sentiment balloon. The U.S. economy grew 1.7% in 2011, on the heels of 2010’s 3% growth. Surveys of economist’s estimates for 2012 are centered on 2%. Few economists appearing in the financial news, except for ECRI, David Rosenberg, and John Hussman are calling for a recession. Not one of 49 economists in the WSJ July survey is predicting a recession for 2012, with a low estimate of 1% and a mean of 2%. The 2012 average estimate has dropped from 2.5% in April, perhaps as a result of recent data. Earnings for the S&P 500 companies are expected to increase 8.4% in 2012. 2nd quarter earnings are expected to increase 3.3% year over year. Most of the year’s boost is anticipated to come in Q4, with a 14.7% y-o-y jump (Source:FactSet). It will be a challenge. Companies such as FedEx, Bed, Bath & Beyond, Proctor and Gamble, McDonald’s, Ryder Systems, and Adobe have lowered guidance recently. Recent economic reports continue to lose steam. Some are moving in a disquieting trend. The June Philadelphia Fed General Activity Index dropped substantially to minus 16.6, the lowest reading since August 2011. (The survey covers manufacturing activity in parts of several Mid-Atlantic states). The ISM Manufacturing Index fell below 50 in June, indicating contraction in the manufacturing sector. Jobs growth has slowed in recent months. Retail sales fell in June for the third straight month. The Citigroup Economic Surprise Index, which measures how much reports are missing or beating the median estimates in Bloomberg surveys, was at a 10-month low in June. Fundamentals
  • 5. ITS MarketView Analyst Report Page 5 ITS MarketView Analyst Report, July 19, 2012 One driver of higher bottom line earnings is expected to come from expanding margins. US corporate profit margins before taxes are just below the all-time high of 14.63%. The consensus forecast is for net profit margins to keep rising, according to GoldmanSachs. The firm’s equity strategist, David Kostin, takes a different view and expects margins to decline. That would be in line with the historical norm—they have never been sustainable in the past. Many strategists have expressed concern about the expiration of tax cuts and mandated automatic cuts in government spending. Instead of the dreaded “fiscal cliff,”additional stimulative measures and higher budget deficits may well prevail in the US and elsewhere under the new-found cover of“growth” policies. In summing up the fundamental side, expect slow growth in the U.S. A lot will have to go right for the 8% earnings growth to materialize. In particular, a currently fatigued US consumer will need to find a fresh burst of energy as the year progresses. China and Europe will have to avoid dispensing downside shocks. When all’s said and done, if a recession can be avoided in the US, a major market decline should be evaded as well. 4.00% 6.00% 8.00% 10.00% 12.00% 14.00% 16.00% 1950-I 1953-I 1956-I 1959-I 1962-I 1965-I 1968-I 1971-I 1974-I 1977-I 1980-I 1983-I 1986-I 1989-I 1992-I 1995-I 1998-I 2001-I 2004-I 2007-I 2010-I Corporate Profits (blue), Recessions (gray), and Market Peaks (yellow) Sources: NBER, BEA Market Scenarios Prior proposed scenarios for the 2nd Quarter 2012, offered in April 2012: • BaseCase: The market is overbought and due for a pause. Sentiment and seasonal factors also suggest a pause or more likely a correction of 5 to 10 percent. This would be healthy for the market. Nothing grows to the sky and if the market were to advance further, it could set up a more serious correction or an elongated consolidation. The bulk of our indicators are nonetheless not bearish long-term. So look for the market to stall in the 1400 area with some downside action—60% probability.
  • 6. ITS MarketView Analyst Report Page 6 ITS MarketView Analyst Report, July 19, 2012 • BullCase: Momentum is strong, there is sideline money waiting to come in and liquidity is positive. Central banks will probably move to add more liquidity if needed. A further large advance is unrealistic now but a modest gain of 3 to 4 percent is plausible for Q2. That would place the S&P 500 in the 1450 zone—20% probability. • BearCase: The waterfall decline of last summer was the first shot over the bow of the post-2009 cyclical bull market. Spreads and stress indicators exploded. The rally since then is a classic“throwback”rally that was extended by massive liquidity. Liquidity will do little in this case to drive growth or heal over-leveraged economies. Markets are putting in a long-term top and will not advance much further—20% probability. Outcome: TheBaseCasewonoutlastquarterasthemarketstalled. Scenarios for the 3rd Quarter 2012 • BaseCase: The market is undergoing a corrective/consolidation phase. The market is held down by anemic economic and earnings reports, at least in the near term. Conversely, the market is also sustained by hopes for 4th quarter growth and for more QE. Both of these divergent influences will likely carry on through the rest of the summer, with neither coming out on top. Look for a choppy 3rd quarter with the S&P 500 fluctuating within a range of 1250 to 1400—50% probability. • BullCase: The market will be supported by modest economic growth. Record S&P 500 earnings of $104 this year and then $117 next year are expected. Lower fuel prices will spur the consumer. Auto sales are strong. Housing is coming back. Low rates will force investors out of bonds into stocks. Lots of cash is in money market funds earning nothing. Congress will likely extend most of the tax cuts and spending programs. Central banks will move to add more liquidity if needed. Europe will find a way to fix its problems by early next year. China is likely to stimulate. The market will anticipate future developments and move to a new post-2009 high above 1422 this quarter—20% probability. • BearCase: The waterfall decline of last summer was the first shot over the bow of the post-2009 cyclical bull market. The rally since then is a classic“throwback”rally that was extended by massive liquidity. Liquidity will do little in this case to drive growth or heal over- leveraged economies. The bear case is upped by 10% from last quarter due to the following factors: Company earnings warnings are escalating, economic reports are dour, and there is no easy fix for Europe. The high for post-2009 rally has been put in—30% probability.
  • 8. Any outlooks, projections and/or commentary provided within this report are the opinion(s) of the analyst(s) and do not necessarily reflect the opinion of ITS. There is no guarantee that the investment analysis or investment decisions made by ITS or its analyst(s) will protect against loss or prove profitable. Any market, economic and/or other data presented herein was obtained from sources believed to be reliable, however ITS cannot guarantee its accuracy. PAST PERFORMANCE IS NO GUARANTEE OF FUTURE RESULTS. This report was prepared for use by Solicitors of ITS and should not be construed as individual investment advice or utilized with clients. Any use of text or graphics including reproduction, modification, distribution, or republication, without the prior written consent of ITS, is strictly prohibited. ALL RIGHTS RESERVED. 1720Washington Road P.O. Box 1260 Washington, PA 15301 1-800-765-4877 www.itsconnect.com