SlideShare a Scribd company logo
1 of 6
Download to read offline
Theme
© Tricumen Limited 2014. All rights reserved.
1 / 6 DK / AP/ Agentha / 21 July 2014
Capital markets revenues and banks’ valuations
The variance of capital markets earnings is often said to (1) heighten the volatility of the share
price and/or (2) depress the market valuation.
For the banks included in this note, we find no evidence that the first assumption holds true …
… but we do identify a strong correlation between the capital markets revenue dynamics and
valuations: banks with (relatively) stable revenues are rewarded with higher valuations.
Scope and methodology
The peer group comprises global banks whose capital markets/equivalent units contributed at
least 50% of Group’s pre-tax profits during FY12-13. The exceptions are Deutsche Bank and
J.P.Morgan: their normalised capital markets profits are slightly below the 50% threshold, but we
believe capital markets earnings (and/or related matters – for example, litigation) are the key
driver of valuations. We also exclude Societe Generale, because the bank’s market valuation is
not, in our view, primarily driven by capital markets earnings as defined in this report.
We excluded revenue from principal investments, as well as DVA/equivalent and revenues/losses
not incurred in the regular course of business and collaboration revenue (which, in most cases,
we view as aspirational, rather than actual and/or achievable); but we included relevant ‘legacy’
items. All financial data is fully reconciled against the published financial statements.
We opted for variance, rather than standard deviation-based annualised volatility, because we
were interested in the spread of values (revenue and share price/valuations) over a 4-year
period. At any rate, the resulting bank-vs-bank comparisons are very similar in scale.
Capital markets revenue variance
The chart plots variance in the peer group’s capital markets quarterly revenue since 1Q10; this is
usually seen as the first ‘normal’ post-‘Crunch’ quarter. The results may come as a surprise: with the
exception of Goldman Sachs, pure(r) investment banks have far more stable revenues than their
universal peers.
In more recent times, since 1Q12, banking and markets revenue variance has decreased: especially at
Bank of America Merrill Lynch, Goldman Sachs and Credit Suisse. However, Deutsche Bank’s revenue
variance has increased during this period to (almost) match that of Goldman Sachs.
Capital markets revenue variance (quarterly data, reverse scale, US$m)
Source: Tricumen analysis. Note: Banking: fees from DCM bonds and loans, ECM, M&A & Advisory. Markets: FX, rates, credit,
commodities, securitisation, EQ cash, derivatives and converts. Dedicated prop trading revenue is included; principal
investments are excluded. Tricumen product definitions apply throughout.
38%
-62%
-9%
-72%
37%
140%
-6%
-66%
BAML
BARC
Citi
CS
DBK
GS
JPM
MS
high
revenue
volatility
low
revenue
volatility
1Q10 - 1Q14
-18%
-33%
17%
-64%
50%
75%
-5%
-23%
BAML
BARC
Citi
CS
DBK
GS
JPM
MS
Banking + Markets
Markets
Peer
Group
Avg.
1Q12 - 1Q14
Theme
© Tricumen Limited 2014. All rights reserved.
2 / 6 DK / AP / Agentha / 21 July 2014
Revenue variance vs share price performance …
How correlated are capital markets revenues with share price performance? In two words – not
much: investors reward individual banks’ revenue1
-generating ability.
Below, we compare capital markets revenue variance (left hand scale – same data as in the left-hand
chart on the first page) against the movement in banks’ period-end share prices for 1, 2, 3 and 4
years (right-hand scale) to the end of June-14. The data suggests that:
There is no significant correlation between the two series of data. The share price of
Goldman Sachs, the bank with the highest variance in capital markets revenue in this peer group,
convincingly outperformed European banks with much more stable earnings. This may be a
reflection of European banks’ political and/or regulatory environment as much as (or more than)
their financial performance; but Goldman Sachs’ strong share price performance versus US peers
also stands in contrast with its volatile revenue.
Furthermore, there is no evidence that ‘pure’(r) the investment banks, Goldman Sachs and
Morgan Stanley (though the later benefited from its newfound focus on equities and money
management), underperformed the more diversified Bank of America Merrill Lynch or Citigroup.
Interestingly, even the marketwide concerns about the outlook for FICC revenues over the last
12 months (red dots) did not unduly trouble Goldman Sachs’ share price: in fact, it did slightly
better than Citigroup and J.P.Morgan, and was barely behind Bank of America Merrill Lynch.
Capital markets revenue variance (LHS, quarterly data 1Q10-1Q14, reverse scale, US$) vs
share price performance (RHS)
Source: NASDAQ, FT.com, Tricumen revenue analysis.
1
We ran the same analysis against banks’ capital markets profits (instead of revenue), excluding collaboration profits. The
result was not meaningfully different, despite significant variation between individual banks’ cost/income ratios. In our view,
this shows that investors view revenue as the key driver of profits while cost management is, at best, a short-term play. This
was the topic of our 27-Nov-13 note titled ‘Profit Drivers’.
38%
-62%
-9%
-72%
37%
140%
-6%
-66%
-120%
-80%
-40%
0%
40%
80%
120%-150%
-100%
-50%
0%
50%
100%
150%
BAML BARC Citi CS DBK GS JPM MS
Banking + Markets Revenue variance 1Q10-1Q14 Last 1Y Last 2Y Last 3Y Last 4Y
Share price performance: period to end-2Q14 (local currency)
low
revenue
volatility
high
revenue
volatility
share price
increased
share price
declined
Theme
© Tricumen Limited 2014. All rights reserved.
3 / 6 DK / AP / Agentha / 21 July 2014
… and share valuations
Looking at the market valuation of the banks in this report, two related patterns are evident:
Capital markets earnings do seem to carry a significant valuation discount. At end-June-14 and
end-June-13 (red dots and orange boxes), the composite P/BV and P/E valuations of Goldman
Sachs and J.P.Morgan2
were significantly below their three peers whose earnings are less
dependent on a capital markets ‘story’ (Bank of America Merrill Lynch and Citigroup) and/or have
made strategic changes to their group-wide franchises that investors approved of (Morgan
Stanley).
There is also a tangible link between revenue variance and market valuation. For example,
Goldman Sachs’ composite P/BV and P/E valuation in two most recent periods was more than
50% below the peer group average (J.P.Morgan is penalised on P/E measure, but had the
highest P/BV at end-June-14); while Barclays and Credit Suisse are among the most highly
valued stocks overall, especially in more recent periods. Other banks generally fall between
these three banks, but the pattern is evident.
Also, while the book value calculation does not lend itself readily to adjustments, revenues could
be refined – and that would further emphasise the link between revenue variance and valuations.
We view P/BV as the more reliable measure of relative value, and have therefore weighted the
composite valuation in favour of it. This resulted in a composite valuation that favours US banks:
in recent years, investors priced the book value of US banks more highly that that of European
banks’. European banks, however, achieved consistently higher P/E valuations.
Finally, some might disagree with our favouring P/BV over P/E, and not without reason. The
latter could be refined by, for example, weighting capital markets revenue versus the revenue of
the Group; and/or the mix of capital market revenue to take account of the exposure to ‘slow’
area of business (for example, FICC). This would, in our view, further highlight the relationship
between revenue dynamics and valuations.
Capital markets revenue variance (LHS, quarterly data 1Q10-1Q14, reverse scale, US$) vs
composite P/BV and P/E valuations (RHS, over/(under) peer group average)
Source: NASDAQ, FT.com, Tricumen revenue, profit and book value analysis. Notes: (1) Our calculation of historical
price/earnings (P/E) and price/book value (P/BV) ratios, is based on the Group published profit, book value and share count
from the financial statements published prior to the valuation date shown. (2) P/E outliers falling outside the 3-standard
deviation band for the peer group are excluded.
2
On P/BV measure alone, though, Goldman Sachs and J.P.Morgan were both comfortably ahead of their peers at end-June-14:
J.P.Morgan 1.08x, Goldman Sachs 1.06x, Morgan Stanley 1.0x, Bank of America Merrill Lynch 0.75x, Citigroup 0.73x.
38%
-62%
-9%
-72%
37%
140%
-6%
-66%
-120%
-80%
-40%
0%
40%
80%
120%-150%
-100%
-50%
0%
50%
100%
150%
BAML BARC Citi CS DBK GS JPM MS
Banking + Markets Revenue variance 1Q10-1Q14 end-June-14 end-June-13 end-June-12 end-June-11
Composite P/BV and P/E valuations over/(under) peer group average at:
low
revenue
volatility
high
revenue
volatility
valuation
above
peers'
valuation
below
peers'
Theme
© Tricumen Limited 2014. All rights reserved.
4 / 6 DK / AP / Agentha / 21 July 2014
Appendix 1 – Share price and P/BV
Bank of America Merrill Lynch Barclays
Citigroup Credit Suisse
Deutsche Bank Goldman Sachs
J.P.Morgan Morgan Stanley
Source: NASDAQ, FT.com, Tricumen book value analysis.
0.2x
0.3x
0.4x
0.5x
0.6x
0.7x
0.8x
0.9x
$0
$5
$10
$15
$20
$25
Dec-09 Jun-10 Dec-10 Jun-11 Dec-11 Jun-12 Dec-12 Jun-13 Dec-13
BAC (daily close) P/BV
0.3x
0.4x
0.4x
0.5x
0.5x
0.6x
0.6x
0.7x
0.7x
0.8x
0.8x
100p
150p
200p
250p
300p
350p
400p
Dec-09 Jun-10 Dec-10 Jun-11 Dec-11 Jun-12 Dec-12 Jun-13 Dec-13
BARC (daily close) P/BV
0.3x
0.4x
0.5x
0.6x
0.7x
0.8x
0.9x
$15
$20
$25
$30
$35
$40
$45
$50
$55
$60
Dec-09 Jun-10 Dec-10 Jun-11 Dec-11 Jun-12 Dec-12 Jun-13 Dec-13
Citi (dailyclose) P/BV
Note: Adjusted for 10-1 split in May-11
0.3x
0.5x
0.7x
0.9x
1.1x
1.3x
1.5x
CHF10
CHF15
CHF20
CHF25
CHF30
CHF35
CHF40
CHF45
CHF50
CHF55
CHF60
Dec-09 Jun-10 Dec-10 Jun-11 Dec-11 Jun-12 Dec-12 Jun-13 Dec-13
CS (daily close) P/BV
0.2x
0.3x
0.4x
0.5x
0.6x
0.7x
0.8x
EUR10
EUR20
EUR30
EUR40
EUR50
EUR60
EUR70
Dec-09 Jun-10 Dec-10 Jun-11 Dec-11 Jun-12 Dec-12 Jun-13 Dec-13
DBK (daily close) P/BV
0.3x
0.4x
0.5x
0.6x
0.7x
0.8x
0.9x
1.0x
1.1x
1.2x
$80
$100
$120
$140
$160
$180
$200
Dec-09 Jun-10 Dec-10 Jun-11 Dec-11 Jun-12 Dec-12 Jun-13 Dec-13
GS (daily close) P/BV
0.3x
0.4x
0.5x
0.6x
0.7x
0.8x
0.9x
1.0x
1.1x
1.2x
$20
$25
$30
$35
$40
$45
$50
$55
$60
$65
Dec-09 Jun-10 Dec-10 Jun-11 Dec-11 Jun-12 Dec-12 Jun-13 Dec-13
JPM (daily close) P/BV
0.2x
0.3x
0.4x
0.5x
0.6x
0.7x
0.8x
$10
$15
$20
$25
$30
$35
Dec-09 Jun-10 Dec-10 Jun-11 Dec-11 Jun-12 Dec-12 Jun-13 Dec-13
MS (daily close) P/BV
Theme
© Tricumen Limited 2014. All rights reserved.
5 / 6 DK / AP / Agentha / 21 July 2014
Appendix 2 – P/BV dynamics
P/BV dynamics (1-Jan-10 – end-June-14)
Source: NASDAQ, FT.com, Tricumen book value analysis.
20
40
60
80
100
120
140
160
180
31-Dec-09
31-Mar-10
30-Jun-10
30-Sep-10
31-Dec-10
31-Mar-11
30-Jun-11
30-Sep-11
31-Dec-11
31-Mar-12
30-Jun-12
30-Sep-12
31-Dec-12
31-Mar-13
30-Jun-13
30-Sep-13
31-Dec-13
31-Mar-14
BAC
BARC
Citi
CS
DBK
GS
JPM
MS
Theme
© Tricumen Limited 2014. All rights reserved.
6 / 6 DK / AP / Agentha / 21 July 2014
About Tricumen
Tricumen was founded in 2008. It quickly became a strong provider of diversified market intelligence
across the capital markets and has since expanded into transaction and corporate banking coverage.
Tricumen’s data has been used by many of the world’s leading investment banks as well as strategy
consulting firms, investment managers and ‘blue chip’ corporations.
Situated near Cambridge in the UK, Tricumen is almost exclusively staffed with senior individuals with
an extensive track record of either working for or analysing banks; and boasts what we believe is the
largest capital markets-focused research network of its peer group.
Caveats
No part of this document may be reproduced or transmitted in any form by any means without written
permission of Tricumen Limited. Such consent is often given, provided that the information released is
sourced to Tricumen and that it does not prejudice Tricumen Limited’s business or compromise the
company’s ability to analyse the financial markets. Full acknowledgement of Tricumen Limited must be
given.
Tricumen Limited has used all reasonable care in writing, editing and presenting the information found
in this report. All reasonable effort has been made to ensure the information supplied is accurate and
not misleading. For the purposes of cross- market comparison, all numerical data is normalised in
accordance to Tricumen Limited’s proprietary product classification. Fully-researched dataset may
contain margin of error of 10%; for modelled datasets, this margin may be wider.
The information and commentary provided in this report has been compiled for informational purposes
only. We recommend that independent advice and enquiries should be sought before acting upon it.
Readers should not rely on this information for legal, accounting, investment, or similar purposes. No
part of this report constitutes investment advice, any form of recommendation, or a solicitation to buy
or sell any instrument or to engage in any trading or investment activity or strategy. Tricumen Limited
does not provide investment advice or personal recommendation nor will it be deemed to have done so.
Tricumen Limited makes no representation, guarantee or warranty as to the suitability, accuracy or
completeness of the report or the information therein. Tricumen Limited assumes no responsibility for
information contained in this report and disclaims all liability arising from negligence or otherwise in
respect of such information.
Tricumen Limited is not liable for any damages arising in contract, tort or otherwise from the use of or
inability to use this report or any material contained in it, or from any action or decision taken as a
result of using the report.
© Tricumen Limited 2014. All rights reserved.

More Related Content

What's hot

Western reserve q1 2009 client update letter
Western reserve  q1 2009 client update letterWestern reserve  q1 2009 client update letter
Western reserve q1 2009 client update letterMichael Durante
 
Mercer Capital's Value Focus: FinTech Industry | Second Quarter 2015
Mercer Capital's Value Focus: FinTech Industry | Second Quarter 2015Mercer Capital's Value Focus: FinTech Industry | Second Quarter 2015
Mercer Capital's Value Focus: FinTech Industry | Second Quarter 2015Mercer Capital
 
CMC Markets Trading Smart Series: Company Fundamentals
CMC Markets Trading Smart Series: Company FundamentalsCMC Markets Trading Smart Series: Company Fundamentals
CMC Markets Trading Smart Series: Company FundamentalsCMCMarketsSG
 
Michael Durante Western Reserve research analysis- camel example
Michael Durante Western Reserve  research analysis- camel exampleMichael Durante Western Reserve  research analysis- camel example
Michael Durante Western Reserve research analysis- camel exampleMichael Durante
 
Michael Durante Western Reserve Blackwall Partners 2011 outlook primer- final
Michael Durante Western Reserve Blackwall Partners   2011 outlook primer- finalMichael Durante Western Reserve Blackwall Partners   2011 outlook primer- final
Michael Durante Western Reserve Blackwall Partners 2011 outlook primer- finalMichael Durante
 
Fund Admin: the Zoo of Data & the Data Science Solution
Fund Admin: the Zoo of Data & the Data Science SolutionFund Admin: the Zoo of Data & the Data Science Solution
Fund Admin: the Zoo of Data & the Data Science SolutionInvestCloud Inc.
 
Mercer Capital's Investment Management Industry Newsletter | Q4 2021 | Focus:...
Mercer Capital's Investment Management Industry Newsletter | Q4 2021 | Focus:...Mercer Capital's Investment Management Industry Newsletter | Q4 2021 | Focus:...
Mercer Capital's Investment Management Industry Newsletter | Q4 2021 | Focus:...Mercer Capital
 
Mercer Capital's Investment Management Industry Newsletter | Q1 2019 | Focus:...
Mercer Capital's Investment Management Industry Newsletter | Q1 2019 | Focus:...Mercer Capital's Investment Management Industry Newsletter | Q1 2019 | Focus:...
Mercer Capital's Investment Management Industry Newsletter | Q1 2019 | Focus:...Mercer Capital
 
Mercer Capital's Portfolio Valuation: Private Equity and Credit | Q1 2020
Mercer Capital's Portfolio Valuation: Private Equity and Credit | Q1 2020Mercer Capital's Portfolio Valuation: Private Equity and Credit | Q1 2020
Mercer Capital's Portfolio Valuation: Private Equity and Credit | Q1 2020Mercer Capital
 
Mercer Capital's Investment Management Industry Newsletter | Q4 2021 | Focus:...
Mercer Capital's Investment Management Industry Newsletter | Q4 2021 | Focus:...Mercer Capital's Investment Management Industry Newsletter | Q4 2021 | Focus:...
Mercer Capital's Investment Management Industry Newsletter | Q4 2021 | Focus:...Mercer Capital
 
Intro to Financial Management
Intro to Financial ManagementIntro to Financial Management
Intro to Financial ManagementEnrique Melero
 
CHW Vol 13 Isu 4 April Quarterly Genuity
CHW Vol 13 Isu 4 April Quarterly GenuityCHW Vol 13 Isu 4 April Quarterly Genuity
CHW Vol 13 Isu 4 April Quarterly GenuityJ Scott Miller
 

What's hot (16)

Western reserve q1 2009 client update letter
Western reserve  q1 2009 client update letterWestern reserve  q1 2009 client update letter
Western reserve q1 2009 client update letter
 
C Score
C ScoreC Score
C Score
 
Seasons earnings jan_18_13
Seasons earnings jan_18_13Seasons earnings jan_18_13
Seasons earnings jan_18_13
 
Mercer Capital's Value Focus: FinTech Industry | Second Quarter 2015
Mercer Capital's Value Focus: FinTech Industry | Second Quarter 2015Mercer Capital's Value Focus: FinTech Industry | Second Quarter 2015
Mercer Capital's Value Focus: FinTech Industry | Second Quarter 2015
 
CMC Markets Trading Smart Series: Company Fundamentals
CMC Markets Trading Smart Series: Company FundamentalsCMC Markets Trading Smart Series: Company Fundamentals
CMC Markets Trading Smart Series: Company Fundamentals
 
Michael Durante Western Reserve research analysis- camel example
Michael Durante Western Reserve  research analysis- camel exampleMichael Durante Western Reserve  research analysis- camel example
Michael Durante Western Reserve research analysis- camel example
 
Presentation
PresentationPresentation
Presentation
 
Michael Durante Western Reserve Blackwall Partners 2011 outlook primer- final
Michael Durante Western Reserve Blackwall Partners   2011 outlook primer- finalMichael Durante Western Reserve Blackwall Partners   2011 outlook primer- final
Michael Durante Western Reserve Blackwall Partners 2011 outlook primer- final
 
Fund Admin: the Zoo of Data & the Data Science Solution
Fund Admin: the Zoo of Data & the Data Science SolutionFund Admin: the Zoo of Data & the Data Science Solution
Fund Admin: the Zoo of Data & the Data Science Solution
 
Mercer Capital's Investment Management Industry Newsletter | Q4 2021 | Focus:...
Mercer Capital's Investment Management Industry Newsletter | Q4 2021 | Focus:...Mercer Capital's Investment Management Industry Newsletter | Q4 2021 | Focus:...
Mercer Capital's Investment Management Industry Newsletter | Q4 2021 | Focus:...
 
Mercer Capital's Investment Management Industry Newsletter | Q1 2019 | Focus:...
Mercer Capital's Investment Management Industry Newsletter | Q1 2019 | Focus:...Mercer Capital's Investment Management Industry Newsletter | Q1 2019 | Focus:...
Mercer Capital's Investment Management Industry Newsletter | Q1 2019 | Focus:...
 
Why Apex
Why ApexWhy Apex
Why Apex
 
Mercer Capital's Portfolio Valuation: Private Equity and Credit | Q1 2020
Mercer Capital's Portfolio Valuation: Private Equity and Credit | Q1 2020Mercer Capital's Portfolio Valuation: Private Equity and Credit | Q1 2020
Mercer Capital's Portfolio Valuation: Private Equity and Credit | Q1 2020
 
Mercer Capital's Investment Management Industry Newsletter | Q4 2021 | Focus:...
Mercer Capital's Investment Management Industry Newsletter | Q4 2021 | Focus:...Mercer Capital's Investment Management Industry Newsletter | Q4 2021 | Focus:...
Mercer Capital's Investment Management Industry Newsletter | Q4 2021 | Focus:...
 
Intro to Financial Management
Intro to Financial ManagementIntro to Financial Management
Intro to Financial Management
 
CHW Vol 13 Isu 4 April Quarterly Genuity
CHW Vol 13 Isu 4 April Quarterly GenuityCHW Vol 13 Isu 4 April Quarterly Genuity
CHW Vol 13 Isu 4 April Quarterly Genuity
 

Viewers also liked

PROYECTO DE AULA MARTHA ESMERALDA ESPITIA
PROYECTO DE AULA MARTHA ESMERALDA ESPITIAPROYECTO DE AULA MARTHA ESMERALDA ESPITIA
PROYECTO DE AULA MARTHA ESMERALDA ESPITIAdcpe2014
 
Tricumen / 1Q15 Capital Markets Result Review_open 110515
Tricumen / 1Q15 Capital Markets Result Review_open 110515Tricumen / 1Q15 Capital Markets Result Review_open 110515
Tricumen / 1Q15 Capital Markets Result Review_open 110515Tricumen Ltd
 
Logo Marketing design
Logo Marketing design Logo Marketing design
Logo Marketing design jackk3727
 
Simple Tricks That You Can Apply In Web Marketing
Simple Tricks That You Can Apply In Web MarketingSimple Tricks That You Can Apply In Web Marketing
Simple Tricks That You Can Apply In Web MarketingJerry Snyker
 

Viewers also liked (6)

Suffrage and Electoral System
Suffrage and Electoral SystemSuffrage and Electoral System
Suffrage and Electoral System
 
PROYECTO DE AULA MARTHA ESMERALDA ESPITIA
PROYECTO DE AULA MARTHA ESMERALDA ESPITIAPROYECTO DE AULA MARTHA ESMERALDA ESPITIA
PROYECTO DE AULA MARTHA ESMERALDA ESPITIA
 
Contaminacion del agua
Contaminacion del aguaContaminacion del agua
Contaminacion del agua
 
Tricumen / 1Q15 Capital Markets Result Review_open 110515
Tricumen / 1Q15 Capital Markets Result Review_open 110515Tricumen / 1Q15 Capital Markets Result Review_open 110515
Tricumen / 1Q15 Capital Markets Result Review_open 110515
 
Logo Marketing design
Logo Marketing design Logo Marketing design
Logo Marketing design
 
Simple Tricks That You Can Apply In Web Marketing
Simple Tricks That You Can Apply In Web MarketingSimple Tricks That You Can Apply In Web Marketing
Simple Tricks That You Can Apply In Web Marketing
 

Similar to Tricumen / Capital markets revenues and banks valuations 210714

“Over” and “Under” Valued Financial Institutions: Evidence from a “Fair-Value...
“Over” and “Under” Valued Financial Institutions: Evidence from a “Fair-Value...“Over” and “Under” Valued Financial Institutions: Evidence from a “Fair-Value...
“Over” and “Under” Valued Financial Institutions: Evidence from a “Fair-Value...Ilias Lekkos
 
Can Small Cap Stocks Weather the Storm?
Can Small Cap Stocks Weather the Storm?Can Small Cap Stocks Weather the Storm?
Can Small Cap Stocks Weather the Storm?Susan Langdon
 
FDC Investment Overivew 10315 rlc
FDC Investment Overivew 10315 rlcFDC Investment Overivew 10315 rlc
FDC Investment Overivew 10315 rlcRon Coleman
 
BMO-TCH-Mid-Q3-Update_FINAL
BMO-TCH-Mid-Q3-Update_FINALBMO-TCH-Mid-Q3-Update_FINAL
BMO-TCH-Mid-Q3-Update_FINALAdam Phillips
 
Tricumen / RWA dynamics FY11-FY14E_070115 open
Tricumen / RWA dynamics FY11-FY14E_070115 openTricumen / RWA dynamics FY11-FY14E_070115 open
Tricumen / RWA dynamics FY11-FY14E_070115 openTricumen Ltd
 
Tricumen / Rates markets: A perfect storm_200614
Tricumen / Rates markets: A perfect storm_200614Tricumen / Rates markets: A perfect storm_200614
Tricumen / Rates markets: A perfect storm_200614Tricumen Ltd
 
Tricumen / Capital Markets Profit drivers Nov-13
Tricumen / Capital Markets Profit drivers Nov-13Tricumen / Capital Markets Profit drivers Nov-13
Tricumen / Capital Markets Profit drivers Nov-13Tricumen Ltd
 
Tricumen / Revenue and (lack of) volatility_17-June-14
Tricumen / Revenue and (lack of) volatility_17-June-14Tricumen / Revenue and (lack of) volatility_17-June-14
Tricumen / Revenue and (lack of) volatility_17-June-14Tricumen Ltd
 
Tricumen 2Q12 Results Update Public
Tricumen 2Q12 Results Update PublicTricumen 2Q12 Results Update Public
Tricumen 2Q12 Results Update Publicsebwalker
 
Q1 2016-credit third avenue
Q1 2016-credit third avenueQ1 2016-credit third avenue
Q1 2016-credit third avenueFrank Ragol
 
Abacus Weath Partners Investment slideshow
Abacus Weath Partners Investment slideshowAbacus Weath Partners Investment slideshow
Abacus Weath Partners Investment slideshowAbacus Wealth Partners
 
Avant Garde wealth Mgmt - Quarterly letter - 1303
Avant Garde wealth Mgmt - Quarterly letter - 1303Avant Garde wealth Mgmt - Quarterly letter - 1303
Avant Garde wealth Mgmt - Quarterly letter - 1303Gaurav Jalan
 
Tricumen / Capital Markets: Results Review 2Q14 / 6m14
Tricumen / Capital Markets: Results Review 2Q14 / 6m14Tricumen / Capital Markets: Results Review 2Q14 / 6m14
Tricumen / Capital Markets: Results Review 2Q14 / 6m14Tricumen Ltd
 
POST CRISIS STUDY OF THE UK BANKING SYSTEM using the Rose and Panzar H statistic
POST CRISIS STUDY OF THE UK BANKING SYSTEM using the Rose and Panzar H statisticPOST CRISIS STUDY OF THE UK BANKING SYSTEM using the Rose and Panzar H statistic
POST CRISIS STUDY OF THE UK BANKING SYSTEM using the Rose and Panzar H statisticSubhrodip Sengupta
 
Financial Times - How to avoid an average hedge fund
Financial Times - How to avoid an average hedge fundFinancial Times - How to avoid an average hedge fund
Financial Times - How to avoid an average hedge fundLisa Krow
 
Portfolio perspectives-greatest lesson-part2-0813
Portfolio perspectives-greatest lesson-part2-0813Portfolio perspectives-greatest lesson-part2-0813
Portfolio perspectives-greatest lesson-part2-0813Better Financial Education
 
A Decade of Credit, August 2014
A Decade of Credit, August 2014A Decade of Credit, August 2014
A Decade of Credit, August 2014Redington
 
US_Banks_Disclosures_Have_Grown_But_Many_Financial_Risks_Remain_Opaque
US_Banks_Disclosures_Have_Grown_But_Many_Financial_Risks_Remain_OpaqueUS_Banks_Disclosures_Have_Grown_But_Many_Financial_Risks_Remain_Opaque
US_Banks_Disclosures_Have_Grown_But_Many_Financial_Risks_Remain_OpaqueJonathan Nus
 
Invbots training materials 20210104 - Macro Strategy
Invbots training materials 20210104 - Macro StrategyInvbots training materials 20210104 - Macro Strategy
Invbots training materials 20210104 - Macro StrategyInvbots Limited
 

Similar to Tricumen / Capital markets revenues and banks valuations 210714 (20)

“Over” and “Under” Valued Financial Institutions: Evidence from a “Fair-Value...
“Over” and “Under” Valued Financial Institutions: Evidence from a “Fair-Value...“Over” and “Under” Valued Financial Institutions: Evidence from a “Fair-Value...
“Over” and “Under” Valued Financial Institutions: Evidence from a “Fair-Value...
 
Can Small Cap Stocks Weather the Storm?
Can Small Cap Stocks Weather the Storm?Can Small Cap Stocks Weather the Storm?
Can Small Cap Stocks Weather the Storm?
 
FDC Investment Overivew 10315 rlc
FDC Investment Overivew 10315 rlcFDC Investment Overivew 10315 rlc
FDC Investment Overivew 10315 rlc
 
BMO-TCH-Mid-Q3-Update_FINAL
BMO-TCH-Mid-Q3-Update_FINALBMO-TCH-Mid-Q3-Update_FINAL
BMO-TCH-Mid-Q3-Update_FINAL
 
Tricumen / RWA dynamics FY11-FY14E_070115 open
Tricumen / RWA dynamics FY11-FY14E_070115 openTricumen / RWA dynamics FY11-FY14E_070115 open
Tricumen / RWA dynamics FY11-FY14E_070115 open
 
Tricumen / Rates markets: A perfect storm_200614
Tricumen / Rates markets: A perfect storm_200614Tricumen / Rates markets: A perfect storm_200614
Tricumen / Rates markets: A perfect storm_200614
 
Tricumen / Capital Markets Profit drivers Nov-13
Tricumen / Capital Markets Profit drivers Nov-13Tricumen / Capital Markets Profit drivers Nov-13
Tricumen / Capital Markets Profit drivers Nov-13
 
Tricumen / Revenue and (lack of) volatility_17-June-14
Tricumen / Revenue and (lack of) volatility_17-June-14Tricumen / Revenue and (lack of) volatility_17-June-14
Tricumen / Revenue and (lack of) volatility_17-June-14
 
Tricumen 2Q12 Results Update Public
Tricumen 2Q12 Results Update PublicTricumen 2Q12 Results Update Public
Tricumen 2Q12 Results Update Public
 
Q1 2016-credit third avenue
Q1 2016-credit third avenueQ1 2016-credit third avenue
Q1 2016-credit third avenue
 
Abacus Weath Partners Investment slideshow
Abacus Weath Partners Investment slideshowAbacus Weath Partners Investment slideshow
Abacus Weath Partners Investment slideshow
 
Avant Garde wealth Mgmt - Quarterly letter - 1303
Avant Garde wealth Mgmt - Quarterly letter - 1303Avant Garde wealth Mgmt - Quarterly letter - 1303
Avant Garde wealth Mgmt - Quarterly letter - 1303
 
Tricumen / Capital Markets: Results Review 2Q14 / 6m14
Tricumen / Capital Markets: Results Review 2Q14 / 6m14Tricumen / Capital Markets: Results Review 2Q14 / 6m14
Tricumen / Capital Markets: Results Review 2Q14 / 6m14
 
POST CRISIS STUDY OF THE UK BANKING SYSTEM using the Rose and Panzar H statistic
POST CRISIS STUDY OF THE UK BANKING SYSTEM using the Rose and Panzar H statisticPOST CRISIS STUDY OF THE UK BANKING SYSTEM using the Rose and Panzar H statistic
POST CRISIS STUDY OF THE UK BANKING SYSTEM using the Rose and Panzar H statistic
 
Financial Times - How to avoid an average hedge fund
Financial Times - How to avoid an average hedge fundFinancial Times - How to avoid an average hedge fund
Financial Times - How to avoid an average hedge fund
 
Portfolio perspectives-greatest lesson-part2-0813
Portfolio perspectives-greatest lesson-part2-0813Portfolio perspectives-greatest lesson-part2-0813
Portfolio perspectives-greatest lesson-part2-0813
 
A Decade of Credit, August 2014
A Decade of Credit, August 2014A Decade of Credit, August 2014
A Decade of Credit, August 2014
 
Monthly Perspectives - Volatility - June 2016
Monthly Perspectives - Volatility - June 2016Monthly Perspectives - Volatility - June 2016
Monthly Perspectives - Volatility - June 2016
 
US_Banks_Disclosures_Have_Grown_But_Many_Financial_Risks_Remain_Opaque
US_Banks_Disclosures_Have_Grown_But_Many_Financial_Risks_Remain_OpaqueUS_Banks_Disclosures_Have_Grown_But_Many_Financial_Risks_Remain_Opaque
US_Banks_Disclosures_Have_Grown_But_Many_Financial_Risks_Remain_Opaque
 
Invbots training materials 20210104 - Macro Strategy
Invbots training materials 20210104 - Macro StrategyInvbots training materials 20210104 - Macro Strategy
Invbots training materials 20210104 - Macro Strategy
 

More from Tricumen Ltd

Tricumen FY17 Capital Markets REGIONS_open 030318
Tricumen FY17 Capital Markets REGIONS_open 030318Tricumen FY17 Capital Markets REGIONS_open 030318
Tricumen FY17 Capital Markets REGIONS_open 030318Tricumen Ltd
 
Tricumen 4Q17/FY17 wholesale Banking results_open 260218
Tricumen 4Q17/FY17 wholesale Banking results_open 260218Tricumen 4Q17/FY17 wholesale Banking results_open 260218
Tricumen 4Q17/FY17 wholesale Banking results_open 260218Tricumen Ltd
 
Tricumen 3Q17 Wholesale Banking Results Review_OPEN 221117
Tricumen 3Q17 Wholesale Banking Results Review_OPEN 221117Tricumen 3Q17 Wholesale Banking Results Review_OPEN 221117
Tricumen 3Q17 Wholesale Banking Results Review_OPEN 221117Tricumen Ltd
 
Tricumen 6m17 Capital Markes: Regions_open 300817
Tricumen 6m17 Capital Markes: Regions_open 300817Tricumen 6m17 Capital Markes: Regions_open 300817
Tricumen 6m17 Capital Markes: Regions_open 300817Tricumen Ltd
 
Tricumen 1Q17 Capital Markets: Regions_310517
Tricumen 1Q17 Capital Markets: Regions_310517Tricumen 1Q17 Capital Markets: Regions_310517
Tricumen 1Q17 Capital Markets: Regions_310517Tricumen Ltd
 
Tricumen FY16 Capital Markets Regions_open 100317
Tricumen FY16 Capital Markets Regions_open 100317Tricumen FY16 Capital Markets Regions_open 100317
Tricumen FY16 Capital Markets Regions_open 100317Tricumen Ltd
 
Tricumen 4Q16/FY16 Wholesale Banking results review_open 270217
Tricumen 4Q16/FY16 Wholesale Banking results review_open 270217Tricumen 4Q16/FY16 Wholesale Banking results review_open 270217
Tricumen 4Q16/FY16 Wholesale Banking results review_open 270217Tricumen Ltd
 
Tricumen 9m16 Capital Markets Regions_OPEN 121216
Tricumen 9m16 Capital Markets Regions_OPEN 121216Tricumen 9m16 Capital Markets Regions_OPEN 121216
Tricumen 9m16 Capital Markets Regions_OPEN 121216Tricumen Ltd
 
Tricumen_3Q16 Wholesale Banking Results Review_OPEN 051216
Tricumen_3Q16 Wholesale Banking Results Review_OPEN 051216Tricumen_3Q16 Wholesale Banking Results Review_OPEN 051216
Tricumen_3Q16 Wholesale Banking Results Review_OPEN 051216Tricumen Ltd
 
Tricumen 6m16 Capital Markets Results Review_Regions_OPEN 010916
Tricumen 6m16 Capital Markets Results Review_Regions_OPEN 010916Tricumen 6m16 Capital Markets Results Review_Regions_OPEN 010916
Tricumen 6m16 Capital Markets Results Review_Regions_OPEN 010916Tricumen Ltd
 
Tricumen 2Q16 Capital Markes Results Review_open 290816
Tricumen 2Q16 Capital Markes Results Review_open 290816Tricumen 2Q16 Capital Markes Results Review_open 290816
Tricumen 2Q16 Capital Markes Results Review_open 290816Tricumen Ltd
 
Tricumen / Capital Markets: Regions 1Q16_open 260516
Tricumen / Capital Markets: Regions 1Q16_open 260516Tricumen / Capital Markets: Regions 1Q16_open 260516
Tricumen / Capital Markets: Regions 1Q16_open 260516Tricumen Ltd
 
Tricumen / 1Q16 Capital Markets Results Review_open
Tricumen / 1Q16 Capital Markets Results Review_openTricumen / 1Q16 Capital Markets Results Review_open
Tricumen / 1Q16 Capital Markets Results Review_openTricumen Ltd
 
Tricumen / Credit Suisse: Restructuring EMEA and Americas_290316
Tricumen / Credit Suisse: Restructuring EMEA and Americas_290316Tricumen / Credit Suisse: Restructuring EMEA and Americas_290316
Tricumen / Credit Suisse: Restructuring EMEA and Americas_290316Tricumen Ltd
 
Tricumen / FY15 Capital Markets: Regions_open 080316
Tricumen / FY15 Capital Markets: Regions_open 080316Tricumen / FY15 Capital Markets: Regions_open 080316
Tricumen / FY15 Capital Markets: Regions_open 080316Tricumen Ltd
 
Standard Chartered_credit risk management 140116
Standard Chartered_credit risk management 140116Standard Chartered_credit risk management 140116
Standard Chartered_credit risk management 140116Tricumen Ltd
 
Tricumen / Barclays Investment Bank_extending the cuts_151215
Tricumen / Barclays Investment Bank_extending the cuts_151215Tricumen / Barclays Investment Bank_extending the cuts_151215
Tricumen / Barclays Investment Bank_extending the cuts_151215Tricumen Ltd
 
Tricumen / M&A boutiques vs globals_101215
Tricumen / M&A boutiques vs globals_101215Tricumen / M&A boutiques vs globals_101215
Tricumen / M&A boutiques vs globals_101215Tricumen Ltd
 
Tricumen / Future Models in Wholesale Banking 100915
Tricumen / Future Models in Wholesale Banking 100915Tricumen / Future Models in Wholesale Banking 100915
Tricumen / Future Models in Wholesale Banking 100915Tricumen Ltd
 
Tricumen / Capital Markets Regions 6m15_open 230815
Tricumen / Capital Markets Regions 6m15_open 230815Tricumen / Capital Markets Regions 6m15_open 230815
Tricumen / Capital Markets Regions 6m15_open 230815Tricumen Ltd
 

More from Tricumen Ltd (20)

Tricumen FY17 Capital Markets REGIONS_open 030318
Tricumen FY17 Capital Markets REGIONS_open 030318Tricumen FY17 Capital Markets REGIONS_open 030318
Tricumen FY17 Capital Markets REGIONS_open 030318
 
Tricumen 4Q17/FY17 wholesale Banking results_open 260218
Tricumen 4Q17/FY17 wholesale Banking results_open 260218Tricumen 4Q17/FY17 wholesale Banking results_open 260218
Tricumen 4Q17/FY17 wholesale Banking results_open 260218
 
Tricumen 3Q17 Wholesale Banking Results Review_OPEN 221117
Tricumen 3Q17 Wholesale Banking Results Review_OPEN 221117Tricumen 3Q17 Wholesale Banking Results Review_OPEN 221117
Tricumen 3Q17 Wholesale Banking Results Review_OPEN 221117
 
Tricumen 6m17 Capital Markes: Regions_open 300817
Tricumen 6m17 Capital Markes: Regions_open 300817Tricumen 6m17 Capital Markes: Regions_open 300817
Tricumen 6m17 Capital Markes: Regions_open 300817
 
Tricumen 1Q17 Capital Markets: Regions_310517
Tricumen 1Q17 Capital Markets: Regions_310517Tricumen 1Q17 Capital Markets: Regions_310517
Tricumen 1Q17 Capital Markets: Regions_310517
 
Tricumen FY16 Capital Markets Regions_open 100317
Tricumen FY16 Capital Markets Regions_open 100317Tricumen FY16 Capital Markets Regions_open 100317
Tricumen FY16 Capital Markets Regions_open 100317
 
Tricumen 4Q16/FY16 Wholesale Banking results review_open 270217
Tricumen 4Q16/FY16 Wholesale Banking results review_open 270217Tricumen 4Q16/FY16 Wholesale Banking results review_open 270217
Tricumen 4Q16/FY16 Wholesale Banking results review_open 270217
 
Tricumen 9m16 Capital Markets Regions_OPEN 121216
Tricumen 9m16 Capital Markets Regions_OPEN 121216Tricumen 9m16 Capital Markets Regions_OPEN 121216
Tricumen 9m16 Capital Markets Regions_OPEN 121216
 
Tricumen_3Q16 Wholesale Banking Results Review_OPEN 051216
Tricumen_3Q16 Wholesale Banking Results Review_OPEN 051216Tricumen_3Q16 Wholesale Banking Results Review_OPEN 051216
Tricumen_3Q16 Wholesale Banking Results Review_OPEN 051216
 
Tricumen 6m16 Capital Markets Results Review_Regions_OPEN 010916
Tricumen 6m16 Capital Markets Results Review_Regions_OPEN 010916Tricumen 6m16 Capital Markets Results Review_Regions_OPEN 010916
Tricumen 6m16 Capital Markets Results Review_Regions_OPEN 010916
 
Tricumen 2Q16 Capital Markes Results Review_open 290816
Tricumen 2Q16 Capital Markes Results Review_open 290816Tricumen 2Q16 Capital Markes Results Review_open 290816
Tricumen 2Q16 Capital Markes Results Review_open 290816
 
Tricumen / Capital Markets: Regions 1Q16_open 260516
Tricumen / Capital Markets: Regions 1Q16_open 260516Tricumen / Capital Markets: Regions 1Q16_open 260516
Tricumen / Capital Markets: Regions 1Q16_open 260516
 
Tricumen / 1Q16 Capital Markets Results Review_open
Tricumen / 1Q16 Capital Markets Results Review_openTricumen / 1Q16 Capital Markets Results Review_open
Tricumen / 1Q16 Capital Markets Results Review_open
 
Tricumen / Credit Suisse: Restructuring EMEA and Americas_290316
Tricumen / Credit Suisse: Restructuring EMEA and Americas_290316Tricumen / Credit Suisse: Restructuring EMEA and Americas_290316
Tricumen / Credit Suisse: Restructuring EMEA and Americas_290316
 
Tricumen / FY15 Capital Markets: Regions_open 080316
Tricumen / FY15 Capital Markets: Regions_open 080316Tricumen / FY15 Capital Markets: Regions_open 080316
Tricumen / FY15 Capital Markets: Regions_open 080316
 
Standard Chartered_credit risk management 140116
Standard Chartered_credit risk management 140116Standard Chartered_credit risk management 140116
Standard Chartered_credit risk management 140116
 
Tricumen / Barclays Investment Bank_extending the cuts_151215
Tricumen / Barclays Investment Bank_extending the cuts_151215Tricumen / Barclays Investment Bank_extending the cuts_151215
Tricumen / Barclays Investment Bank_extending the cuts_151215
 
Tricumen / M&A boutiques vs globals_101215
Tricumen / M&A boutiques vs globals_101215Tricumen / M&A boutiques vs globals_101215
Tricumen / M&A boutiques vs globals_101215
 
Tricumen / Future Models in Wholesale Banking 100915
Tricumen / Future Models in Wholesale Banking 100915Tricumen / Future Models in Wholesale Banking 100915
Tricumen / Future Models in Wholesale Banking 100915
 
Tricumen / Capital Markets Regions 6m15_open 230815
Tricumen / Capital Markets Regions 6m15_open 230815Tricumen / Capital Markets Regions 6m15_open 230815
Tricumen / Capital Markets Regions 6m15_open 230815
 

Recently uploaded

Call Girls In Mahipalpur O9654467111 Escorts Service
Call Girls In Mahipalpur O9654467111  Escorts ServiceCall Girls In Mahipalpur O9654467111  Escorts Service
Call Girls In Mahipalpur O9654467111 Escorts ServiceSapana Sha
 
Beautiful Sapna Vip Call Girls Hauz Khas 9711199012 Call /Whatsapps
Beautiful Sapna Vip  Call Girls Hauz Khas 9711199012 Call /WhatsappsBeautiful Sapna Vip  Call Girls Hauz Khas 9711199012 Call /Whatsapps
Beautiful Sapna Vip Call Girls Hauz Khas 9711199012 Call /Whatsappssapnasaifi408
 
1:1定制(UQ毕业证)昆士兰大学毕业证成绩单修改留信学历认证原版一模一样
1:1定制(UQ毕业证)昆士兰大学毕业证成绩单修改留信学历认证原版一模一样1:1定制(UQ毕业证)昆士兰大学毕业证成绩单修改留信学历认证原版一模一样
1:1定制(UQ毕业证)昆士兰大学毕业证成绩单修改留信学历认证原版一模一样vhwb25kk
 
vip Sarai Rohilla Call Girls 9999965857 Call or WhatsApp Now Book
vip Sarai Rohilla Call Girls 9999965857 Call or WhatsApp Now Bookvip Sarai Rohilla Call Girls 9999965857 Call or WhatsApp Now Book
vip Sarai Rohilla Call Girls 9999965857 Call or WhatsApp Now Bookmanojkuma9823
 
Effects of Smartphone Addiction on the Academic Performances of Grades 9 to 1...
Effects of Smartphone Addiction on the Academic Performances of Grades 9 to 1...Effects of Smartphone Addiction on the Academic Performances of Grades 9 to 1...
Effects of Smartphone Addiction on the Academic Performances of Grades 9 to 1...limedy534
 
Saket, (-DELHI )+91-9654467111-(=)CHEAP Call Girls in Escorts Service Saket C...
Saket, (-DELHI )+91-9654467111-(=)CHEAP Call Girls in Escorts Service Saket C...Saket, (-DELHI )+91-9654467111-(=)CHEAP Call Girls in Escorts Service Saket C...
Saket, (-DELHI )+91-9654467111-(=)CHEAP Call Girls in Escorts Service Saket C...Sapana Sha
 
Data Science Jobs and Salaries Analysis.pptx
Data Science Jobs and Salaries Analysis.pptxData Science Jobs and Salaries Analysis.pptx
Data Science Jobs and Salaries Analysis.pptxFurkanTasci3
 
How we prevented account sharing with MFA
How we prevented account sharing with MFAHow we prevented account sharing with MFA
How we prevented account sharing with MFAAndrei Kaleshka
 
VIP Call Girls Service Miyapur Hyderabad Call +91-8250192130
VIP Call Girls Service Miyapur Hyderabad Call +91-8250192130VIP Call Girls Service Miyapur Hyderabad Call +91-8250192130
VIP Call Girls Service Miyapur Hyderabad Call +91-8250192130Suhani Kapoor
 
Customer Service Analytics - Make Sense of All Your Data.pptx
Customer Service Analytics - Make Sense of All Your Data.pptxCustomer Service Analytics - Make Sense of All Your Data.pptx
Customer Service Analytics - Make Sense of All Your Data.pptxEmmanuel Dauda
 
PKS-TGC-1084-630 - Stage 1 Proposal.pptx
PKS-TGC-1084-630 - Stage 1 Proposal.pptxPKS-TGC-1084-630 - Stage 1 Proposal.pptx
PKS-TGC-1084-630 - Stage 1 Proposal.pptxPramod Kumar Srivastava
 
DBA Basics: Getting Started with Performance Tuning.pdf
DBA Basics: Getting Started with Performance Tuning.pdfDBA Basics: Getting Started with Performance Tuning.pdf
DBA Basics: Getting Started with Performance Tuning.pdfJohn Sterrett
 
办理学位证中佛罗里达大学毕业证,UCF成绩单原版一比一
办理学位证中佛罗里达大学毕业证,UCF成绩单原版一比一办理学位证中佛罗里达大学毕业证,UCF成绩单原版一比一
办理学位证中佛罗里达大学毕业证,UCF成绩单原版一比一F sss
 
ASML's Taxonomy Adventure by Daniel Canter
ASML's Taxonomy Adventure by Daniel CanterASML's Taxonomy Adventure by Daniel Canter
ASML's Taxonomy Adventure by Daniel Cantervoginip
 
RadioAdProWritingCinderellabyButleri.pdf
RadioAdProWritingCinderellabyButleri.pdfRadioAdProWritingCinderellabyButleri.pdf
RadioAdProWritingCinderellabyButleri.pdfgstagge
 
毕业文凭制作#回国入职#diploma#degree澳洲中央昆士兰大学毕业证成绩单pdf电子版制作修改#毕业文凭制作#回国入职#diploma#degree
毕业文凭制作#回国入职#diploma#degree澳洲中央昆士兰大学毕业证成绩单pdf电子版制作修改#毕业文凭制作#回国入职#diploma#degree毕业文凭制作#回国入职#diploma#degree澳洲中央昆士兰大学毕业证成绩单pdf电子版制作修改#毕业文凭制作#回国入职#diploma#degree
毕业文凭制作#回国入职#diploma#degree澳洲中央昆士兰大学毕业证成绩单pdf电子版制作修改#毕业文凭制作#回国入职#diploma#degreeyuu sss
 
꧁❤ Greater Noida Call Girls Delhi ❤꧂ 9711199171 ☎️ Hard And Sexy Vip Call
꧁❤ Greater Noida Call Girls Delhi ❤꧂ 9711199171 ☎️ Hard And Sexy Vip Call꧁❤ Greater Noida Call Girls Delhi ❤꧂ 9711199171 ☎️ Hard And Sexy Vip Call
꧁❤ Greater Noida Call Girls Delhi ❤꧂ 9711199171 ☎️ Hard And Sexy Vip Callshivangimorya083
 
Consent & Privacy Signals on Google *Pixels* - MeasureCamp Amsterdam 2024
Consent & Privacy Signals on Google *Pixels* - MeasureCamp Amsterdam 2024Consent & Privacy Signals on Google *Pixels* - MeasureCamp Amsterdam 2024
Consent & Privacy Signals on Google *Pixels* - MeasureCamp Amsterdam 2024thyngster
 

Recently uploaded (20)

E-Commerce Order PredictionShraddha Kamble.pptx
E-Commerce Order PredictionShraddha Kamble.pptxE-Commerce Order PredictionShraddha Kamble.pptx
E-Commerce Order PredictionShraddha Kamble.pptx
 
Call Girls In Mahipalpur O9654467111 Escorts Service
Call Girls In Mahipalpur O9654467111  Escorts ServiceCall Girls In Mahipalpur O9654467111  Escorts Service
Call Girls In Mahipalpur O9654467111 Escorts Service
 
Beautiful Sapna Vip Call Girls Hauz Khas 9711199012 Call /Whatsapps
Beautiful Sapna Vip  Call Girls Hauz Khas 9711199012 Call /WhatsappsBeautiful Sapna Vip  Call Girls Hauz Khas 9711199012 Call /Whatsapps
Beautiful Sapna Vip Call Girls Hauz Khas 9711199012 Call /Whatsapps
 
1:1定制(UQ毕业证)昆士兰大学毕业证成绩单修改留信学历认证原版一模一样
1:1定制(UQ毕业证)昆士兰大学毕业证成绩单修改留信学历认证原版一模一样1:1定制(UQ毕业证)昆士兰大学毕业证成绩单修改留信学历认证原版一模一样
1:1定制(UQ毕业证)昆士兰大学毕业证成绩单修改留信学历认证原版一模一样
 
vip Sarai Rohilla Call Girls 9999965857 Call or WhatsApp Now Book
vip Sarai Rohilla Call Girls 9999965857 Call or WhatsApp Now Bookvip Sarai Rohilla Call Girls 9999965857 Call or WhatsApp Now Book
vip Sarai Rohilla Call Girls 9999965857 Call or WhatsApp Now Book
 
Effects of Smartphone Addiction on the Academic Performances of Grades 9 to 1...
Effects of Smartphone Addiction on the Academic Performances of Grades 9 to 1...Effects of Smartphone Addiction on the Academic Performances of Grades 9 to 1...
Effects of Smartphone Addiction on the Academic Performances of Grades 9 to 1...
 
Saket, (-DELHI )+91-9654467111-(=)CHEAP Call Girls in Escorts Service Saket C...
Saket, (-DELHI )+91-9654467111-(=)CHEAP Call Girls in Escorts Service Saket C...Saket, (-DELHI )+91-9654467111-(=)CHEAP Call Girls in Escorts Service Saket C...
Saket, (-DELHI )+91-9654467111-(=)CHEAP Call Girls in Escorts Service Saket C...
 
Data Science Jobs and Salaries Analysis.pptx
Data Science Jobs and Salaries Analysis.pptxData Science Jobs and Salaries Analysis.pptx
Data Science Jobs and Salaries Analysis.pptx
 
How we prevented account sharing with MFA
How we prevented account sharing with MFAHow we prevented account sharing with MFA
How we prevented account sharing with MFA
 
VIP Call Girls Service Miyapur Hyderabad Call +91-8250192130
VIP Call Girls Service Miyapur Hyderabad Call +91-8250192130VIP Call Girls Service Miyapur Hyderabad Call +91-8250192130
VIP Call Girls Service Miyapur Hyderabad Call +91-8250192130
 
Customer Service Analytics - Make Sense of All Your Data.pptx
Customer Service Analytics - Make Sense of All Your Data.pptxCustomer Service Analytics - Make Sense of All Your Data.pptx
Customer Service Analytics - Make Sense of All Your Data.pptx
 
PKS-TGC-1084-630 - Stage 1 Proposal.pptx
PKS-TGC-1084-630 - Stage 1 Proposal.pptxPKS-TGC-1084-630 - Stage 1 Proposal.pptx
PKS-TGC-1084-630 - Stage 1 Proposal.pptx
 
DBA Basics: Getting Started with Performance Tuning.pdf
DBA Basics: Getting Started with Performance Tuning.pdfDBA Basics: Getting Started with Performance Tuning.pdf
DBA Basics: Getting Started with Performance Tuning.pdf
 
Call Girls in Saket 99530🔝 56974 Escort Service
Call Girls in Saket 99530🔝 56974 Escort ServiceCall Girls in Saket 99530🔝 56974 Escort Service
Call Girls in Saket 99530🔝 56974 Escort Service
 
办理学位证中佛罗里达大学毕业证,UCF成绩单原版一比一
办理学位证中佛罗里达大学毕业证,UCF成绩单原版一比一办理学位证中佛罗里达大学毕业证,UCF成绩单原版一比一
办理学位证中佛罗里达大学毕业证,UCF成绩单原版一比一
 
ASML's Taxonomy Adventure by Daniel Canter
ASML's Taxonomy Adventure by Daniel CanterASML's Taxonomy Adventure by Daniel Canter
ASML's Taxonomy Adventure by Daniel Canter
 
RadioAdProWritingCinderellabyButleri.pdf
RadioAdProWritingCinderellabyButleri.pdfRadioAdProWritingCinderellabyButleri.pdf
RadioAdProWritingCinderellabyButleri.pdf
 
毕业文凭制作#回国入职#diploma#degree澳洲中央昆士兰大学毕业证成绩单pdf电子版制作修改#毕业文凭制作#回国入职#diploma#degree
毕业文凭制作#回国入职#diploma#degree澳洲中央昆士兰大学毕业证成绩单pdf电子版制作修改#毕业文凭制作#回国入职#diploma#degree毕业文凭制作#回国入职#diploma#degree澳洲中央昆士兰大学毕业证成绩单pdf电子版制作修改#毕业文凭制作#回国入职#diploma#degree
毕业文凭制作#回国入职#diploma#degree澳洲中央昆士兰大学毕业证成绩单pdf电子版制作修改#毕业文凭制作#回国入职#diploma#degree
 
꧁❤ Greater Noida Call Girls Delhi ❤꧂ 9711199171 ☎️ Hard And Sexy Vip Call
꧁❤ Greater Noida Call Girls Delhi ❤꧂ 9711199171 ☎️ Hard And Sexy Vip Call꧁❤ Greater Noida Call Girls Delhi ❤꧂ 9711199171 ☎️ Hard And Sexy Vip Call
꧁❤ Greater Noida Call Girls Delhi ❤꧂ 9711199171 ☎️ Hard And Sexy Vip Call
 
Consent & Privacy Signals on Google *Pixels* - MeasureCamp Amsterdam 2024
Consent & Privacy Signals on Google *Pixels* - MeasureCamp Amsterdam 2024Consent & Privacy Signals on Google *Pixels* - MeasureCamp Amsterdam 2024
Consent & Privacy Signals on Google *Pixels* - MeasureCamp Amsterdam 2024
 

Tricumen / Capital markets revenues and banks valuations 210714

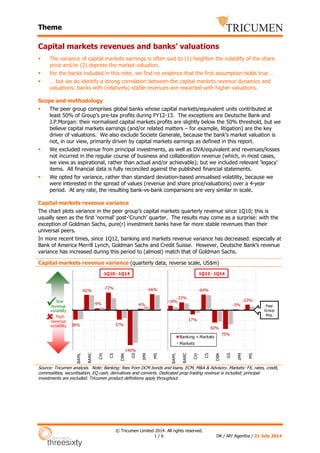
  • 1. Theme © Tricumen Limited 2014. All rights reserved. 1 / 6 DK / AP/ Agentha / 21 July 2014 Capital markets revenues and banks’ valuations The variance of capital markets earnings is often said to (1) heighten the volatility of the share price and/or (2) depress the market valuation. For the banks included in this note, we find no evidence that the first assumption holds true … … but we do identify a strong correlation between the capital markets revenue dynamics and valuations: banks with (relatively) stable revenues are rewarded with higher valuations. Scope and methodology The peer group comprises global banks whose capital markets/equivalent units contributed at least 50% of Group’s pre-tax profits during FY12-13. The exceptions are Deutsche Bank and J.P.Morgan: their normalised capital markets profits are slightly below the 50% threshold, but we believe capital markets earnings (and/or related matters – for example, litigation) are the key driver of valuations. We also exclude Societe Generale, because the bank’s market valuation is not, in our view, primarily driven by capital markets earnings as defined in this report. We excluded revenue from principal investments, as well as DVA/equivalent and revenues/losses not incurred in the regular course of business and collaboration revenue (which, in most cases, we view as aspirational, rather than actual and/or achievable); but we included relevant ‘legacy’ items. All financial data is fully reconciled against the published financial statements. We opted for variance, rather than standard deviation-based annualised volatility, because we were interested in the spread of values (revenue and share price/valuations) over a 4-year period. At any rate, the resulting bank-vs-bank comparisons are very similar in scale. Capital markets revenue variance The chart plots variance in the peer group’s capital markets quarterly revenue since 1Q10; this is usually seen as the first ‘normal’ post-‘Crunch’ quarter. The results may come as a surprise: with the exception of Goldman Sachs, pure(r) investment banks have far more stable revenues than their universal peers. In more recent times, since 1Q12, banking and markets revenue variance has decreased: especially at Bank of America Merrill Lynch, Goldman Sachs and Credit Suisse. However, Deutsche Bank’s revenue variance has increased during this period to (almost) match that of Goldman Sachs. Capital markets revenue variance (quarterly data, reverse scale, US$m) Source: Tricumen analysis. Note: Banking: fees from DCM bonds and loans, ECM, M&A & Advisory. Markets: FX, rates, credit, commodities, securitisation, EQ cash, derivatives and converts. Dedicated prop trading revenue is included; principal investments are excluded. Tricumen product definitions apply throughout. 38% -62% -9% -72% 37% 140% -6% -66% BAML BARC Citi CS DBK GS JPM MS high revenue volatility low revenue volatility 1Q10 - 1Q14 -18% -33% 17% -64% 50% 75% -5% -23% BAML BARC Citi CS DBK GS JPM MS Banking + Markets Markets Peer Group Avg. 1Q12 - 1Q14
  • 2. Theme © Tricumen Limited 2014. All rights reserved. 2 / 6 DK / AP / Agentha / 21 July 2014 Revenue variance vs share price performance … How correlated are capital markets revenues with share price performance? In two words – not much: investors reward individual banks’ revenue1 -generating ability. Below, we compare capital markets revenue variance (left hand scale – same data as in the left-hand chart on the first page) against the movement in banks’ period-end share prices for 1, 2, 3 and 4 years (right-hand scale) to the end of June-14. The data suggests that: There is no significant correlation between the two series of data. The share price of Goldman Sachs, the bank with the highest variance in capital markets revenue in this peer group, convincingly outperformed European banks with much more stable earnings. This may be a reflection of European banks’ political and/or regulatory environment as much as (or more than) their financial performance; but Goldman Sachs’ strong share price performance versus US peers also stands in contrast with its volatile revenue. Furthermore, there is no evidence that ‘pure’(r) the investment banks, Goldman Sachs and Morgan Stanley (though the later benefited from its newfound focus on equities and money management), underperformed the more diversified Bank of America Merrill Lynch or Citigroup. Interestingly, even the marketwide concerns about the outlook for FICC revenues over the last 12 months (red dots) did not unduly trouble Goldman Sachs’ share price: in fact, it did slightly better than Citigroup and J.P.Morgan, and was barely behind Bank of America Merrill Lynch. Capital markets revenue variance (LHS, quarterly data 1Q10-1Q14, reverse scale, US$) vs share price performance (RHS) Source: NASDAQ, FT.com, Tricumen revenue analysis. 1 We ran the same analysis against banks’ capital markets profits (instead of revenue), excluding collaboration profits. The result was not meaningfully different, despite significant variation between individual banks’ cost/income ratios. In our view, this shows that investors view revenue as the key driver of profits while cost management is, at best, a short-term play. This was the topic of our 27-Nov-13 note titled ‘Profit Drivers’. 38% -62% -9% -72% 37% 140% -6% -66% -120% -80% -40% 0% 40% 80% 120%-150% -100% -50% 0% 50% 100% 150% BAML BARC Citi CS DBK GS JPM MS Banking + Markets Revenue variance 1Q10-1Q14 Last 1Y Last 2Y Last 3Y Last 4Y Share price performance: period to end-2Q14 (local currency) low revenue volatility high revenue volatility share price increased share price declined
  • 3. Theme © Tricumen Limited 2014. All rights reserved. 3 / 6 DK / AP / Agentha / 21 July 2014 … and share valuations Looking at the market valuation of the banks in this report, two related patterns are evident: Capital markets earnings do seem to carry a significant valuation discount. At end-June-14 and end-June-13 (red dots and orange boxes), the composite P/BV and P/E valuations of Goldman Sachs and J.P.Morgan2 were significantly below their three peers whose earnings are less dependent on a capital markets ‘story’ (Bank of America Merrill Lynch and Citigroup) and/or have made strategic changes to their group-wide franchises that investors approved of (Morgan Stanley). There is also a tangible link between revenue variance and market valuation. For example, Goldman Sachs’ composite P/BV and P/E valuation in two most recent periods was more than 50% below the peer group average (J.P.Morgan is penalised on P/E measure, but had the highest P/BV at end-June-14); while Barclays and Credit Suisse are among the most highly valued stocks overall, especially in more recent periods. Other banks generally fall between these three banks, but the pattern is evident. Also, while the book value calculation does not lend itself readily to adjustments, revenues could be refined – and that would further emphasise the link between revenue variance and valuations. We view P/BV as the more reliable measure of relative value, and have therefore weighted the composite valuation in favour of it. This resulted in a composite valuation that favours US banks: in recent years, investors priced the book value of US banks more highly that that of European banks’. European banks, however, achieved consistently higher P/E valuations. Finally, some might disagree with our favouring P/BV over P/E, and not without reason. The latter could be refined by, for example, weighting capital markets revenue versus the revenue of the Group; and/or the mix of capital market revenue to take account of the exposure to ‘slow’ area of business (for example, FICC). This would, in our view, further highlight the relationship between revenue dynamics and valuations. Capital markets revenue variance (LHS, quarterly data 1Q10-1Q14, reverse scale, US$) vs composite P/BV and P/E valuations (RHS, over/(under) peer group average) Source: NASDAQ, FT.com, Tricumen revenue, profit and book value analysis. Notes: (1) Our calculation of historical price/earnings (P/E) and price/book value (P/BV) ratios, is based on the Group published profit, book value and share count from the financial statements published prior to the valuation date shown. (2) P/E outliers falling outside the 3-standard deviation band for the peer group are excluded. 2 On P/BV measure alone, though, Goldman Sachs and J.P.Morgan were both comfortably ahead of their peers at end-June-14: J.P.Morgan 1.08x, Goldman Sachs 1.06x, Morgan Stanley 1.0x, Bank of America Merrill Lynch 0.75x, Citigroup 0.73x. 38% -62% -9% -72% 37% 140% -6% -66% -120% -80% -40% 0% 40% 80% 120%-150% -100% -50% 0% 50% 100% 150% BAML BARC Citi CS DBK GS JPM MS Banking + Markets Revenue variance 1Q10-1Q14 end-June-14 end-June-13 end-June-12 end-June-11 Composite P/BV and P/E valuations over/(under) peer group average at: low revenue volatility high revenue volatility valuation above peers' valuation below peers'
  • 4. Theme © Tricumen Limited 2014. All rights reserved. 4 / 6 DK / AP / Agentha / 21 July 2014 Appendix 1 – Share price and P/BV Bank of America Merrill Lynch Barclays Citigroup Credit Suisse Deutsche Bank Goldman Sachs J.P.Morgan Morgan Stanley Source: NASDAQ, FT.com, Tricumen book value analysis. 0.2x 0.3x 0.4x 0.5x 0.6x 0.7x 0.8x 0.9x $0 $5 $10 $15 $20 $25 Dec-09 Jun-10 Dec-10 Jun-11 Dec-11 Jun-12 Dec-12 Jun-13 Dec-13 BAC (daily close) P/BV 0.3x 0.4x 0.4x 0.5x 0.5x 0.6x 0.6x 0.7x 0.7x 0.8x 0.8x 100p 150p 200p 250p 300p 350p 400p Dec-09 Jun-10 Dec-10 Jun-11 Dec-11 Jun-12 Dec-12 Jun-13 Dec-13 BARC (daily close) P/BV 0.3x 0.4x 0.5x 0.6x 0.7x 0.8x 0.9x $15 $20 $25 $30 $35 $40 $45 $50 $55 $60 Dec-09 Jun-10 Dec-10 Jun-11 Dec-11 Jun-12 Dec-12 Jun-13 Dec-13 Citi (dailyclose) P/BV Note: Adjusted for 10-1 split in May-11 0.3x 0.5x 0.7x 0.9x 1.1x 1.3x 1.5x CHF10 CHF15 CHF20 CHF25 CHF30 CHF35 CHF40 CHF45 CHF50 CHF55 CHF60 Dec-09 Jun-10 Dec-10 Jun-11 Dec-11 Jun-12 Dec-12 Jun-13 Dec-13 CS (daily close) P/BV 0.2x 0.3x 0.4x 0.5x 0.6x 0.7x 0.8x EUR10 EUR20 EUR30 EUR40 EUR50 EUR60 EUR70 Dec-09 Jun-10 Dec-10 Jun-11 Dec-11 Jun-12 Dec-12 Jun-13 Dec-13 DBK (daily close) P/BV 0.3x 0.4x 0.5x 0.6x 0.7x 0.8x 0.9x 1.0x 1.1x 1.2x $80 $100 $120 $140 $160 $180 $200 Dec-09 Jun-10 Dec-10 Jun-11 Dec-11 Jun-12 Dec-12 Jun-13 Dec-13 GS (daily close) P/BV 0.3x 0.4x 0.5x 0.6x 0.7x 0.8x 0.9x 1.0x 1.1x 1.2x $20 $25 $30 $35 $40 $45 $50 $55 $60 $65 Dec-09 Jun-10 Dec-10 Jun-11 Dec-11 Jun-12 Dec-12 Jun-13 Dec-13 JPM (daily close) P/BV 0.2x 0.3x 0.4x 0.5x 0.6x 0.7x 0.8x $10 $15 $20 $25 $30 $35 Dec-09 Jun-10 Dec-10 Jun-11 Dec-11 Jun-12 Dec-12 Jun-13 Dec-13 MS (daily close) P/BV
  • 5. Theme © Tricumen Limited 2014. All rights reserved. 5 / 6 DK / AP / Agentha / 21 July 2014 Appendix 2 – P/BV dynamics P/BV dynamics (1-Jan-10 – end-June-14) Source: NASDAQ, FT.com, Tricumen book value analysis. 20 40 60 80 100 120 140 160 180 31-Dec-09 31-Mar-10 30-Jun-10 30-Sep-10 31-Dec-10 31-Mar-11 30-Jun-11 30-Sep-11 31-Dec-11 31-Mar-12 30-Jun-12 30-Sep-12 31-Dec-12 31-Mar-13 30-Jun-13 30-Sep-13 31-Dec-13 31-Mar-14 BAC BARC Citi CS DBK GS JPM MS
  • 6. Theme © Tricumen Limited 2014. All rights reserved. 6 / 6 DK / AP / Agentha / 21 July 2014 About Tricumen Tricumen was founded in 2008. It quickly became a strong provider of diversified market intelligence across the capital markets and has since expanded into transaction and corporate banking coverage. Tricumen’s data has been used by many of the world’s leading investment banks as well as strategy consulting firms, investment managers and ‘blue chip’ corporations. Situated near Cambridge in the UK, Tricumen is almost exclusively staffed with senior individuals with an extensive track record of either working for or analysing banks; and boasts what we believe is the largest capital markets-focused research network of its peer group. Caveats No part of this document may be reproduced or transmitted in any form by any means without written permission of Tricumen Limited. Such consent is often given, provided that the information released is sourced to Tricumen and that it does not prejudice Tricumen Limited’s business or compromise the company’s ability to analyse the financial markets. Full acknowledgement of Tricumen Limited must be given. Tricumen Limited has used all reasonable care in writing, editing and presenting the information found in this report. All reasonable effort has been made to ensure the information supplied is accurate and not misleading. For the purposes of cross- market comparison, all numerical data is normalised in accordance to Tricumen Limited’s proprietary product classification. Fully-researched dataset may contain margin of error of 10%; for modelled datasets, this margin may be wider. The information and commentary provided in this report has been compiled for informational purposes only. We recommend that independent advice and enquiries should be sought before acting upon it. Readers should not rely on this information for legal, accounting, investment, or similar purposes. No part of this report constitutes investment advice, any form of recommendation, or a solicitation to buy or sell any instrument or to engage in any trading or investment activity or strategy. Tricumen Limited does not provide investment advice or personal recommendation nor will it be deemed to have done so. Tricumen Limited makes no representation, guarantee or warranty as to the suitability, accuracy or completeness of the report or the information therein. Tricumen Limited assumes no responsibility for information contained in this report and disclaims all liability arising from negligence or otherwise in respect of such information. Tricumen Limited is not liable for any damages arising in contract, tort or otherwise from the use of or inability to use this report or any material contained in it, or from any action or decision taken as a result of using the report. © Tricumen Limited 2014. All rights reserved.