Download as PDF, PPTX

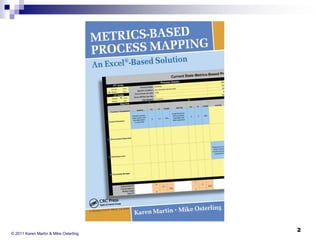
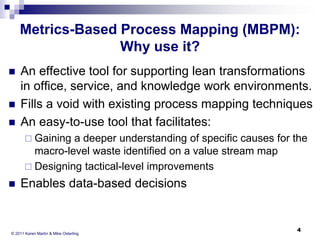
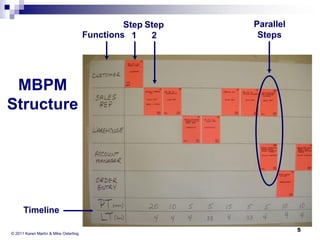
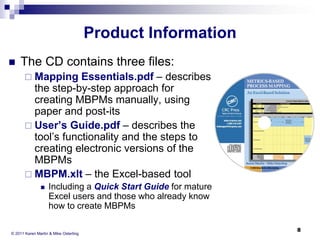
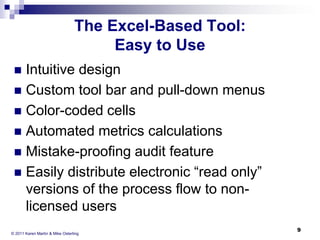
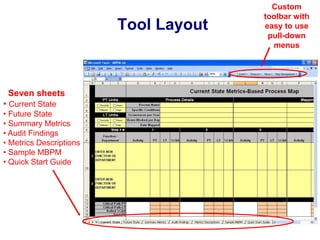
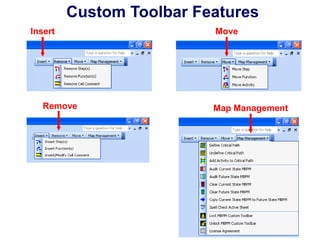
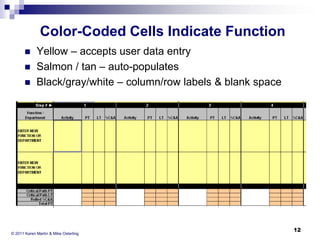
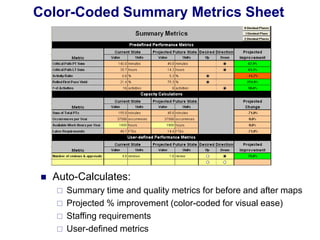
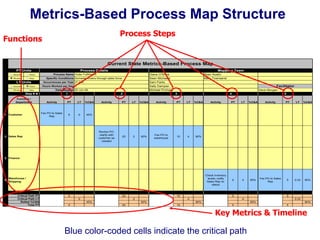
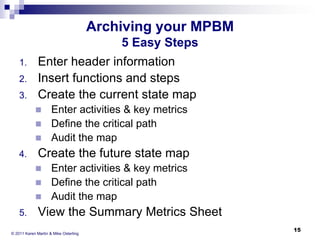
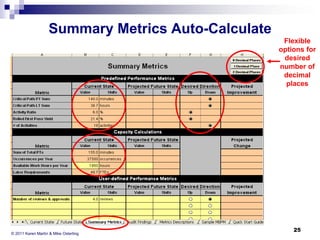
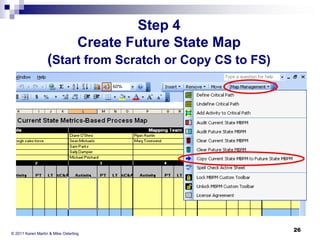
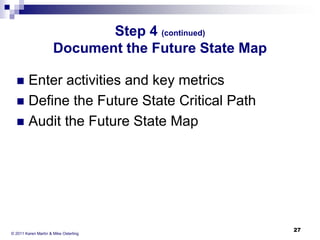
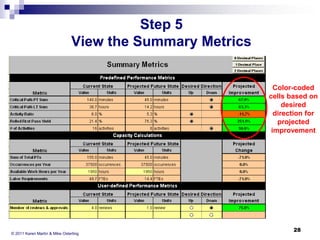
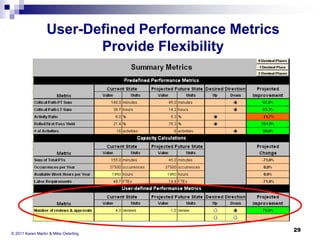

The document outlines a metrics-based process mapping (MBPM) tool designed for office and service processes, aimed at improving performance and facilitating lean transformations. It details the steps for creating MBPMs, including documenting processes, adding key metrics, and identifying waste, while emphasizing the importance of electronic documentation for standardization and monitoring. The included Excel-based tool features a user-friendly design with automated metrics calculations and audit capabilities to streamline the mapping process.