1. CategoricalQuantitative
How many
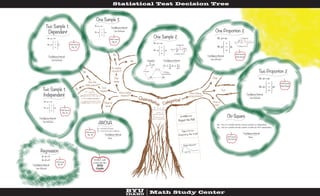
proportions?
One
Two
Three or
more
One Proportion Z
Two Proportion Z
Chi-Square
How many
means?
Is sigma
known?
One
mean
Yes
No
Two
means
Are the
data paired?*
Yes
No
Three or
more
One Sample Z
One Sample t
Two Sample t
Dependent
Two Sample t
Independent
ANOVA
Regression
Ηo :
Ηa :
All means are equal.
At least one mean is different.
Ηo :μd = 0
Ηa :μd
>
<
≠
⎧
⎨
⎪
⎩
⎪
⎫
⎬
⎪
⎭
⎪
0
Ηo :μ1 = μ2
Ηa :μ1
>
<
≠
⎧
⎨
⎪
⎩
⎪
⎫
⎬
⎪
⎭
⎪
μ2
Ηo :μ = μo
Ηa :μ
>
<
≠
⎧
⎨
⎪
⎩
⎪
⎫
⎬
⎪
⎭
⎪
μo
Z =
X − μo
σ
Ηo :p = po
Ηa :p
>
<
≠
⎧
⎨
⎪
⎩
⎪
⎫
⎬
⎪
⎭
⎪
po
Ηo :p1 = p2
Ηa :p1
>
<
≠
⎧
⎨
⎪
⎩
⎪
⎫
⎬
⎪
⎭
⎪
p2
Ηo :
Ηa :
The row variable and the column variable are independent.
The row variable and the column variable are NOT independent.
Ηo :β1 =0
Ηa :β1 ≠0
Ηo :μ = μo
Ηa :μ
>
<
≠
⎧
⎨
⎪
⎩
⎪
⎫
⎬
⎪
⎭
⎪
μo
P-Value
(two tailed)
Are we
measuring or counting?
Is there
a Yes/No question?
Answers are
means or proportions?
Math Study CenterBYU
IDAHO
Statistical Test Decision Tree
X −Z* σ
n
,X +Z* σ
n
⎛
⎝
⎜
⎞
⎠
⎟
Equation Confidence Interval
Z-Score
SPSS Guide
Use Excel
SPSS Guide
Use Excel
SPSS Guide
Use Excel
SPSS Guide
Pg. 8
SPSS Guide
Pg. 11
SPSS Guide
Pg. 16
SPSS Guide
Pg. 34
221B/C ask
a tutor for the
SPSS
Guide
SPSS Guide
Pg. 18
Confidence Interval
None
Confidence Interval
None
Confidence Interval
Use Software
Confidence Interval
Use Software
Confidence Interval
Use Software
Does it make sense to
subtract column 2 from column 1?
p value <α
Reject the Null
Type I Error
Rejecting the truth
Right Skewed
YesNo
Is the test before and after?
*
Do subjects from column 1 have
to match subjects from column 2?
Confidence Interval
Use Software
Confidence Interval
Use Software
Confidence Interval
Use Software
m= z*
σ
n
n=
z*
σ
m
⎛
⎝
⎜
⎞
⎠
⎟
n: Sample Size
m: Margin of Error
m= z*
p 1− p( )
n
n=
z*
m
⎛
⎝
⎜
⎞
⎠
⎟
2
p 1− p( )
n: Sample Size
m: Margin of Error
Median Mean