SlideShare a Scribd company logo
1 of 11
Download to read offline
Genome-scale 13C fluxomics modeling for
metabolic engineering of Saccharomyces cerevisiae
Background
ā€¢ Traditionally, synthetic biology has focused on manipulating a few
genes (e.g., in a single pathway or genetic circuit), but its
combination with systems biology holds the promise of creating
new cellular architectures and constructing complex biological
systems from the ground up.
ā€¢ Enabling this merge of synthetic and systems biology will require
greater predictive capability for modeling the behavior of cellular
systems, and more comprehensive data sets for building and
calibrating these models.
ā€¢ Metabolic fluxes provide a rapid and easy-to-understand picture
of how carbon and energy flow throughout the cell.
Approach
ā€¢ Here, we present a detailed guide to performing metabolic flux
analysis and modeling using the open source JBEI Quantitative
Metabolic Modeling (jQMM) library.
ā€¢ This library allows the user to transform metabolomics data in the
form of isotope labeling data from a 13C labeling experiment into
a determination of cellular fluxes that can be used to develop
genetic engineering strategies for metabolic engineering.
Outcomes and Impacts
ā€¢ We illustrate the use of the jQMM library through a step-by-step
demonstration of flux determination and knockout prediction in a
complex eukaryotic model organism: Saccharomyces cerevisiae.
ā€¢ We use two different methods to predict which gene KOs most
increase ethanol production.
Ando et al. (2018) Chapter 19, MIMB, Humana Press, doi:10.1007/978-1-4939-8757-3_1
Microbial metabolomics: a general overview
Background
ā€¢ In the biosciences, there is growing interest elucidating gene function.
Consequently, metabolomics has garnered a lot of attention due to its
provision of metabolic information pertaining to both function and
phenotype.
ā€¢ This chapter briefly introduces a few important aspects of the
metabolome, the challenges faced when capturing metabolomic
information and the steps that are necessary to overcoming them.
Approach
ā€¢ Metabolomics seeks to measure the low molecular weight chemical
products of enzyme-catalyzed reactions (metabolites) in biological
systems (e.g., cells, compartments, tissues, organisms) at specific
points in time.
Outcomes and Impacts
ā€¢ Metabolites are distinct chemical entities from biochemical
transformations, which complicates both the measurement and data
analysis processes. As a result, there is no single sample preparation
or analytical method that can extract or measure an entire microbial
metabolome.
ā€¢ While nuclear magnetic resonance provides high throughput metabolic
fingerprinting and unambiguous metabolite identification, mass
spectrometry is more popular as it provides quantitative information at
reduced costs.
ā€¢ At present, metabolomics data is more widely applied to human
related studies, followed by plant studies, and then microbiological
studies.
ā€¢ Metabolomics is becoming a key component of systems and synthetic
biology studies, and its application has been extended to microbial
community research.
ā€¢ When metabolomics is part of an integrated multi-omics approach the
data generated can be used to produce accurate predictive models for
systems microbiology and synthetic biology research.
Baidoo et al. (2018) Chapter 1, MIMB, Humana Press, doi:10.1007/978-1-4939-8757-3_1
Mass spectrometry-based microbial metabolomics:
techniques, analysis, and applications
Background
ā€¢ The demand for understanding the roles genes play in biological
systems has steered the biosciences into the direction the
metabolome, as it closely reflects the metabolic activities within a cell.
ā€¢ Mass spectrometry (MS) based metabolomic information is being
used to characterize microbial metabolic networks and has made
significant contributions to microbiological research in the environment
and human disease.
ā€¢ In this chapter, the technical aspects of metabolomics are discussed
and as well as its application to microbiological research.
Approach
ā€¢ Following the quenching of microbial metabolism, metabolites are
extracted (e.g. via liquid-liquid, SPE, SPME, etc.) and preserved for
MS data acquisition and analysis.
Outcomes and Impacts
ā€¢ The chemical diversity within the metabolome has led to the adoption
of targeted metabolite extraction approaches by most laboratories
rather than a universally applied method.
ā€¢ The acquisition of high resolution accurate MS (e.g. TOF and orbitrap)
data provides qualitative and quantitative information, with a targeted
metabolomics approach being favored by most research laboratories.
ā€¢ Quantitative metabolomic information is easily obtained when
chromatographic and electrophoretic separation is coupled to MS.
ā€¢ Metabolomics techniques are applied to metabolic flux analyses,
systems and synthetic biology, environmental microbiology (e.g.
microbial community studies), and human disease.
ā€¢ While the scientific community is willing to put significant resources
behind ā€˜omicsā€™ approaches, the quality of metabolomics data going
forward will determine the role it will play in future microbiological
research.
Baidoo et al. (2019) Chapter 2, MIMB, Humana Press, doi:10.1007/978-1-4939-8757-3_2
Probabilistic lifecycle assessment of butanol
production from corn stover using different
pretreatment methods
Background
ā€¢ Studies on cellulosic butanol have only considered sulfuric acid
pretreatment process and many of these studies present deterministic
results.
ā€¢ This study seeks to bridge the research and modeling gaps by
developing stochastic process model integrating feedstock supply
logistics and the downstream butanol production process, and
considering the five most commonly considered biomass
deconstruction methods (e.g., steam explosion, sulfuric acid, ammonia
fiber explosion [AFEX], ionic liquid [IL] and biological)
Approach
ā€¢ We developed stochastic lifecycle assessment models and
determined lifecycle energy use and greenhouse gas emissions.
ā€¢ We demonstrated performance targets for future research.
Outcomes and Impacts
ā€¢ Probabilistic results of these analyses describe a distribution of GHG
emissions with an average of 18.09-1056.12 gCO2e/MJ and a 95%
certainty to be less than 33.3-1888.3 gCO2e /MJ.
ā€¢ The highest GHG emissions of IL-pretreatment of 1056.12 gCO2e/MJ
reaches to 89.8 gCO2e/MJ by switching IL-recovery from 80 to 99 wt%,
which is the most influencing parameter for IL-pretreatment.
ā€¢ We propose alternative ionic liquid (IL) including cholinium lysinate
and triethylammonium hydrogen sulfate, as these ILs could reduce the
carbon footprint of IL-based biomass deconstruction process.
ā€¢ When the influential inputs can be optimized, many of these
pretreatment methods can be used to realize GHG emissions and net
energy reduction goals.
Baral et al. (2018) Environ. Sci. Technol., doi: 10.1021/acs.est.8b05176
Model metabolic strategy for heterotrophic bacteria in
the cold ocean based on Colwellia psychrerythraea 34H
Background
ā€¢ Colwellia psychrerythraea 34H is a model psychrophilic
extremophile bacterium (unable to grow above 18 ļ‚°C) found in the
cold oceanā€”polar sediments, sea ice, and the deep sea.
ā€¢ Genomic studies of 34H and other strains of C. psychrerythraea
have revealed many metabolic pathways that are important in the
geochemical cycling of nutrients in cold marine environments (e.g.
degradation of components of natural gas).
ā€¢ Although the genomes of such psychrophiles have been sequenced,
their metabolic strategies at low temperature have not been
quantified.
Approach
ā€¢ We measured the metabolic fluxes (using 13C-fingerprinting and 13C-
MFA) and gene expression of 34H at 4 ļ‚°C (the mean global-ocean
temperature and a normal-growth temperature for 34H), making
comparative analyses at room temperature (above its upper-growth
temperature of 18 ļ‚°C) and with mesophilic Escherichia coli.
Outcomes and Impacts
ā€¢ When grown at 4 ļ‚°C, 34H utilized multiple carbon substrates without
catabolite repression or overflow byproducts; its anaplerotic
pathways increased flux network flexibility and enabled CO2 fixation.
ā€¢ In glucose-only medium, the Entnerā€“Doudoroff (ED) pathway was
the primary glycolytic route; in lactate-only medium,
gluconeogenesis and the glyoxylate shunt became active.
ā€¢ Consequently, ED pathway expression levels were much higher than
the upper portion of the (Embdenā€“Meyerhofā€“Parnas) EMP pathway.
ā€¢ Specific findings have relevance to bioremediation of pollutants from
the petroleum industry and to biomanufacturing of cold-adapted
enzymes.
Czajka et al. (2018) PNAS, doi: 10.1073/pnas.1807804115
Metabolic flux map when 34H was grown at 4 ļ‚°C on 1,2-13C glucose (Left) or 3-13C
lactate (Right).
Transcriptomic expression data of 34H at normal-growth conditions and differential
expression data after exposure to temperature-stressed conditions as determined by RNA-
Seq.
Cluster analysis of untargeted
metabolomic experiments
Background
ā€¢ Untargeted metabolite profile data based upon liquid
chromatography-based mass spectrometry (LC-MS)
represents dense biological data.
ā€¢ Cluster analysis, or clustering, is a common technique in
data mining and used in many fields such as machine
learning, data compression and computer graphics.
ā€¢ Here we examine the use of Principal Component Analysis
and Hierarchical Clustering, two common cluster analysis
tools, for digging into multi-dimensional metabolite data.
Approach
ā€¢ Dense data refers to each replicate having hundreds to
thousands of different variables or molecular feature
metabolites, which are represented quantitatively.
ā€¢ Orthogonal transformation is a linear transformation which
preserves a symmetric inner product. In general, an
orthogonal transformation preserves the lengths of vectors
and angles between vectors.
Outcomes and Impacts
ā€¢ PCA can be used to map metabolites by their similarity,
however we are using them to group replicates in our
example. The former results in more of a cloud as there are
thousands of metabolites in the data files.
ā€¢ Unsupervised analysis is much better for getting an objective
view of your data as you do not feed any class information to
the algorithm.
ā€¢ Different values can be given for plot3D variables to allow
you to customize the plot how you like visually.
J. Heinemann (2018) Chapter 16, MIMB, Humana Press, doi:10.1007/978-1-4939-8757-3_11
PCA plots of first three principal components from ten
biological replicates of S. solfataricus before and after H2O2
stress, three variants including (a) media 1 before and after 30
min 100 mM H2O2, (b) Media 1 before and after 30 min 30
Ī¼M H2O2, (c) media 2 before and after 30 min 30 Ī¼M H2O2,
and (d) all experiments combined
Machine learning in untargeted
metabolomics experiments
Background
ā€¢ Machine learning (ML) is a form of artificial intelligence (AI)
that provides computers with the ability to learn generally
without being explicitly programmed.
ā€¢ Outputs of machine learning algorithms can be grouped into
classification, regression, clustering, and dimensionality
reduction.
ā€¢ When analyzing untargeted metabolomics data with ML, there
is substantial risk of overfitting because the number of
variables (metabolites) is greater than the number of instances
(replicates), increasing the likelihood that the ML algorithm can
only predict accurately within those data sets.
Approach
ā€¢ Here we examine the use of machine learning for use with
untargeted metabolomics data, when it is appropriate to use,
and questions it can answer.
ā€¢ We provide an example workflow for training and testing a
simple binary classifier, a multiclass classifier and a support
vector machine using the Waikato Environment for Knowledge
Analysis (Weka), a toolkit for machine learning.
Outcomes and Impacts
ā€¢ Cross validation is only possible for supervised learning as the
data categories must be known for the algorithm to run
recursively on all possible splits of the data training versus
testing.
ā€¢ Utilizing the sensitivity of metabolite abundance to stress,
disease and environmental variation makes them the perfect
medium for creating dense biological data suitable for analysis
and further prediction using ML algorithms and workflows.
J. Heinemann (2018) Chapter 17, MIMB, Humana Press, doi:10.1007/978-1-4939-8757-3_11
Metabolomics: a microbial physiology
and metabolism perspective
Background
ā€¢ Metabolism is a complex sequence of reactions that direct
biological functions in living things, and metabolomics enables
simultaneous analysis of metabolic reactions and pathways
involved in these processes.
ā€¢ Unlike genomics, transcriptomics and proteomics that rely on a
finite set of metabolites or subunits, metabolomics evaluates the
total set of metabolites in an organism.
Approach
ā€¢ This review highlights philosophical and scientific considerations
for executing effective metabolic studies.
ā€¢ The importance of growth in metabolic studies is often
understated, but it is the primary cause of most inconsistencies
in these studies.
Outcomes and Impacts
ā€¢ Physiological studies and metabolic prediction require effective
strategy for quantitative metabolite analysis and the accuracy of
metabolomics makes it an ideal analytical tool for these studies.
ā€¢ Metabolomics provides a snapshot of metabolism at any given
moment in an organism, which is further enhanced by the
addition of data from other analytical strategies such as
transcriptomics, proteomics, and biochemical analyses.
ā€¢ In addition to reproducible analytical tools, metabolic prediction
requires fundamental understanding of metabolism and
physiology, which is critical for experimental design and data
interpretation.
CJ Joshua (2018) Chapter 3, MIMB, Humana Press, doi:10.1007/978-1-4939-8757-3_1
Central carbon metabolism highlighting classical glycolytic pathways,
tricarboxylic acid pathway, gluconeogenesis (blue lines), glyoxylate shunt
(green lines), glycerol-3-phosphate and pyruvateā€“lactate redox shuttle
pathways (gray boxes).
Recent advances in x-ray hydroxyl radical footprinting at
the Advanced Light Source synchrotron
Outcomes and Impacts
ā€¢ Figure 1 compares the dose response curves and total ion chromatograph mass
spectrometry results from a focused vs. an unfocused white-light bend magnet
source at the ALS. More damage was observed for the N-terminal portion of the
protein using 50 msec exposure as opposed to 0.6 msecs.
ā€¢ Initial ā€œdrop-on-demandā€ experiments were conducted using a Canon XS40HS
camera to manually analyze color in 500 Āµm droplets falling through a ~4mm wide
visible light beam (Figure 2). The change in color due to decreasing concentration
of Alex488 dye, is correlated to increasing damage from an X-ray beam.
ā€¢ An advantage of the ā€œdrop-on-demandā€ and real time color monitoring technology
is that it only requires 10-20 Āµl of sample per dose response point.
ā€¢ Preliminary ā€œdrop-on-demandā€ experiments have demonstrated that high flux
density combined with container-less sample presentation to the X-ray beam
enable high-dose HRF experiments, which in turn yield high quality data.
Morton et al. (2018) Protein Pept. Lett., doi: 10.2174/0929866526666181128125725
Background
ā€¢ Efforts in the field of synchrotron hydroxyl radical footprinting (HRF) are
progressing rapidly to investigate structural features and conformational changes
of nucleic acids and proteins in the solution state.
ā€¢ Minimizing sample volume is imperative for studies in which multiple samples and
many conditions must be tested. However, as the sample volume decreases, the
relative X-ray dose decreases.
Approach
ā€¢ Here we compare the dose response curves and mass spectrometry results from
a focused vs. an unfocused white-light bend magnet source at the ALS.
ā€¢ We are also developing ā€œdrop-on-demandā€ methodologies to increase the dose
received by the sample while maintaining microsecond exposure times. Figure 1: (Top) Dose response curves for a 40 kDa protein at a focused (left) vs
unfocused (right) white-light bend magnet beamline source at the ALS. Top: comparison
of exposure times necessary for the same amount of modification. Solid lines (red and
black) represent pseudo unimolecular fit using full and first 3 data points respectively.
Solid blue line represents a fit to y=y0+Aexp(-kt). (Bottom) Total ion chromatogram (TIC)
achieved for 0 and maximum dose. More damage was observed for the N-terminal
portion of the protein using 50 msec exposure as opposed to 0.6 msecs.
Figure 2: High-speed camera images of falling drops with various concentrations of
Alexa488 dye (left) and manual colorimetry measurements of the drops (right).
Accelerating the deployment of anaerobic
digestion to meet zero waste goals
Background
ā€¢ Feedstock cost is a significant barrier to the commercialization
of bioenergy technologies.
ā€¢ Mixed municipal organic wastes are challenging to convert, but
also offer the advantage of negative feedstock costs (tipping
fees).
Approach
ā€¢ This feature article explores the key technical and regulatory
barriers to increasing the utilization of mixed municipal
organics, and recommends research directions to address
these challenges.
ā€¢ The article draws from broad experiences across the industry,
literature, and detailed data and operational experiences at a
dry anaerobic digestion facility in San Jose, CA (Zero Waste
Energy Development).
Outcomes and Impacts
ā€¢ Key challenges identified and explored include: (1) Sorting
technologies and practices to minimize feedstock
contamination, (2) Predicting biogas yields and composition
from mixed waste streams, (3) Mitigating air pollution to
comply with local regulations and avoid odor complaints, (4)
Maximizing the economic value of energy outputs, (5)
Maximizing the net climate benefits of anaerobic digestion and
coproducts
ā€¢ Many of these challenges are broadly applicable to bioenergy
systems beyond anaerobic digestion
Satchwell et al. (2018) Environ. Sci. Technol., doi: 10.1021/acs.est.8b04481)
Liquid chromatography and mass spectrometry
analysis of isoprenoid intermediates in Escherichia coli
Background
ā€¢ Isoprenoids are a highly diverse group of natural products with broad
application as high value chemicals and advanced biofuels.
ā€¢ However, the measurement of isoprenoid intermediates via standard
liquid chromatography-mass spectrometry (LC-MS) protocols is
challenging due to their hydrophilicity and complex physicochemical
properties.
ā€¢ Here we describe a robust hydrophilic interaction liquid
chromatography time-of-flight mass spectrometry (HILIC-TOF-MS)
method for analyzing isoprenoid intermediates from metabolically
engineered Escherichia coli strains.
Approach
ā€¢ HILIC separation was mediated by hydrogen bonding between the
analyte and LC stationary phase.
ā€¢ HILIC separation was coupled to TOF-MS via electrospray ionization
and analytes were detected via high resolution accurate mass
measurements of deprotonated ion adducts.
ā€¢ Following metabolite extraction from Escherichia coli biomass,
isoprenoid intermediates were quantified by HILIC-TOF-MS.
Outcomes and Impacts
ā€¢ The HILIC-TOF-MS method was able to resolve all but two of the
isoprenoid intermediates tested (i.e., IPP/DMAPP).
ā€¢ The method was used to identify pathway bottlenecks in engineered
Escherichia coli by observing the accumulation of intermediate
metabolites (which may have occurred due to reduced activity of the
proceeding enzyme(s)).
ā€¢ The method can also be used to monitor dephosphorylated pathway
intermediates (e.g., IP/DMAP and FP), sugars, nucleotide cofactors,
and central carbon metabolites of the glycolysis pathway and the
tricarboxylic acid (TCA) cycle.
Baidoo et al. (2018) Chapter 11, MIMB, Humana Press, doi:10.1007/978-1-4939-8757-3_11

More Related Content

What's hot

JBEI Research Highlights November 2016
JBEI Research Highlights November 2016JBEI Research Highlights November 2016
JBEI Research Highlights November 2016Irina Silva
Ā 
JBEI January 2021 Research Highlights
JBEI January 2021 Research HighlightsJBEI January 2021 Research Highlights
JBEI January 2021 Research HighlightsSaraHarmon4
Ā 
JBEI highlights March 2016
JBEI highlights March 2016JBEI highlights March 2016
JBEI highlights March 2016Irina Silva
Ā 
JBEI Research Highlights - November 2017
JBEI Research Highlights - November 2017 JBEI Research Highlights - November 2017
JBEI Research Highlights - November 2017 Irina Silva
Ā 
JBEI Research Highlights - March 2018
JBEI Research Highlights - March 2018JBEI Research Highlights - March 2018
JBEI Research Highlights - March 2018Irina Silva
Ā 
JBEI Highlights - October 2014
JBEI Highlights - October 2014JBEI Highlights - October 2014
JBEI Highlights - October 2014Irina Silva
Ā 
JBEI Research Highlights - June 2018
JBEI Research Highlights - June 2018JBEI Research Highlights - June 2018
JBEI Research Highlights - June 2018Irina Silva
Ā 
JBEI Research Highlights - March 2017
JBEI Research Highlights - March 2017JBEI Research Highlights - March 2017
JBEI Research Highlights - March 2017Irina Silva
Ā 
JBEI Research Highlights - May 2018
JBEI Research Highlights - May 2018  JBEI Research Highlights - May 2018
JBEI Research Highlights - May 2018 Irina Silva
Ā 
JBEI Research Highlights - May 207
JBEI Research Highlights - May 207JBEI Research Highlights - May 207
JBEI Research Highlights - May 207Irina Silva
Ā 
JBEI Highlights March 2020
JBEI Highlights March 2020JBEI Highlights March 2020
JBEI Highlights March 2020LeahFreemanSloan
Ā 
JBEI Research Highlights - August 2018
JBEI Research Highlights - August 2018JBEI Research Highlights - August 2018
JBEI Research Highlights - August 2018Irina Silva
Ā 
June 2021 - JBEI Research Highlights
June 2021 - JBEI Research HighlightsJune 2021 - JBEI Research Highlights
June 2021 - JBEI Research HighlightsSaraHarmon4
Ā 
JBEI October 2019 highlights
JBEI October 2019 highlightsJBEI October 2019 highlights
JBEI October 2019 highlightsLeahFreemanSloan
Ā 
JBEI Highlights March 2015
JBEI Highlights March 2015JBEI Highlights March 2015
JBEI Highlights March 2015Irina Silva
Ā 
JBEI Highlights August 2015
JBEI Highlights August 2015JBEI Highlights August 2015
JBEI Highlights August 2015Irina Silva
Ā 
JBEI Research Highlights - October 2018
JBEI Research Highlights - October 2018 JBEI Research Highlights - October 2018
JBEI Research Highlights - October 2018 Irina Silva
Ā 
JBEI highlights September 2019
JBEI highlights September 2019JBEI highlights September 2019
JBEI highlights September 2019LeahFreemanSloan
Ā 
JBEI Highlights - July 2014
JBEI Highlights - July 2014JBEI Highlights - July 2014
JBEI Highlights - July 2014Irina Silva
Ā 
JBEI Research Highlights - May 2019
JBEI Research Highlights - May 2019JBEI Research Highlights - May 2019
JBEI Research Highlights - May 2019Irina Silva
Ā 

What's hot (20)

JBEI Research Highlights November 2016
JBEI Research Highlights November 2016JBEI Research Highlights November 2016
JBEI Research Highlights November 2016
Ā 
JBEI January 2021 Research Highlights
JBEI January 2021 Research HighlightsJBEI January 2021 Research Highlights
JBEI January 2021 Research Highlights
Ā 
JBEI highlights March 2016
JBEI highlights March 2016JBEI highlights March 2016
JBEI highlights March 2016
Ā 
JBEI Research Highlights - November 2017
JBEI Research Highlights - November 2017 JBEI Research Highlights - November 2017
JBEI Research Highlights - November 2017
Ā 
JBEI Research Highlights - March 2018
JBEI Research Highlights - March 2018JBEI Research Highlights - March 2018
JBEI Research Highlights - March 2018
Ā 
JBEI Highlights - October 2014
JBEI Highlights - October 2014JBEI Highlights - October 2014
JBEI Highlights - October 2014
Ā 
JBEI Research Highlights - June 2018
JBEI Research Highlights - June 2018JBEI Research Highlights - June 2018
JBEI Research Highlights - June 2018
Ā 
JBEI Research Highlights - March 2017
JBEI Research Highlights - March 2017JBEI Research Highlights - March 2017
JBEI Research Highlights - March 2017
Ā 
JBEI Research Highlights - May 2018
JBEI Research Highlights - May 2018  JBEI Research Highlights - May 2018
JBEI Research Highlights - May 2018
Ā 
JBEI Research Highlights - May 207
JBEI Research Highlights - May 207JBEI Research Highlights - May 207
JBEI Research Highlights - May 207
Ā 
JBEI Highlights March 2020
JBEI Highlights March 2020JBEI Highlights March 2020
JBEI Highlights March 2020
Ā 
JBEI Research Highlights - August 2018
JBEI Research Highlights - August 2018JBEI Research Highlights - August 2018
JBEI Research Highlights - August 2018
Ā 
June 2021 - JBEI Research Highlights
June 2021 - JBEI Research HighlightsJune 2021 - JBEI Research Highlights
June 2021 - JBEI Research Highlights
Ā 
JBEI October 2019 highlights
JBEI October 2019 highlightsJBEI October 2019 highlights
JBEI October 2019 highlights
Ā 
JBEI Highlights March 2015
JBEI Highlights March 2015JBEI Highlights March 2015
JBEI Highlights March 2015
Ā 
JBEI Highlights August 2015
JBEI Highlights August 2015JBEI Highlights August 2015
JBEI Highlights August 2015
Ā 
JBEI Research Highlights - October 2018
JBEI Research Highlights - October 2018 JBEI Research Highlights - October 2018
JBEI Research Highlights - October 2018
Ā 
JBEI highlights September 2019
JBEI highlights September 2019JBEI highlights September 2019
JBEI highlights September 2019
Ā 
JBEI Highlights - July 2014
JBEI Highlights - July 2014JBEI Highlights - July 2014
JBEI Highlights - July 2014
Ā 
JBEI Research Highlights - May 2019
JBEI Research Highlights - May 2019JBEI Research Highlights - May 2019
JBEI Research Highlights - May 2019
Ā 

Similar to JBEI Research Highlights - November 2018

JBEI Research Highlights - March 2022
JBEI Research Highlights - March 2022JBEI Research Highlights - March 2022
JBEI Research Highlights - March 2022SaraHarmon4
Ā 
JBEI July 2020 Highlights
JBEI July 2020 HighlightsJBEI July 2020 Highlights
JBEI July 2020 HighlightsLeahFreemanSloan
Ā 
Metabolic Engineering
Metabolic EngineeringMetabolic Engineering
Metabolic Engineeringp18lsbc8071
Ā 
JBEI Science Highlights - January 2023
JBEI Science Highlights - January 2023JBEI Science Highlights - January 2023
JBEI Science Highlights - January 2023SaraHarmon5
Ā 
JBEI Highlights September 2015
JBEI Highlights September 2015JBEI Highlights September 2015
JBEI Highlights September 2015Irina Silva
Ā 
Project report: Investigating the effect of cellular objectives on genome-sca...
Project report: Investigating the effect of cellular objectives on genome-sca...Project report: Investigating the effect of cellular objectives on genome-sca...
Project report: Investigating the effect of cellular objectives on genome-sca...Jarle Pahr
Ā 
JBEI Highlights June 2020
JBEI Highlights June 2020JBEI Highlights June 2020
JBEI Highlights June 2020LeahFreemanSloan
Ā 
Metabolomics
MetabolomicsMetabolomics
MetabolomicsShreya Ahuja
Ā 
1501 Refocus metabolomics
1501 Refocus metabolomics1501 Refocus metabolomics
1501 Refocus metabolomicsIS-X
Ā 
Systems biology & Approaches of genomics and proteomics
 Systems biology & Approaches of genomics and proteomics Systems biology & Approaches of genomics and proteomics
Systems biology & Approaches of genomics and proteomicssonam786
Ā 
System Modelling and Metabolomics.pptx
System Modelling and Metabolomics.pptxSystem Modelling and Metabolomics.pptx
System Modelling and Metabolomics.pptxMedhavi27
Ā 
Plant metabolomics
Plant metabolomicsPlant metabolomics
Plant metabolomicsfarheen_zafar
Ā 
JBEI September 2020 Highlights
JBEI September 2020 HighlightsJBEI September 2020 Highlights
JBEI September 2020 HighlightsSaraHarmon4
Ā 
NetBioSIG2013-KEYNOTE Stefan Schuster
NetBioSIG2013-KEYNOTE Stefan SchusterNetBioSIG2013-KEYNOTE Stefan Schuster
NetBioSIG2013-KEYNOTE Stefan SchusterAlexander Pico
Ā 
Flux balance analysis
Flux balance analysisFlux balance analysis
Flux balance analysisJyotiBishlay
Ā 

Similar to JBEI Research Highlights - November 2018 (20)

JBEI Research Highlights - March 2022
JBEI Research Highlights - March 2022JBEI Research Highlights - March 2022
JBEI Research Highlights - March 2022
Ā 
Metabolomics
Metabolomics Metabolomics
Metabolomics
Ā 
Metabolomics
MetabolomicsMetabolomics
Metabolomics
Ā 
JBEI July 2020 Highlights
JBEI July 2020 HighlightsJBEI July 2020 Highlights
JBEI July 2020 Highlights
Ā 
Metabolic Engineering
Metabolic EngineeringMetabolic Engineering
Metabolic Engineering
Ā 
JBEI Science Highlights - January 2023
JBEI Science Highlights - January 2023JBEI Science Highlights - January 2023
JBEI Science Highlights - January 2023
Ā 
Metabolomics
MetabolomicsMetabolomics
Metabolomics
Ā 
JBEI Highlights September 2015
JBEI Highlights September 2015JBEI Highlights September 2015
JBEI Highlights September 2015
Ā 
Project report: Investigating the effect of cellular objectives on genome-sca...
Project report: Investigating the effect of cellular objectives on genome-sca...Project report: Investigating the effect of cellular objectives on genome-sca...
Project report: Investigating the effect of cellular objectives on genome-sca...
Ā 
Metabolomics
MetabolomicsMetabolomics
Metabolomics
Ā 
JBEI Highlights June 2020
JBEI Highlights June 2020JBEI Highlights June 2020
JBEI Highlights June 2020
Ā 
Metabolomics
MetabolomicsMetabolomics
Metabolomics
Ā 
1501 Refocus metabolomics
1501 Refocus metabolomics1501 Refocus metabolomics
1501 Refocus metabolomics
Ā 
Systems biology & Approaches of genomics and proteomics
 Systems biology & Approaches of genomics and proteomics Systems biology & Approaches of genomics and proteomics
Systems biology & Approaches of genomics and proteomics
Ā 
System Modelling and Metabolomics.pptx
System Modelling and Metabolomics.pptxSystem Modelling and Metabolomics.pptx
System Modelling and Metabolomics.pptx
Ā 
Plant metabolomics
Plant metabolomicsPlant metabolomics
Plant metabolomics
Ā 
JBEI September 2020 Highlights
JBEI September 2020 HighlightsJBEI September 2020 Highlights
JBEI September 2020 Highlights
Ā 
NetBioSIG2013-KEYNOTE Stefan Schuster
NetBioSIG2013-KEYNOTE Stefan SchusterNetBioSIG2013-KEYNOTE Stefan Schuster
NetBioSIG2013-KEYNOTE Stefan Schuster
Ā 
Flux balance analysis
Flux balance analysisFlux balance analysis
Flux balance analysis
Ā 
Proteomics
ProteomicsProteomics
Proteomics
Ā 

More from Irina Silva

JBEI Research Highlights - March 2019
JBEI Research Highlights - March 2019JBEI Research Highlights - March 2019
JBEI Research Highlights - March 2019Irina Silva
Ā 
JBEI Research Highlights - February 2019
JBEI Research Highlights - February 2019JBEI Research Highlights - February 2019
JBEI Research Highlights - February 2019Irina Silva
Ā 
JBEI Research Highlights - January 2019
JBEI Research Highlights - January 2019JBEI Research Highlights - January 2019
JBEI Research Highlights - January 2019Irina Silva
Ā 
JBEI Research Highlights - December 2018
JBEI Research Highlights - December 2018 JBEI Research Highlights - December 2018
JBEI Research Highlights - December 2018 Irina Silva
Ā 
JBEI Research Highlights - September 2018
JBEI Research Highlights - September 2018 JBEI Research Highlights - September 2018
JBEI Research Highlights - September 2018 Irina Silva
Ā 
JBEI Research Highlights - September 2018
JBEI Research Highlights - September 2018 JBEI Research Highlights - September 2018
JBEI Research Highlights - September 2018 Irina Silva
Ā 
JBEI Research Highlights - July 2018
JBEI Research Highlights - July 2018 JBEI Research Highlights - July 2018
JBEI Research Highlights - July 2018 Irina Silva
Ā 
JBEI Research Highlights - April 2018
JBEI Research Highlights - April 2018JBEI Research Highlights - April 2018
JBEI Research Highlights - April 2018Irina Silva
Ā 
JBEI Research Highlights - February 2018
JBEI Research Highlights - February 2018JBEI Research Highlights - February 2018
JBEI Research Highlights - February 2018Irina Silva
Ā 
JBEI Research Highlights - January 2018
JBEI Research Highlights - January 2018  JBEI Research Highlights - January 2018
JBEI Research Highlights - January 2018 Irina Silva
Ā 
JBEI Research Highlights - December 2017
JBEI Research Highlights - December 2017 JBEI Research Highlights - December 2017
JBEI Research Highlights - December 2017 Irina Silva
Ā 
JBEI Research Highlights - September 2017
JBEI Research Highlights - September 2017 JBEI Research Highlights - September 2017
JBEI Research Highlights - September 2017 Irina Silva
Ā 
JBEI Research Highlights - August 2017
JBEI Research Highlights - August 2017 JBEI Research Highlights - August 2017
JBEI Research Highlights - August 2017 Irina Silva
Ā 
JBEI Research Highlights - February 2017
JBEI Research Highlights - February 2017 JBEI Research Highlights - February 2017
JBEI Research Highlights - February 2017 Irina Silva
Ā 
JBEI Research Highlights - July 2017
JBEI Research Highlights - July 2017 JBEI Research Highlights - July 2017
JBEI Research Highlights - July 2017 Irina Silva
Ā 
JBEI Research Highlights - June 2017
JBEI Research Highlights - June 2017 JBEI Research Highlights - June 2017
JBEI Research Highlights - June 2017 Irina Silva
Ā 
JBEI Research Highlights - April 2017
JBEI Research Highlights - April 2017JBEI Research Highlights - April 2017
JBEI Research Highlights - April 2017Irina Silva
Ā 
JBEI Research Highlights - February 2017
JBEI Research Highlights - February 2017JBEI Research Highlights - February 2017
JBEI Research Highlights - February 2017Irina Silva
Ā 
JBEI Research Highlights - January 2017
JBEI Research Highlights - January 2017JBEI Research Highlights - January 2017
JBEI Research Highlights - January 2017Irina Silva
Ā 

More from Irina Silva (19)

JBEI Research Highlights - March 2019
JBEI Research Highlights - March 2019JBEI Research Highlights - March 2019
JBEI Research Highlights - March 2019
Ā 
JBEI Research Highlights - February 2019
JBEI Research Highlights - February 2019JBEI Research Highlights - February 2019
JBEI Research Highlights - February 2019
Ā 
JBEI Research Highlights - January 2019
JBEI Research Highlights - January 2019JBEI Research Highlights - January 2019
JBEI Research Highlights - January 2019
Ā 
JBEI Research Highlights - December 2018
JBEI Research Highlights - December 2018 JBEI Research Highlights - December 2018
JBEI Research Highlights - December 2018
Ā 
JBEI Research Highlights - September 2018
JBEI Research Highlights - September 2018 JBEI Research Highlights - September 2018
JBEI Research Highlights - September 2018
Ā 
JBEI Research Highlights - September 2018
JBEI Research Highlights - September 2018 JBEI Research Highlights - September 2018
JBEI Research Highlights - September 2018
Ā 
JBEI Research Highlights - July 2018
JBEI Research Highlights - July 2018 JBEI Research Highlights - July 2018
JBEI Research Highlights - July 2018
Ā 
JBEI Research Highlights - April 2018
JBEI Research Highlights - April 2018JBEI Research Highlights - April 2018
JBEI Research Highlights - April 2018
Ā 
JBEI Research Highlights - February 2018
JBEI Research Highlights - February 2018JBEI Research Highlights - February 2018
JBEI Research Highlights - February 2018
Ā 
JBEI Research Highlights - January 2018
JBEI Research Highlights - January 2018  JBEI Research Highlights - January 2018
JBEI Research Highlights - January 2018
Ā 
JBEI Research Highlights - December 2017
JBEI Research Highlights - December 2017 JBEI Research Highlights - December 2017
JBEI Research Highlights - December 2017
Ā 
JBEI Research Highlights - September 2017
JBEI Research Highlights - September 2017 JBEI Research Highlights - September 2017
JBEI Research Highlights - September 2017
Ā 
JBEI Research Highlights - August 2017
JBEI Research Highlights - August 2017 JBEI Research Highlights - August 2017
JBEI Research Highlights - August 2017
Ā 
JBEI Research Highlights - February 2017
JBEI Research Highlights - February 2017 JBEI Research Highlights - February 2017
JBEI Research Highlights - February 2017
Ā 
JBEI Research Highlights - July 2017
JBEI Research Highlights - July 2017 JBEI Research Highlights - July 2017
JBEI Research Highlights - July 2017
Ā 
JBEI Research Highlights - June 2017
JBEI Research Highlights - June 2017 JBEI Research Highlights - June 2017
JBEI Research Highlights - June 2017
Ā 
JBEI Research Highlights - April 2017
JBEI Research Highlights - April 2017JBEI Research Highlights - April 2017
JBEI Research Highlights - April 2017
Ā 
JBEI Research Highlights - February 2017
JBEI Research Highlights - February 2017JBEI Research Highlights - February 2017
JBEI Research Highlights - February 2017
Ā 
JBEI Research Highlights - January 2017
JBEI Research Highlights - January 2017JBEI Research Highlights - January 2017
JBEI Research Highlights - January 2017
Ā 

Recently uploaded

Call Girls in Munirka Delhi šŸ’ÆCall Us šŸ”8264348440šŸ”
Call Girls in Munirka Delhi šŸ’ÆCall Us šŸ”8264348440šŸ”Call Girls in Munirka Delhi šŸ’ÆCall Us šŸ”8264348440šŸ”
Call Girls in Munirka Delhi šŸ’ÆCall Us šŸ”8264348440šŸ”soniya singh
Ā 
Analytical Profile of Coleus Forskohlii | Forskolin .pdf
Analytical Profile of Coleus Forskohlii | Forskolin .pdfAnalytical Profile of Coleus Forskohlii | Forskolin .pdf
Analytical Profile of Coleus Forskohlii | Forskolin .pdfSwapnil Therkar
Ā 
Forest laws, Indian forest laws, why they are important
Forest laws, Indian forest laws, why they are importantForest laws, Indian forest laws, why they are important
Forest laws, Indian forest laws, why they are importantadityabhardwaj282
Ā 
zoogeography of pakistan.pptx fauna of Pakistan
zoogeography of pakistan.pptx fauna of Pakistanzoogeography of pakistan.pptx fauna of Pakistan
zoogeography of pakistan.pptx fauna of Pakistanzohaibmir069
Ā 
Call Girls In Nihal Vihar Delhi ā¤ļø8860477959 Looking Escorts In 24/7 Delhi NCR
Call Girls In Nihal Vihar Delhi ā¤ļø8860477959 Looking Escorts In 24/7 Delhi NCRCall Girls In Nihal Vihar Delhi ā¤ļø8860477959 Looking Escorts In 24/7 Delhi NCR
Call Girls In Nihal Vihar Delhi ā¤ļø8860477959 Looking Escorts In 24/7 Delhi NCRlizamodels9
Ā 
Bentham & Hooker's Classification. along with the merits and demerits of the ...
Bentham & Hooker's Classification. along with the merits and demerits of the ...Bentham & Hooker's Classification. along with the merits and demerits of the ...
Bentham & Hooker's Classification. along with the merits and demerits of the ...Nistarini College, Purulia (W.B) India
Ā 
Welcome to GFDL for Take Your Child To Work Day
Welcome to GFDL for Take Your Child To Work DayWelcome to GFDL for Take Your Child To Work Day
Welcome to GFDL for Take Your Child To Work DayZachary Labe
Ā 
RESPIRATORY ADAPTATIONS TO HYPOXIA IN HUMNAS.pptx
RESPIRATORY ADAPTATIONS TO HYPOXIA IN HUMNAS.pptxRESPIRATORY ADAPTATIONS TO HYPOXIA IN HUMNAS.pptx
RESPIRATORY ADAPTATIONS TO HYPOXIA IN HUMNAS.pptxFarihaAbdulRasheed
Ā 
Artificial Intelligence In Microbiology by Dr. Prince C P
Artificial Intelligence In Microbiology by Dr. Prince C PArtificial Intelligence In Microbiology by Dr. Prince C P
Artificial Intelligence In Microbiology by Dr. Prince C PPRINCE C P
Ā 
SOLUBLE PATTERN RECOGNITION RECEPTORS.pptx
SOLUBLE PATTERN RECOGNITION RECEPTORS.pptxSOLUBLE PATTERN RECOGNITION RECEPTORS.pptx
SOLUBLE PATTERN RECOGNITION RECEPTORS.pptxkessiyaTpeter
Ā 
Transposable elements in prokaryotes.ppt
Transposable elements in prokaryotes.pptTransposable elements in prokaryotes.ppt
Transposable elements in prokaryotes.pptArshadWarsi13
Ā 
Analytical Profile of Coleus Forskohlii | Forskolin .pptx
Analytical Profile of Coleus Forskohlii | Forskolin .pptxAnalytical Profile of Coleus Forskohlii | Forskolin .pptx
Analytical Profile of Coleus Forskohlii | Forskolin .pptxSwapnil Therkar
Ā 
Call Girls in Mayapuri Delhi šŸ’ÆCall Us šŸ”9953322196šŸ” šŸ’ÆEscort.
Call Girls in Mayapuri Delhi šŸ’ÆCall Us šŸ”9953322196šŸ” šŸ’ÆEscort.Call Girls in Mayapuri Delhi šŸ’ÆCall Us šŸ”9953322196šŸ” šŸ’ÆEscort.
Call Girls in Mayapuri Delhi šŸ’ÆCall Us šŸ”9953322196šŸ” šŸ’ÆEscort.aasikanpl
Ā 
Heredity: Inheritance and Variation of Traits
Heredity: Inheritance and Variation of TraitsHeredity: Inheritance and Variation of Traits
Heredity: Inheritance and Variation of TraitsCharlene Llagas
Ā 
Behavioral Disorder: Schizophrenia & it's Case Study.pdf
Behavioral Disorder: Schizophrenia & it's Case Study.pdfBehavioral Disorder: Schizophrenia & it's Case Study.pdf
Behavioral Disorder: Schizophrenia & it's Case Study.pdfSELF-EXPLANATORY
Ā 
Call Girls in Aiims Metro Delhi šŸ’ÆCall Us šŸ”9953322196šŸ” šŸ’ÆEscort.
Call Girls in Aiims Metro Delhi šŸ’ÆCall Us šŸ”9953322196šŸ” šŸ’ÆEscort.Call Girls in Aiims Metro Delhi šŸ’ÆCall Us šŸ”9953322196šŸ” šŸ’ÆEscort.
Call Girls in Aiims Metro Delhi šŸ’ÆCall Us šŸ”9953322196šŸ” šŸ’ÆEscort.aasikanpl
Ā 
Gas_Laws_powerpoint_notes.ppt for grade 10
Gas_Laws_powerpoint_notes.ppt for grade 10Gas_Laws_powerpoint_notes.ppt for grade 10
Gas_Laws_powerpoint_notes.ppt for grade 10ROLANARIBATO3
Ā 
Call Us ā‰½ 9953322196 ā‰¼ Call Girls In Lajpat Nagar (Delhi) |
Call Us ā‰½ 9953322196 ā‰¼ Call Girls In Lajpat Nagar (Delhi) |Call Us ā‰½ 9953322196 ā‰¼ Call Girls In Lajpat Nagar (Delhi) |
Call Us ā‰½ 9953322196 ā‰¼ Call Girls In Lajpat Nagar (Delhi) |aasikanpl
Ā 
Neurodevelopmental disorders according to the dsm 5 tr
Neurodevelopmental disorders according to the dsm 5 trNeurodevelopmental disorders according to the dsm 5 tr
Neurodevelopmental disorders according to the dsm 5 trssuser06f238
Ā 
Volatile Oils Pharmacognosy And Phytochemistry -I
Volatile Oils Pharmacognosy And Phytochemistry -IVolatile Oils Pharmacognosy And Phytochemistry -I
Volatile Oils Pharmacognosy And Phytochemistry -INandakishor Bhaurao Deshmukh
Ā 

Recently uploaded (20)

Call Girls in Munirka Delhi šŸ’ÆCall Us šŸ”8264348440šŸ”
Call Girls in Munirka Delhi šŸ’ÆCall Us šŸ”8264348440šŸ”Call Girls in Munirka Delhi šŸ’ÆCall Us šŸ”8264348440šŸ”
Call Girls in Munirka Delhi šŸ’ÆCall Us šŸ”8264348440šŸ”
Ā 
Analytical Profile of Coleus Forskohlii | Forskolin .pdf
Analytical Profile of Coleus Forskohlii | Forskolin .pdfAnalytical Profile of Coleus Forskohlii | Forskolin .pdf
Analytical Profile of Coleus Forskohlii | Forskolin .pdf
Ā 
Forest laws, Indian forest laws, why they are important
Forest laws, Indian forest laws, why they are importantForest laws, Indian forest laws, why they are important
Forest laws, Indian forest laws, why they are important
Ā 
zoogeography of pakistan.pptx fauna of Pakistan
zoogeography of pakistan.pptx fauna of Pakistanzoogeography of pakistan.pptx fauna of Pakistan
zoogeography of pakistan.pptx fauna of Pakistan
Ā 
Call Girls In Nihal Vihar Delhi ā¤ļø8860477959 Looking Escorts In 24/7 Delhi NCR
Call Girls In Nihal Vihar Delhi ā¤ļø8860477959 Looking Escorts In 24/7 Delhi NCRCall Girls In Nihal Vihar Delhi ā¤ļø8860477959 Looking Escorts In 24/7 Delhi NCR
Call Girls In Nihal Vihar Delhi ā¤ļø8860477959 Looking Escorts In 24/7 Delhi NCR
Ā 
Bentham & Hooker's Classification. along with the merits and demerits of the ...
Bentham & Hooker's Classification. along with the merits and demerits of the ...Bentham & Hooker's Classification. along with the merits and demerits of the ...
Bentham & Hooker's Classification. along with the merits and demerits of the ...
Ā 
Welcome to GFDL for Take Your Child To Work Day
Welcome to GFDL for Take Your Child To Work DayWelcome to GFDL for Take Your Child To Work Day
Welcome to GFDL for Take Your Child To Work Day
Ā 
RESPIRATORY ADAPTATIONS TO HYPOXIA IN HUMNAS.pptx
RESPIRATORY ADAPTATIONS TO HYPOXIA IN HUMNAS.pptxRESPIRATORY ADAPTATIONS TO HYPOXIA IN HUMNAS.pptx
RESPIRATORY ADAPTATIONS TO HYPOXIA IN HUMNAS.pptx
Ā 
Artificial Intelligence In Microbiology by Dr. Prince C P
Artificial Intelligence In Microbiology by Dr. Prince C PArtificial Intelligence In Microbiology by Dr. Prince C P
Artificial Intelligence In Microbiology by Dr. Prince C P
Ā 
SOLUBLE PATTERN RECOGNITION RECEPTORS.pptx
SOLUBLE PATTERN RECOGNITION RECEPTORS.pptxSOLUBLE PATTERN RECOGNITION RECEPTORS.pptx
SOLUBLE PATTERN RECOGNITION RECEPTORS.pptx
Ā 
Transposable elements in prokaryotes.ppt
Transposable elements in prokaryotes.pptTransposable elements in prokaryotes.ppt
Transposable elements in prokaryotes.ppt
Ā 
Analytical Profile of Coleus Forskohlii | Forskolin .pptx
Analytical Profile of Coleus Forskohlii | Forskolin .pptxAnalytical Profile of Coleus Forskohlii | Forskolin .pptx
Analytical Profile of Coleus Forskohlii | Forskolin .pptx
Ā 
Call Girls in Mayapuri Delhi šŸ’ÆCall Us šŸ”9953322196šŸ” šŸ’ÆEscort.
Call Girls in Mayapuri Delhi šŸ’ÆCall Us šŸ”9953322196šŸ” šŸ’ÆEscort.Call Girls in Mayapuri Delhi šŸ’ÆCall Us šŸ”9953322196šŸ” šŸ’ÆEscort.
Call Girls in Mayapuri Delhi šŸ’ÆCall Us šŸ”9953322196šŸ” šŸ’ÆEscort.
Ā 
Heredity: Inheritance and Variation of Traits
Heredity: Inheritance and Variation of TraitsHeredity: Inheritance and Variation of Traits
Heredity: Inheritance and Variation of Traits
Ā 
Behavioral Disorder: Schizophrenia & it's Case Study.pdf
Behavioral Disorder: Schizophrenia & it's Case Study.pdfBehavioral Disorder: Schizophrenia & it's Case Study.pdf
Behavioral Disorder: Schizophrenia & it's Case Study.pdf
Ā 
Call Girls in Aiims Metro Delhi šŸ’ÆCall Us šŸ”9953322196šŸ” šŸ’ÆEscort.
Call Girls in Aiims Metro Delhi šŸ’ÆCall Us šŸ”9953322196šŸ” šŸ’ÆEscort.Call Girls in Aiims Metro Delhi šŸ’ÆCall Us šŸ”9953322196šŸ” šŸ’ÆEscort.
Call Girls in Aiims Metro Delhi šŸ’ÆCall Us šŸ”9953322196šŸ” šŸ’ÆEscort.
Ā 
Gas_Laws_powerpoint_notes.ppt for grade 10
Gas_Laws_powerpoint_notes.ppt for grade 10Gas_Laws_powerpoint_notes.ppt for grade 10
Gas_Laws_powerpoint_notes.ppt for grade 10
Ā 
Call Us ā‰½ 9953322196 ā‰¼ Call Girls In Lajpat Nagar (Delhi) |
Call Us ā‰½ 9953322196 ā‰¼ Call Girls In Lajpat Nagar (Delhi) |Call Us ā‰½ 9953322196 ā‰¼ Call Girls In Lajpat Nagar (Delhi) |
Call Us ā‰½ 9953322196 ā‰¼ Call Girls In Lajpat Nagar (Delhi) |
Ā 
Neurodevelopmental disorders according to the dsm 5 tr
Neurodevelopmental disorders according to the dsm 5 trNeurodevelopmental disorders according to the dsm 5 tr
Neurodevelopmental disorders according to the dsm 5 tr
Ā 
Volatile Oils Pharmacognosy And Phytochemistry -I
Volatile Oils Pharmacognosy And Phytochemistry -IVolatile Oils Pharmacognosy And Phytochemistry -I
Volatile Oils Pharmacognosy And Phytochemistry -I
Ā 

JBEI Research Highlights - November 2018

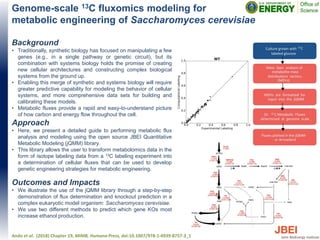
  • 1. Genome-scale 13C fluxomics modeling for metabolic engineering of Saccharomyces cerevisiae Background ā€¢ Traditionally, synthetic biology has focused on manipulating a few genes (e.g., in a single pathway or genetic circuit), but its combination with systems biology holds the promise of creating new cellular architectures and constructing complex biological systems from the ground up. ā€¢ Enabling this merge of synthetic and systems biology will require greater predictive capability for modeling the behavior of cellular systems, and more comprehensive data sets for building and calibrating these models. ā€¢ Metabolic fluxes provide a rapid and easy-to-understand picture of how carbon and energy flow throughout the cell. Approach ā€¢ Here, we present a detailed guide to performing metabolic flux analysis and modeling using the open source JBEI Quantitative Metabolic Modeling (jQMM) library. ā€¢ This library allows the user to transform metabolomics data in the form of isotope labeling data from a 13C labeling experiment into a determination of cellular fluxes that can be used to develop genetic engineering strategies for metabolic engineering. Outcomes and Impacts ā€¢ We illustrate the use of the jQMM library through a step-by-step demonstration of flux determination and knockout prediction in a complex eukaryotic model organism: Saccharomyces cerevisiae. ā€¢ We use two different methods to predict which gene KOs most increase ethanol production. Ando et al. (2018) Chapter 19, MIMB, Humana Press, doi:10.1007/978-1-4939-8757-3_1
  • 2. Microbial metabolomics: a general overview Background ā€¢ In the biosciences, there is growing interest elucidating gene function. Consequently, metabolomics has garnered a lot of attention due to its provision of metabolic information pertaining to both function and phenotype. ā€¢ This chapter briefly introduces a few important aspects of the metabolome, the challenges faced when capturing metabolomic information and the steps that are necessary to overcoming them. Approach ā€¢ Metabolomics seeks to measure the low molecular weight chemical products of enzyme-catalyzed reactions (metabolites) in biological systems (e.g., cells, compartments, tissues, organisms) at specific points in time. Outcomes and Impacts ā€¢ Metabolites are distinct chemical entities from biochemical transformations, which complicates both the measurement and data analysis processes. As a result, there is no single sample preparation or analytical method that can extract or measure an entire microbial metabolome. ā€¢ While nuclear magnetic resonance provides high throughput metabolic fingerprinting and unambiguous metabolite identification, mass spectrometry is more popular as it provides quantitative information at reduced costs. ā€¢ At present, metabolomics data is more widely applied to human related studies, followed by plant studies, and then microbiological studies. ā€¢ Metabolomics is becoming a key component of systems and synthetic biology studies, and its application has been extended to microbial community research. ā€¢ When metabolomics is part of an integrated multi-omics approach the data generated can be used to produce accurate predictive models for systems microbiology and synthetic biology research. Baidoo et al. (2018) Chapter 1, MIMB, Humana Press, doi:10.1007/978-1-4939-8757-3_1
  • 3. Mass spectrometry-based microbial metabolomics: techniques, analysis, and applications Background ā€¢ The demand for understanding the roles genes play in biological systems has steered the biosciences into the direction the metabolome, as it closely reflects the metabolic activities within a cell. ā€¢ Mass spectrometry (MS) based metabolomic information is being used to characterize microbial metabolic networks and has made significant contributions to microbiological research in the environment and human disease. ā€¢ In this chapter, the technical aspects of metabolomics are discussed and as well as its application to microbiological research. Approach ā€¢ Following the quenching of microbial metabolism, metabolites are extracted (e.g. via liquid-liquid, SPE, SPME, etc.) and preserved for MS data acquisition and analysis. Outcomes and Impacts ā€¢ The chemical diversity within the metabolome has led to the adoption of targeted metabolite extraction approaches by most laboratories rather than a universally applied method. ā€¢ The acquisition of high resolution accurate MS (e.g. TOF and orbitrap) data provides qualitative and quantitative information, with a targeted metabolomics approach being favored by most research laboratories. ā€¢ Quantitative metabolomic information is easily obtained when chromatographic and electrophoretic separation is coupled to MS. ā€¢ Metabolomics techniques are applied to metabolic flux analyses, systems and synthetic biology, environmental microbiology (e.g. microbial community studies), and human disease. ā€¢ While the scientific community is willing to put significant resources behind ā€˜omicsā€™ approaches, the quality of metabolomics data going forward will determine the role it will play in future microbiological research. Baidoo et al. (2019) Chapter 2, MIMB, Humana Press, doi:10.1007/978-1-4939-8757-3_2
  • 4. Probabilistic lifecycle assessment of butanol production from corn stover using different pretreatment methods Background ā€¢ Studies on cellulosic butanol have only considered sulfuric acid pretreatment process and many of these studies present deterministic results. ā€¢ This study seeks to bridge the research and modeling gaps by developing stochastic process model integrating feedstock supply logistics and the downstream butanol production process, and considering the five most commonly considered biomass deconstruction methods (e.g., steam explosion, sulfuric acid, ammonia fiber explosion [AFEX], ionic liquid [IL] and biological) Approach ā€¢ We developed stochastic lifecycle assessment models and determined lifecycle energy use and greenhouse gas emissions. ā€¢ We demonstrated performance targets for future research. Outcomes and Impacts ā€¢ Probabilistic results of these analyses describe a distribution of GHG emissions with an average of 18.09-1056.12 gCO2e/MJ and a 95% certainty to be less than 33.3-1888.3 gCO2e /MJ. ā€¢ The highest GHG emissions of IL-pretreatment of 1056.12 gCO2e/MJ reaches to 89.8 gCO2e/MJ by switching IL-recovery from 80 to 99 wt%, which is the most influencing parameter for IL-pretreatment. ā€¢ We propose alternative ionic liquid (IL) including cholinium lysinate and triethylammonium hydrogen sulfate, as these ILs could reduce the carbon footprint of IL-based biomass deconstruction process. ā€¢ When the influential inputs can be optimized, many of these pretreatment methods can be used to realize GHG emissions and net energy reduction goals. Baral et al. (2018) Environ. Sci. Technol., doi: 10.1021/acs.est.8b05176
  • 5. Model metabolic strategy for heterotrophic bacteria in the cold ocean based on Colwellia psychrerythraea 34H Background ā€¢ Colwellia psychrerythraea 34H is a model psychrophilic extremophile bacterium (unable to grow above 18 ļ‚°C) found in the cold oceanā€”polar sediments, sea ice, and the deep sea. ā€¢ Genomic studies of 34H and other strains of C. psychrerythraea have revealed many metabolic pathways that are important in the geochemical cycling of nutrients in cold marine environments (e.g. degradation of components of natural gas). ā€¢ Although the genomes of such psychrophiles have been sequenced, their metabolic strategies at low temperature have not been quantified. Approach ā€¢ We measured the metabolic fluxes (using 13C-fingerprinting and 13C- MFA) and gene expression of 34H at 4 ļ‚°C (the mean global-ocean temperature and a normal-growth temperature for 34H), making comparative analyses at room temperature (above its upper-growth temperature of 18 ļ‚°C) and with mesophilic Escherichia coli. Outcomes and Impacts ā€¢ When grown at 4 ļ‚°C, 34H utilized multiple carbon substrates without catabolite repression or overflow byproducts; its anaplerotic pathways increased flux network flexibility and enabled CO2 fixation. ā€¢ In glucose-only medium, the Entnerā€“Doudoroff (ED) pathway was the primary glycolytic route; in lactate-only medium, gluconeogenesis and the glyoxylate shunt became active. ā€¢ Consequently, ED pathway expression levels were much higher than the upper portion of the (Embdenā€“Meyerhofā€“Parnas) EMP pathway. ā€¢ Specific findings have relevance to bioremediation of pollutants from the petroleum industry and to biomanufacturing of cold-adapted enzymes. Czajka et al. (2018) PNAS, doi: 10.1073/pnas.1807804115 Metabolic flux map when 34H was grown at 4 ļ‚°C on 1,2-13C glucose (Left) or 3-13C lactate (Right). Transcriptomic expression data of 34H at normal-growth conditions and differential expression data after exposure to temperature-stressed conditions as determined by RNA- Seq.
  • 6. Cluster analysis of untargeted metabolomic experiments Background ā€¢ Untargeted metabolite profile data based upon liquid chromatography-based mass spectrometry (LC-MS) represents dense biological data. ā€¢ Cluster analysis, or clustering, is a common technique in data mining and used in many fields such as machine learning, data compression and computer graphics. ā€¢ Here we examine the use of Principal Component Analysis and Hierarchical Clustering, two common cluster analysis tools, for digging into multi-dimensional metabolite data. Approach ā€¢ Dense data refers to each replicate having hundreds to thousands of different variables or molecular feature metabolites, which are represented quantitatively. ā€¢ Orthogonal transformation is a linear transformation which preserves a symmetric inner product. In general, an orthogonal transformation preserves the lengths of vectors and angles between vectors. Outcomes and Impacts ā€¢ PCA can be used to map metabolites by their similarity, however we are using them to group replicates in our example. The former results in more of a cloud as there are thousands of metabolites in the data files. ā€¢ Unsupervised analysis is much better for getting an objective view of your data as you do not feed any class information to the algorithm. ā€¢ Different values can be given for plot3D variables to allow you to customize the plot how you like visually. J. Heinemann (2018) Chapter 16, MIMB, Humana Press, doi:10.1007/978-1-4939-8757-3_11 PCA plots of first three principal components from ten biological replicates of S. solfataricus before and after H2O2 stress, three variants including (a) media 1 before and after 30 min 100 mM H2O2, (b) Media 1 before and after 30 min 30 Ī¼M H2O2, (c) media 2 before and after 30 min 30 Ī¼M H2O2, and (d) all experiments combined
  • 7. Machine learning in untargeted metabolomics experiments Background ā€¢ Machine learning (ML) is a form of artificial intelligence (AI) that provides computers with the ability to learn generally without being explicitly programmed. ā€¢ Outputs of machine learning algorithms can be grouped into classification, regression, clustering, and dimensionality reduction. ā€¢ When analyzing untargeted metabolomics data with ML, there is substantial risk of overfitting because the number of variables (metabolites) is greater than the number of instances (replicates), increasing the likelihood that the ML algorithm can only predict accurately within those data sets. Approach ā€¢ Here we examine the use of machine learning for use with untargeted metabolomics data, when it is appropriate to use, and questions it can answer. ā€¢ We provide an example workflow for training and testing a simple binary classifier, a multiclass classifier and a support vector machine using the Waikato Environment for Knowledge Analysis (Weka), a toolkit for machine learning. Outcomes and Impacts ā€¢ Cross validation is only possible for supervised learning as the data categories must be known for the algorithm to run recursively on all possible splits of the data training versus testing. ā€¢ Utilizing the sensitivity of metabolite abundance to stress, disease and environmental variation makes them the perfect medium for creating dense biological data suitable for analysis and further prediction using ML algorithms and workflows. J. Heinemann (2018) Chapter 17, MIMB, Humana Press, doi:10.1007/978-1-4939-8757-3_11
  • 8. Metabolomics: a microbial physiology and metabolism perspective Background ā€¢ Metabolism is a complex sequence of reactions that direct biological functions in living things, and metabolomics enables simultaneous analysis of metabolic reactions and pathways involved in these processes. ā€¢ Unlike genomics, transcriptomics and proteomics that rely on a finite set of metabolites or subunits, metabolomics evaluates the total set of metabolites in an organism. Approach ā€¢ This review highlights philosophical and scientific considerations for executing effective metabolic studies. ā€¢ The importance of growth in metabolic studies is often understated, but it is the primary cause of most inconsistencies in these studies. Outcomes and Impacts ā€¢ Physiological studies and metabolic prediction require effective strategy for quantitative metabolite analysis and the accuracy of metabolomics makes it an ideal analytical tool for these studies. ā€¢ Metabolomics provides a snapshot of metabolism at any given moment in an organism, which is further enhanced by the addition of data from other analytical strategies such as transcriptomics, proteomics, and biochemical analyses. ā€¢ In addition to reproducible analytical tools, metabolic prediction requires fundamental understanding of metabolism and physiology, which is critical for experimental design and data interpretation. CJ Joshua (2018) Chapter 3, MIMB, Humana Press, doi:10.1007/978-1-4939-8757-3_1 Central carbon metabolism highlighting classical glycolytic pathways, tricarboxylic acid pathway, gluconeogenesis (blue lines), glyoxylate shunt (green lines), glycerol-3-phosphate and pyruvateā€“lactate redox shuttle pathways (gray boxes).
  • 9. Recent advances in x-ray hydroxyl radical footprinting at the Advanced Light Source synchrotron Outcomes and Impacts ā€¢ Figure 1 compares the dose response curves and total ion chromatograph mass spectrometry results from a focused vs. an unfocused white-light bend magnet source at the ALS. More damage was observed for the N-terminal portion of the protein using 50 msec exposure as opposed to 0.6 msecs. ā€¢ Initial ā€œdrop-on-demandā€ experiments were conducted using a Canon XS40HS camera to manually analyze color in 500 Āµm droplets falling through a ~4mm wide visible light beam (Figure 2). The change in color due to decreasing concentration of Alex488 dye, is correlated to increasing damage from an X-ray beam. ā€¢ An advantage of the ā€œdrop-on-demandā€ and real time color monitoring technology is that it only requires 10-20 Āµl of sample per dose response point. ā€¢ Preliminary ā€œdrop-on-demandā€ experiments have demonstrated that high flux density combined with container-less sample presentation to the X-ray beam enable high-dose HRF experiments, which in turn yield high quality data. Morton et al. (2018) Protein Pept. Lett., doi: 10.2174/0929866526666181128125725 Background ā€¢ Efforts in the field of synchrotron hydroxyl radical footprinting (HRF) are progressing rapidly to investigate structural features and conformational changes of nucleic acids and proteins in the solution state. ā€¢ Minimizing sample volume is imperative for studies in which multiple samples and many conditions must be tested. However, as the sample volume decreases, the relative X-ray dose decreases. Approach ā€¢ Here we compare the dose response curves and mass spectrometry results from a focused vs. an unfocused white-light bend magnet source at the ALS. ā€¢ We are also developing ā€œdrop-on-demandā€ methodologies to increase the dose received by the sample while maintaining microsecond exposure times. Figure 1: (Top) Dose response curves for a 40 kDa protein at a focused (left) vs unfocused (right) white-light bend magnet beamline source at the ALS. Top: comparison of exposure times necessary for the same amount of modification. Solid lines (red and black) represent pseudo unimolecular fit using full and first 3 data points respectively. Solid blue line represents a fit to y=y0+Aexp(-kt). (Bottom) Total ion chromatogram (TIC) achieved for 0 and maximum dose. More damage was observed for the N-terminal portion of the protein using 50 msec exposure as opposed to 0.6 msecs. Figure 2: High-speed camera images of falling drops with various concentrations of Alexa488 dye (left) and manual colorimetry measurements of the drops (right).
  • 10. Accelerating the deployment of anaerobic digestion to meet zero waste goals Background ā€¢ Feedstock cost is a significant barrier to the commercialization of bioenergy technologies. ā€¢ Mixed municipal organic wastes are challenging to convert, but also offer the advantage of negative feedstock costs (tipping fees). Approach ā€¢ This feature article explores the key technical and regulatory barriers to increasing the utilization of mixed municipal organics, and recommends research directions to address these challenges. ā€¢ The article draws from broad experiences across the industry, literature, and detailed data and operational experiences at a dry anaerobic digestion facility in San Jose, CA (Zero Waste Energy Development). Outcomes and Impacts ā€¢ Key challenges identified and explored include: (1) Sorting technologies and practices to minimize feedstock contamination, (2) Predicting biogas yields and composition from mixed waste streams, (3) Mitigating air pollution to comply with local regulations and avoid odor complaints, (4) Maximizing the economic value of energy outputs, (5) Maximizing the net climate benefits of anaerobic digestion and coproducts ā€¢ Many of these challenges are broadly applicable to bioenergy systems beyond anaerobic digestion Satchwell et al. (2018) Environ. Sci. Technol., doi: 10.1021/acs.est.8b04481)
  • 11. Liquid chromatography and mass spectrometry analysis of isoprenoid intermediates in Escherichia coli Background ā€¢ Isoprenoids are a highly diverse group of natural products with broad application as high value chemicals and advanced biofuels. ā€¢ However, the measurement of isoprenoid intermediates via standard liquid chromatography-mass spectrometry (LC-MS) protocols is challenging due to their hydrophilicity and complex physicochemical properties. ā€¢ Here we describe a robust hydrophilic interaction liquid chromatography time-of-flight mass spectrometry (HILIC-TOF-MS) method for analyzing isoprenoid intermediates from metabolically engineered Escherichia coli strains. Approach ā€¢ HILIC separation was mediated by hydrogen bonding between the analyte and LC stationary phase. ā€¢ HILIC separation was coupled to TOF-MS via electrospray ionization and analytes were detected via high resolution accurate mass measurements of deprotonated ion adducts. ā€¢ Following metabolite extraction from Escherichia coli biomass, isoprenoid intermediates were quantified by HILIC-TOF-MS. Outcomes and Impacts ā€¢ The HILIC-TOF-MS method was able to resolve all but two of the isoprenoid intermediates tested (i.e., IPP/DMAPP). ā€¢ The method was used to identify pathway bottlenecks in engineered Escherichia coli by observing the accumulation of intermediate metabolites (which may have occurred due to reduced activity of the proceeding enzyme(s)). ā€¢ The method can also be used to monitor dephosphorylated pathway intermediates (e.g., IP/DMAP and FP), sugars, nucleotide cofactors, and central carbon metabolites of the glycolysis pathway and the tricarboxylic acid (TCA) cycle. Baidoo et al. (2018) Chapter 11, MIMB, Humana Press, doi:10.1007/978-1-4939-8757-3_11