Dataviz Products throughout the Evaluation Lifecycle
•
0 likes•971 views

Innovation Network's Veena Pankaj and ORS Impact's Mel Howlett share dataviz products that can be used throughout the evaluation lifecycle, including theory of change, social network analysis, data placemat, strategic debrief deck, H-form, visual report deck, visual executive summary, and timeline.

Recommended
Recommended
More Related Content
What's hot
What's hot (20)
Viewers also liked
Viewers also liked (9)
Similar to Dataviz Products throughout the Evaluation Lifecycle
Similar to Dataviz Products throughout the Evaluation Lifecycle (20)
More from Innovation Network
More from Innovation Network (20)
Recently uploaded
Recently uploaded (20)
Dataviz Products throughout the Evaluation Lifecycle
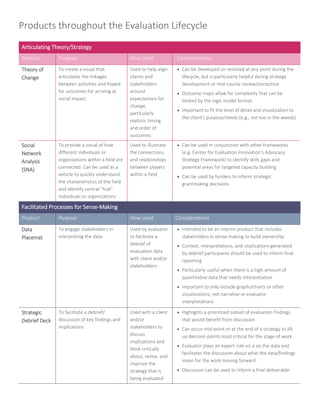
- 1. Products throughout the Evaluation Lifecycle Articulating Theory/Strategy Product Purpose How Used Considerations Theory of Change To create a visual that articulates the linkages between activities and hoped- for outcomes for arriving at social impact Used to help align clients and stakeholders around expectations for change, particularly realistic timing and order of outcomes Can be developed or revisited at any point during the lifecycle, but is particularly helpful during strategy development or mid-course review/correction Outcome maps allow for complexity that can be limited by the logic model format Important to fit the level of detail and visualization to the client’s purpose/needs (e.g., not too in the weeds) Social Network Analysis (SNA) To provide a visual of how different individuals or organizations within a field are connected. Can be used as a vehicle to quickly understand the characteristics of the field and identify central “hub” individuals or organizations Used to illustrate the connections and relationships between players within a field Can be used in conjunction with other frameworks (e.g. Center for Evaluation Innovation’s Advocacy Strategy Framework) to identify skills gaps and potential areas for targeted capacity building Can be used by funders to inform strategic grantmaking decisions Facilitated Processes for Sense-Making Product Purpose How Used Considerations Data Placemat To engage stakeholders in interpreting the data Used by evaluator to facilitate a debrief of evaluation data with client and/or stakeholders Intended to be an interim product that includes stakeholders in sense-making to build ownership Context, interpretations, and implications generated by debrief participants should be used to inform final reporting Particularly useful when there is a high amount of quantitative data that needs interpretation Important to only include graphs/charts or other visualizations, not narrative or evaluator interpretations Strategic Debrief Deck To facilitate a debrief/ discussion of key findings and implications Used with a client and/or stakeholders to discuss implications and think critically about, revise, and improve the strategy that is being evaluated Highlights a prioritized subset of evaluation findings that would benefit from discussion Can occur mid-point or at the end of a strategy to lift up decision points most critical for the stage of work Evaluator plays an expert role vis a vis the data and facilitates the discussion about what the data/findings mean for the work moving forward Discussion can be used to inform a final deliverable
- 2. 2 H-Forms To capture the degree to which stakeholders agree or disagree with a selected concept, and why. The process of publically rating each concept promotes discussion, identifies areas of consensus and divergence among stakeholders, and allows for the interpretation of information Used as a facilitative tool to gather and document stakeholder opinions and capture in-the- moment reflections Evaluator plays a facilitative role during this process H-Forms can be used to gather perspectives on multiple concepts simultaneously Evaluator creates an H-Form display for each concept being rated H-Forms should include a rating scale (preferably a 5- point scale) with anchor points clearly labeled Dot stickers can be used to enable stakeholders to rate each concept Communication and Reporting to Stakeholders Product Purpose How Used Considerations Visual Report Deck To share findings from an evaluation using data visualization to enhance understanding and promote evaluation use Used as a communication tool to share evaluation findings Visual reports take time to create Evaluator needs to follow basic dataviz guidelines when creating a visual report Evaluator needs to ensure that the report is well- organized Visual reports need to be a stand-alone product Visual Executive Summary To complement a traditional evaluation report Used as a communication tool to share evaluation findings with audiences that have a limited appetite for data or limited time Data are highly synthesized; should be no more than 1-2 pages Product may have a life of its own and should tell a story of the highest priority data/findings Timeline To chronologically document events related to an initiative or program to help stakeholders identify patterns, themes, and trends that may otherwise be difficult to see; Promotes a shared understanding of the contextual factors that may have contributed to or detracted from a desired outcome Used as a communication tool to help stakeholders digest multiple levels of information across a specified timeline Important to identify the purpose, audience, and time horizon of the timeline at the beginning of the process Evaluator needs to be selective about the categories of information included in the timeline Important to be purposeful in selecting the format and visualization style for the timeline Timelines are especially relevant when evaluating advocacy and policy change initiatives where contextual elements play a role in shaping policy outcomes