Real-Time Survey Data Collection & Analysis
•Download as DOCX, PDF•
1 like•516 views

Collecting and analyzing data in real time doesn't have to be as stressful or hard as it sounds, especially if you want to collect real time data using surveys. There is a short way and a long way to collect real time survey data. The short way of collecting and analyzing survey data is to use software that has the capability of collecting and analyzing survey data when embedded into powerpoints or webinars. The long way is to use hard copies of surveys to collect data, and Excel to analyze. This document will show you step by step how to collect and analyze survey data the long way.

Recommended
Recommended
More Related Content
What's hot
What's hot (20)
Viewers also liked
Viewers also liked (14)
Similar to Real-Time Survey Data Collection & Analysis
Similar to Real-Time Survey Data Collection & Analysis (20)
More from Innovation Network
More from Innovation Network (20)
Recently uploaded
Recently uploaded (20)
Real-Time Survey Data Collection & Analysis
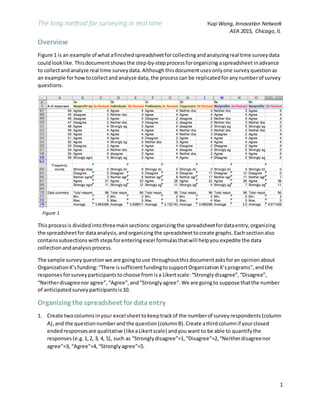
- 1. The long method for surveying in real time Yuqi Wang, Innovation Network AEA 2015, Chicago,IL 1 Overview Figure 1 is an example of what afinishedspreadsheetforcollectingandanalyzingreal time surveydata couldlooklike. Thisdocumentshows the step-by-stepprocessfororganizing aspreadsheetinadvance to collectandanalyze real time survey data.Althoughthisdocument usesonlyone survey question as an example forhowtocollectandanalyze data,the process can be replicatedforany numberof survey questions. Example dataset used Thisprocessis dividedintothreemainsections:organizingthe spreadsheetfordataentry,organizing the spreadsheetfordataanalysis,andorganizing the spreadsheettocreate graphs.Each section also containssubsections withstepsforenteringexcel formulasthatwill helpyou expedite the data collectionandanalysisprocess. The sample surveyquestionwe are goingtouse throughoutthisdocument asksforan opinion about OrganizationX’sfunding: “There issufficientfundingtosupportOrganizationX’sprograms”,andthe responsesforsurveyparticipantstochoose from isa Likertscale:“Stronglydisagree”,“Disagree”, “Neitherdisagreenoragree”,“Agree”,and“Stronglyagree”.We are goingto suppose thatthe number of anticipated survey participantsis10. Organizing the spreadsheet for data entry 1. Create twocolumnsinyour excel sheettokeeptrackof the numberof surveyrespondents (column A),and the questionnumberandthe question(columnB).Create athirdcolumnif yourclosed endedresponsesare qualitative (likeaLikertscale) andyouwant to be able to quantifythe responses (e.g.1,2, 3, 4, 5), such as “Stronglydisagree”=1,“Disagree”=2,“Neitherdisagreenor agree”=3, “Agree”=4,“Stronglyagree”=5. Figure 1
- 2. The long method for surveying in real time Yuqi Wang, Innovation Network AEA 2015, Chicago,IL 2 Quantifyingqualitative responsesishelpfulwhenyouwanttoknow whatthe average survey respondent’sorgroup’sopinionisfora specificquestion. InFigure 2 thisthirdcolumnusedto quantifyresponsesistitled“Q-revised”(columnC). 2. If you knowthe exactnumberof surveyrespondentsyou’ll have,youcanbegintopopulate the first column. If you don’tknowthe exactnumberof surveyrespondents,estimate how manyrespondentsyou will get,andpopulate the firstcolumnuptothat estimatednumber.Make sure toleave enough blankrowsin eachof yourcolumns incase there are additional respondents. Using data validation to create a drop-down menu 3. Data entryin real time can be stressful,andhavingtomanuallyenterortype datais time consuming and mayincrease chancesof human error. To reduce the chance of an error, make sure to prepopulate all of the answerchoicesforeachquestioninyoursurveysothatduringdata entry all youdo is choose the correct answer insteadof typingit.The easiestwaytodothisis by creatinga drop downmenuof all possible answerchoicesforeachquestioninyoursurvey. To create a dropdownmenu,inserta row at the topof yourspreadsheet,andenterall possible answerchoices foryourquestion.Usingourexample,the Likertscale isenteredinthe firstrow (Figure 3).Once youhave done so, clickon the “Data” tab at the top of the excel spreadsheet.Find the icon thatsays “Data Validation”,thenclickonthe datavalidationoptioninthe dropdownmenu. Figure 2
- 3. The long method for surveying in real time Yuqi Wang, Innovation Network AEA 2015, Chicago,IL 3 A taskmenucalled“Data Validation”will popup(Figure 4).Under“Allow”,select “List”andunder “Source”,highlightthe responsesyouenteredinthe toprow alongwithan additional blankcell.The blankcell isthere sothat duringdata entryyoucan differentiate betweencellsthatalreadyhave an answer,andonesthat do not. Click“OK” whenyou’re done.Repeatstep3if youwantto create more drop-downmenuswithdifferentanswerresponses forotherquestions. 4. The cellsyouhighlightedshouldnow show anarrow box whenyouclickon themagain – this signifies yourcell isformattedasadrop downmenu(Figure 5).Selectandcopy the blankcell that youjust highlighted inyourtop row,and paste itin to eachof the cells incolumnB where youneed to have the drop-downmenu. Figure 4 Figure 3
- 4. The long method for surveying in real time Yuqi Wang, Innovation Network AEA 2015, Chicago,IL 4 You can alwayshide the toprow of scale choicesafterwardstoavoiddistraction.Selectthe entire row,right click,andchoose “Hide.” Quantifying qualitative responses 5. Quantifyingqualitative responsesishelpfulwhenyouwanttoknow whatthe average survey respondent’sorgroup’sopinionisfora specificquestion. Inthe example datasetwe are tryingto quantify“Stronglydisagree”toa 1, “Disagree”toa 2, “Neitherdisagree noragree”toa 3, “Agree”to a 4, and “Stronglyagree”toa 5. To quantify one qualitative response, we use anIFcommand:=IF([logical test], [value if true]). Because we don’tknowwhatthe surveyrespondents’answersare goingtobe aheadof time, this formulawill make sure thateachcell will be able toquantifythe responseintothe correctnumber no matterwhat the response is.Todo thisall we needtodo isstringthe IFcommandsof all possible answerchoicesfora particularquestiontogetherwithaplussign(+): =IF([excel cell]="strongly disagree",1)+ IF([excel cell]="disagree",2)+IF([excelcell]="neither disagreenoragree",3)+IF([excelcell]="gree",4)+IF([excelcell]="strongly agree",5) Locate the thirdcolumnyoucreatedfor quantifyingqualitativeresponses. Inthe examplethis third columniscolumnC. In the firstblankcell of column C,copy and paste the above formulaintothe cell (Figure 6).Replace [excel cell] withthe cell in column B that will contain the qualitativeresponse youare tryingto quantify. Figure 5
- 5. The long method for surveying in real time Yuqi Wang, Innovation Network AEA 2015, Chicago,IL 5 6. Once you have the hang of creatingthat formula, copyandpaste it intothe rest of the cellsin columnC. You will knowif the formulaworksif youchoose ananswerfromthe drop-downmenuin the secondcolumn,anditscorrespondingnumbershowsinthe thirdcolumn. Organizing the spreadsheet for dataanalysis 7. Scroll downinyour excel sheettoablank area where youcan create a new sectionto keeptrack of the numberof people whoselectedaparticularanswerchoice foreachquestion.Enterthe header “Frequencycounts”ina newrow underneath columnA.Incolumn Btype all answerchoices available toyoursurveyrespondentsfor the particularquestion (Figure7). Scroll furtherdownthe sheet if youare quantifyingyourqualitativeresponses. AgainincolumnA in a newrow,enterthe header“Data summary”,and incolumn B enter“Total numberof responses”, “Minimumnumber”,“Maximumnumber”,and“Average”(Figure7). Figure 7 Figure 6
- 6. The long method for surveying in real time Yuqi Wang, Innovation Network AEA 2015, Chicago,IL 6 Entering formulasforfrequency 8. To calculate the frequency of aparticularanswerchoice to a question,we needtouse the COUNTIF formula:=COUNTIF(range,criteria). In the greenoutlinedcell(C17) inFigure 8,the formulatocount the frequencyof “1” is: =COUNTIF($C$4:$C$13,1).This formulaistellingexcel tosearch,andcountall of the cells fromC4 to C13 that containsthe number1. The dollarsignsinfrontof the C and 4 tellsExcel tolockinthe column(C) and row(4) to keepthemfrommovingwhenyoucopy andpaste the formulaintoother cells. There may be situationswhere you wanttoknow frequencycountswithoutquantifyingyouranswer responses.Inthiscase, youcan use the formulashowninFigure 9: =COUNTIF([rangeof cells you wantexcel to search in],“answerchoice”). Figure 9 Figure 8
- 7. The long method for surveying in real time Yuqi Wang, Innovation Network AEA 2015, Chicago,IL 7 Entering formulasfor data summary 9. The data summarysection iscreatedusinginformationfromthe frequency andsurveydatasection. The functionsyoucan use are prettystraightforward:SUM to calculate total numberof responses, MIN to calculate minimum, MAXtocalculate maximum, and AVERAGEtocalculate average The range of cellswe needtocalculate the sumis all of the cells underourfrequencysection (Figure 10). For those whoquantifiedtheirqualitative responses,the range of cellswe need tocalculate minimum,maximum,andaverage isall the cellsincolumnCwe createdearlierthatquantifiedour qualitative responses (Figure 11). Figure 10
- 8. The long method for surveying in real time Yuqi Wang, Innovation Network AEA 2015, Chicago,IL 8 Organizing the spreadsheet tocreate graphs 10. If you wantto take yourskillsone stepfurther, youcancreate charts inadvance.The charts will thenpopulate itself withthe informationyouwant asyou enterthe data. To create a chart showingyourdata summaryor questionfrequency,all youneedtodoishighlight the cellsinthe data summaryor frequencysection,andinsertthe desiredcharttype.Thenyoucan formatthe chart size andcolors to your preference. Anotherwayto displayyourdatais to graphthe percentage of peoplewhorespondedtoeachof the answerresponses inaparticularquestion.Todothis,finda blankareaunder“Data summary”. Create a newsection titled“Charts”where youcanpopulate percentagesforeachanswerresponse. Figure 11 =MAX($C$4:$C$13) =AVERAGE($C$4:$C$13)
- 9. The long method for surveying in real time Yuqi Wang, Innovation Network AEA 2015, Chicago,IL 9 You can use thisformulato obtainpercentages:=[thefrequency of a particular answer response]/[totalresponses] (Figure 12). For example,tocalculate the percentageof peoplewhoresponded“Stronglydisagreed” (B35in Figure 12) the formulawouldbe: =[frequency of peoplewho responded “Strongly disagree”]/[total numberof responses].Repeatthisformulaforthe restof the answerchoices.Whenyouare complete,highlightyourformulasandinsertthe desiredchart type.Lastly,playaroundwiththe size and colorof the chart until youare satisfied. Happy evaluating! Figure 12