SlideShare a Scribd company logo
1 of 10
Download to read offline
IOSR Journal of Mechanical and Civil Engineering (IOSR-JMCE)
e-ISSN: 2278-1684,p-ISSN: 2320-334X, Volume 8, Issue 4 (Sep. - Oct. 2013), PP 39-48
www.iosrjournals.org
www.iosrjournals.org 39 | Page
Study On Traffic Conlict At Unsignalized Intersection In
Malaysia
Gunalaan Vasudevan
Faculty of Engineering and Built Environment, Lecturer,Tunku Abdul Rahman University College ,Malaysia
Abstract: The research conducted is traffic conflict at unsignalized intersections . The purpose of this research
is to study accident data used as an identification of hazardous location leads to less accurate countermeasures.
It is because accidents are not always reported especially accident involving damage only and this situation can
reduce good comparative analysis. To overcome these lacks of accident data, many ways of employing non-
accident data have been suggested. One of the ways using non-accident data is traffic conflicts, which is defined
as critical incidents not necessarily involving collisions. The traffic conflict technique was originally set up to
provide more reliable data and information of traffic problems at intersections which actually would replace the
unclear and incomplete recorded data accident. The conflict study was done at the selected unsignalized
intersection where types of traffic conflict can be identified and classified. Various road users involved in the
conflict at the unsignalized intersection were also observed. Then conflicts data captured were analyzed using
the computer program to observe for any conflicts at the intersections. The linear regression graph was used to
show the relationship between conflict and accident data where two different equations were derived from the
graph. This equation may be used to make a prediction for the relationship that might exist between those two
variables at another location.
Index Terms: Traffic conflict and unsignalized intersection
I. Introduction
Traffic conflict is generally defined as an observed situation in which two or more road user approach
each other in space and time to such a point that there is a risk of collision is about to happen if their movements
remain unchanged (Amundsen and Hyden, 1977). Various models have been used to describe the relationship
between collision and conflict. Amundsen and Hyden have set up such model to describe the relationship
between collision and conflict. Generally the accident data and statistics used to address road safety problems
and other related concerns, such as which most hazardous locations (blackspots location), what kinds of hazards
are present and evaluation of safety programs or correction of driver behavior. In most cases, an event of an
accident may not recognize a single cause. It is somewhat an outcome of the complex interactive
processinvolving the driver, the vehicle and the road environment. Therefore, it is difficult sometimes for a
traffic safety analyst to pinpoint the main causes of accidents just from accident data alone. By using only the
accident data also, will sometimes cause problems such as to determine a location that is probably dangerous to
the road user. It is because accidents are not always reported especially accident involving damage only and this
situation can reduce good comparative analysis. Using incomplete accident data makes the identification of
hazardous location less accurate.
To overcome these lacks of accident data, many ways of employing non-accident data have been
suggested (Dattat, 1979). One of many ways using non-accident data is traffic conflicts, which is defined as
critical incidents not necessarily involving collisions. This idea of traffic conflict has long been employed by the
highway engineers when they used „engineering judgment‟ to identify hazardous locations on the highways
(Baker, 1977). Despite that, the concept of traffic conflicts was formally acknowledged when Stuart R. Perkins
and Joseph I. Harris (1968) does more quantitative works. By identifying the type of traffic conflicts that appear
at any location such as at intersection either cross junction, T-junction or cross junction, then any remedial
action can be taken to reduce or avoid potential for an accident to happen. The traffic conflict technique was
originally set up to provide more reliable data and information of traffic problems at intersections which actually
would replace the unclear and incomplete recorded data accidentally (Perkin and Harris, 1969; Campbell and
King, 1970; Baker, 1972). The inadequacy and deficiencies of road accident data have been discussed and
documented widely (Matson et. Crl., 1955; Allen and Shin, 1978; Roosmark and Fraki, 1969; Paddock, 1974)
and these documents has been accepted by most traffic conflicts technique users. However, what has been
overlooked is that this same unreliable accident data has been used in all recorded attempts to link traffic
conflicts with accidents.
The conflict technique enables us to study “hazards” in traffic in a way where we can judge whether the
site is dangerous after only three to five days of conflict studies, and suitable countermeasures can be proposed.
It is better than waiting for three to five years for collection of sufficient statistic data. The nature of traffic
Study On Traffic Conlict At Unsignalized Intersection In Malaysia
www.iosrjournals.org 40 | Page
conflicts enables analysis done and diagnoses inappropriate traffic control, road user behavior and geometric
design at intersections. Where traffic accident records are not available, the traffic conflict analysis can provide
valuable information and also quantifiable safety measures for any evaluation purposes.
In Malaysia, for a road accident analysis study that was done in any location, sometimes no accident
data statistics were available. Moreover, they're also not a single reference data available to indicate the
magnitude of the safety problem or its main characteristic. Also the time period allocated to design and
implement from scratch a complete accident data collection system was too short. This situation obviously
showed the needs of other approaches to replace the dependable on the accident data. Therefore, there is a need
to study if there is any relationship or correlation exist between the conflict data with the accident data so that
the comparison can be made and that correlation can be identified. There was no research done yet based on the
traffic characteristic in Malaysia on the relationship between these two variables.
From the traffic conflict study, the observation can be done at the selected intersection where types of
traffic conflict can be identified and classified. From the study, differences types of conflict that might happen at
the similar location elsewhere can be observed. Also various road usersare involved in the conflict at the
intersection including types of pedestrian conflict at the intersection can be observed. Conflict occurs more often
than accidents, so that determination of conflict in much shorter time than for accident studies. Then the
evaluation of remedial treatment can be completed much sooner. When correlation between traffic conflicts with
the accident data may be identified, an equation can be developed so that estimation can be done in another
location with the same conflict characteristic using that equation. So that possibility of accident occurs at any
other location can be identified by comparing correlation between traffic conflicts with the accident data.
II. Literature Review
Improving road safety is a worldwide political issue to be urgently tackled. In Malaysia, about 373,071
accidents were reported occurred consist of fatal, hospitalized, slightly injury and damage only in
2008according to the Royal Malaysian Police (RMP). From that, 5974 were reported as the fatal accident and
7019 were the hospitalized cases. The statistic of accident in Malaysia from 1990 – 2008. A recent statistics
suggest that about 67% of accidents are caused mainly by some kind of human behavior error.
2.1 Road User Behavior Related to Traffic Safety
A lot of conflicts happen at various points of a location such as in cross section, T-junction, Y-junction
and mid-block. When total vehicles increase, it might contribute to higher potential of traffic conflict due to
interactions among road users. At intersections, vehicle driver not only influenced by the rules of priority there,
but also by the design of the intersection as well as the behavior of other road users. Study done by Summala
et.al (1996) revealed that during the three year period in the city of Helsinki, 69% of all accidents between
bicycles andcars occurring at unsignalized intersections involved drivers making a right turn and cyclist coming
from the right.
So to ensure this situation can be avoided, every road user has to take the intentions and behaviors of
other road users into account. The process of selection the lane after vehicles are generated is to ensure that
vehicles will reach the desired destination. When a lane is selected, the vehicle will proceed and try to enter an
intersection. Vehicles on the major road are either being free in moving or in a platoon. Free moving can achieve
the desired speeds that are controlled by the speed limit at the location. For the platoon situation, the speed will
be determined by the vehicles that lead the platoon. The minor road consists of two sections, the approach
section and the decelerating and or queuing section. Vehicles have lower speeds than the desired speed at the
approach section because they are preparing to negotiate the intersection.
2.2 Traffic Conflict Survey
To conduct traffic conflict survey, the study usually lead by the engineer that decide and determine the
need of study, data supervision, schedule of site survey and supervises the result and analysis. The engineer also
responsible to evaluate the finding and makes decisions and recommendations on the intersection improvement
while the technician is normally responsible for field data collection. A traffic conflict survey usually takes from
a few hours to several days of careful manual observation of traffic at an intersection. To assure uniform data
collection, specific procedures are used so that valid comparisons can be made. A survey needs a few observers
who do the task including recording dimensions and other details about the intersection such as type of traffic
control devices used, observe and record traffic events.
2.3 Traffic Conflict Methodology
Conflict study methodology for both conflicts and events has been used since 1960‟s. Conflict data are
generally obtained when traffic volumes are the heaviest however congested conditions period are avoided.
Conflicts and events are most often quantified in units of conflicts/events-per hour or conflicts/events-pre-1,000
Study On Traffic Conlict At Unsignalized Intersection In Malaysia
www.iosrjournals.org 41 | Page
entering vehicles. Conflict rates for various maneuvers have been quantified by the Institute of Transportation
Engineers (ITE)
2.4 Method of Traffic Conflict Study by U.S. Department Of Transportation,
Federal Highway Administration (FHWA)
Based on the Traffic Conflict Techniques For Safety and Operations-- Observers Manual produced by
U.S. Department Of Transportation, Federal Highway Administration (FHWA), traffic conflict survey are done
including making a conflict count along with collecting other data needed to make a complete study of the
location. Traffic conflict data can be used along with traffic accident data, capacity analysis, signal warrants or
other engineering data needed to identify problems and recommended improvements.
i) Observation procedures include:
ii) Number of personnel needed;
iii) Approach legs to be studied;
iv) Special conflict types (if any);
v) Other data to be collected; and
vi) Hours of observation needed.
III. Methodology
For the purpose of the study, To accomplish the objectives of the traffic conflict study at the
unsignalized junction, several tasks were conducted as below:
i. Perform literature review to provide sufficient information on traffic conflict study technique, its
background and make a review of the previous result of a study done;
ii. Selection of relevant accident data and study site also identify the individual study of intersections;
iii. Develop the procedures of data collection, identify equipment needed and required sample size;
iv. Collect the conflict data at the identified study intersections; and
v. Do the analysis of the data collection
3.1 Selection of Accident Data and Study Area
In this study, the first step is to determine a suitable location and it is selected based on location focused
on the intersection. The intersection area can be defined as the area that are within the view of the data
collection team and is, therefore subject to observation. The intersection area can be defined as that area which
falls within the view of the data collection team and is, therefore, subject to observation. The intersection area
should include all approaches and the area within 90 meters of the center of the intersection. A position is
selected 30 - 90 meter from the intersection on one approach; the actual distance being determined by the
amount of intersection area visible to the observer, space available for parking the observation vehicle.
The unsignalized intersection selected where the T-junction and Y-junction.The traffic conflicts that occurred at
the time of a signal violation were differentiated according to types. Selection of study location was based on the
accident data collected. The accident data collected criteria were described further below. Based on the data, five
(5) locations of unsignalized intersection were selected for the study.
3.1 Accident Data
Accident data were collected based on the source of accident data from Royal Malaysia Police (RMP).
The data were collected from Borang POL-27 that is the form used by the RMP to collect information about
each of an accident. The form has all the important information about the accident including time of accident,
date, location, type of injuries, types of vehicles involved, number of people injured, death or hospitalized and
also a sketch of how the accident happened and others information. All this information was then analyzed to
select the best location to do the conflict study. This study used the data between latest 2 -3 years at the selected
intersection depends on the availability of accident data. Year selected were 2008, 2009 and 2010.
3.1.1 Traffic Conflict data
For collection of traffic conflict data, selection of location is based on the accident data collected. For
this study, data collection of conflict data was selected from the list of the following criteria:
i) Location set up near the junction to observe the road user character; and
ii) The locations selected is not near bus stop, petrol station etc. to keep off modification maneuvers from
road users.
3.2 Measuring Devices and Data Collection Methodology
Conflicts were possible between all types of road users including pedestrians. Video camera used to
record types of traffic conflict and road user involved at the study intersections that were selected. The study
Study On Traffic Conlict At Unsignalized Intersection In Malaysia
www.iosrjournals.org 42 | Page
was done based on the Traffic Conflict Techniques For Safety and Operations-- Observers Manual produced by
the U.S. The observation and recording method is an on-site, online record of the incidence and severity of the
traffic conflict. The observations were made for one day at each intersection.
Methodology done by Zegeer and Dean in 1978 in their research is by use the collected data for 15 minutes each
hour to an 11 hour count day and multiplied each of the count by four to estimate each hourly count. From their
study, they found that conflict data could be limited to peak hours because other periods were uneventful. So for
this study, conflict data taken at the peak hours time at daylight hours. Selected of peak hours time is divided to
peak hours' time in the morning and afternoon or evening and were between ranges as below:
i) 7.00 am – 11.00 am
ii) 12.00 pm – 2.00 pm
iii) 4.00 pm – 7.00 am
The data were taken at daylight time for optimum visibility. Also the data were recorded during the peak hour
period to ensure capturing the greatest interaction between non motorist and motorist traffic. The recordings of
data were not undertaken during off peak period because under such conditions, it would not obtain good and
high interaction between road users. Total time collected for the conflict data were for 4 hours for each location
in one day.
3.4. Procedure for Data Collection
Four hours traffic conflict study was conducted at each of the intersections selected. No traffic
breakdowns including congestion, signal failure, or weather conditions were experienced that inhibited the data
collection process.
After the data requirement clarified and apparatus prepared, on-site data were collected using video
recording technique. Both traffic conflict and traffic volume event data were recorded during the data collection
period. The video data collected using the video as a backup to the manual data collection. Video formatting is
depending on the video source, it may be necessary to encode video in suitable format for processing and correct
recording artifacts. For this study, a digital video recorder was used that encoded suitable video format.
i) One digital video recorder was set up at suitable locations and height where full view of the study sites that
captured all the traffic movement at the selected sites at the specified time periods as decided earlier.
ii) For this technique, it required two corresponding persons at the sites in order to observe the proper video
recording and install the video.
iii) The system consisted of a portable video camera, tripod and a computer.
iv) Then, the filming traffic operations captured on-site were converted into media video file type. The media
video files then replayed on a computer and interpreted until entire necessary data were accomplished on
the traffic laboratory.
IV. Results
4.1 Introduction
Five unsignalized intersections were selected for the traffic conflicts study as shown in Table 4.1 below.
Two (2) types of unsignalized intersection were selected to carry out the conflict study that is Y-junction and T-
junction. Selection of intersections was based on the accident data collected for 3 years data from 2008 to 2010.
Selection of conflict study location carried out also based on an accident at the location for at least 3
accidentsoccurred within 3 years. Accident involving damage only is not considered in the selection of the study
location.
The traffic conflict data were collected for 4 hours at the peak hour between morning to evening. All
the traffic conflict data are captured and analyzed. The traffic movements were referring to Malaysian driver that
was the right hand rules. The observation was made using the video camera to capture the traffic movement at
the location. Then the data were analyzed using a computer to observe any conflicts at the intersections.
Table 4.1 : Details of selected unsignalized Intersection
No. Location Route No.
Type of
Intersection
Section No.
No. of
Lanes
(per
direction)
1
Simpang Jalan Bomba, Jalan
Klang-Teluk Intan
FT005 Y-Junction 496 2
2
Simpang Bagan Tengkorak, Jalan
Klang-Teluk Intan
FT005 Y- Junction 497 2
3
Simpang Tiga Rasa, Jalan Kuala
Lumpur-Ipoh
FT001 T-Junction 441.5 1
4 Pekan banting, Jalan Klang- FT005 T-Junction 400 2
Study On Traffic Conlict At Unsignalized Intersection In Malaysia
www.iosrjournals.org 43 | Page
4.2 Accident Data Collection
A total of 32 accident data were collected for further comparison with the conflict data observed at the
sites for the five (5) unsignalized intersections. The total of accident for three years range between 3 accident to
10 accidents where Simpang Bagan Tengkorak and Simpang Jalan Waja recorded the highest total of accident
for those years. Most of the accidents involving serious injury involving 16 accident following by 10 slightly
injury and 6 cause death. There are total 66 vehicles involved for in all the accidents and further details will be
discussed later.
Table 4.2 : Accident characteristic at unsignalized junction
No. Location
Total
Accident (3
years)
Total
Vehicles
Involve
Type of Injury
Death
Serious
Injury
Slightly
Injury
1
Simpang Jalan Bomba, Seksyen 496
Jalan Klang-teluk Intan
3 6 2 1 0
2
Simpang Bagan Tengkorak, Seksyen
497 Jalan Klang-teluk Intan
9 18 2 1 6
3
Simpang Tiga Rasa, Seksyen 441.5
Jalan Kuala Lumpur-Ipoh
6 12 2 1 3
4
Pekan banting, Seksyen 400, Jalan
Klang-Banting-Port Dickson
4 10 0 3 1
5
Simpang Jalan Waja, Teluk Panglima
Garang. Seksyen 419, KM19
Klang,Jalan Klang-Banting-Port
Dickson
10 20 0 10 0
TOTAL 32 66 6 16 10
4.3 Analysis of Conflict and Accident Data
4.3.1 Types of vehicles Involve in Accident and Conflict
From the graph in Figure 4.1 show that both conflicts and accidents involved cars were the highest
percentage of the total of conflict and accident data followed with the motorcycle and other vehicles.
Differences involving a car and a motorcycle were that conflict involving car was higher (79.7%) compare to
motorcycle (7.1%). However for accident data recorded, the accident involving a car and motorcycle show
smaller differences where percentage involved in an accident was 47.0% for car and 39.4% of motorcycle. For
bus and involving animal, there was no accident recorded.
Figure 4.1 : Types of Vehicles Involve in Accident and Conflict
Banting-Port Dickson
5
Simpang Jalan Waja, Teluk
Panglima Garang. KM19 Klang,
Jalan Klang-Banting-Port Dickson
FT005 T-Junction 419 4
Conflict
Accident
Study On Traffic Conlict At Unsignalized Intersection In Malaysia
www.iosrjournals.org 44 | Page
4.3.2 The correlation between Types of Vehicles Involve in Conflict and Accident
The value of the correlation coefficient in the Table 4.4 showed that there is positive value of
correlation between accident with conflict for the car, pedestrian, lorry and van that are 0.44, 0.69, 0.02 and
0.06. But car, lorry and van showed a weak correlation between accident and conflict because the value of
correlation coefficient was less than 0.5. The value of 0.5 for correlation coefficient was takes into consideration
to indicate weak or strong correlation between those two variables.
For the motorcycle and bicycle, both data shownegative values of correlation coefficient that were -
0.45 and -0.25 for accident and conflict relationship. For the bus and animal, no correlation shown between
accident and conflict because there was no data for accident collected.
4.4 Analysis of correlation between conflicts and accidents for different types of conflict/accident
The correlation coefficient used to identify the correlation that exists between conflict and accident by
the types of conflict and accident. From the table 4.5 (a), it shows that the highest conflict involving slow
vehicle same direction conflict that is 103 conflicts, following by 42 conflicts for slow vehicle same direction
for secondary conflict and 23 conflict for type of opposing right turn conflict.
Most of the correlation coefficient shows negative values that referto no significant correlation between
total types of conflict with the total accident for the same types. The highest positive correlation that analyzed
was for type of right turn cross traffic from left conflict and the correlation coefficient value is 0.77. The value is
referred as strong relationship because the value of correlation coefficient was more than 0.5. For right turn
same direction conflict/accident, the value is 0.48 followed by slow vehicle same-direction conflict/accident
(0.33). Both types of conflict/accident show a weak relationship between conflict and accident because the value
is less than 0.5.
4.4.3. Linear Regression Graph Analysis for Types of Conflicts and Accidents
The graph plotted below shows the relationship between conflicts with the accident of differences type
of conflict/accident. There are 6 graphs plotted for each type of conflict/accident and each of the graph show
difference linear relationship. From the entire graph, 6 equations were obtained from the graph with each of the
graphs show different value of the equation.
Figure 4.2: Relationship between accident and conflict for same direction
Conflict/accident
y = 0.005x + 2.262
0
1
2
3
4
5
6
7
0 10 20 30 40 50
Accident
Conflict
Accident vs Conflict
(Type :Same Direction)
Study On Traffic Conlict At Unsignalized Intersection In Malaysia
www.iosrjournals.org 45 | Page
Figure 4.3: Relationship between accident and conflict for opposing right turn
Conflict/accident
Figure 4.5: Relationship between accident and conflict for cross traffic/accident
From left cross street approach
y = -0.044x + 1.203
0
0.5
1
1.5
2
2.5
3
3.5
0 2 4 6 8 10
Accident
Conflict
Accident vs Conflict
(Type : Opposing Right-Turn
Conflict/Accident)
y = 0.203x - 0.055
-1
0
1
2
3
4
0 5 10 15
Accident
Conflict
Accident vs Conflict
(Type : Cross-Traffic Conflicts/Accident
From Left Cross Street Approach)
Study On Traffic Conlict At Unsignalized Intersection In Malaysia
www.iosrjournals.org 46 | Page
Figure 4.6: Relationship between accident and conflict for cross-traffic
Conflict/accident from the right cross street approach
Figure 4.7: Relationship between accident and conflict for secondary
Conflict/accident
4.4.4 Linear Regression Graph for Analysis of Relationship between conflict and accident data
The linear regression graph method used to show the relationship between conflict and accident data.
The graph in Figure 4.8 below shows the relationship between conflicts with the accident. It was found that
conflicts per 4 hours were related to average accidents from three year total. The equation derived from the
linear graph is y = 0.03x+ 4.789 where y is the value of accident data and x is the value of conflict.
y = -0.923x + 7.692
0
0.5
1
1.5
2
2.5
3
3.5
4
4.5
0 2 4 6 8 10
Accident
Conflict
Accident vs Conflict
(Type : Cross-Traffic Conflicts/Accident From
Right Cross Street Approach
y = -0.024x + 0.654
-0.4
-0.2
0
0.2
0.4
0.6
0.8
1
1.2
0 10 20 30 40
Accident
Conflict
Accident vs Conflict
(Type : Secondary)
Study On Traffic Conlict At Unsignalized Intersection In Malaysia
www.iosrjournals.org 47 | Page
4.4.5 Linear Regression Graph for Analysis of Relationship between conflict/traffic Volumes and accident
data
To get a better linear graph, the traffic volume data were taken into consideration for total of conflict
occurred as shown in Figure 4.9. Linear regression graph then were also used to show the linear relationship
between data of conflict/traffic volume with the accident. The equation derived from the linear graph is y=
27.06x+ 6.167 where y is the value of accident data and x is the value of conflict/traffic volume.
Table 4.6 : Conflict and traffic volume
Figure 4.9: Relationship between the Conflict/Traffic Volumes with the Accident
y = 27.06x + 6.167
0
2
4
6
8
10
12
0 0.005 0.01 0.015 0.02 0.025
Accident
Conflict/ traffic volume
Accident vs Conflict/ traffic volume
Location
Total Conflict
(4 hour)
Total traffic
volume
(4 hour)
Average total
traffic
volume
(1 hour)
conflict/Total traffic-
4 hour
Simpang Jalan Bomba, Jalan Klang-
teluk Intan
19 7368 1842 0.0026
Simpang Bagan Tengkorak, Jalan
Klang-teluk Intan
53 6288 1572 0.0084
Simpang Tiga Rasa, Jalan Kuala
Lumpur-Ipoh
100 4260 1065 0.0235
Pekan banting, Jalan Klang-Banting-
Port Dickson
46 12567 3142 0.0044
Simpang Jalan Waja, Teluk Panglima
Garang. KM19 Klang,Jalan Klang-
Banting-Port Dickson
50 12128 3032 0.0041
TOTAL 268
Study On Traffic Conlict At Unsignalized Intersection In Malaysia
www.iosrjournals.org 48 | Page
V. Conclusion
As a conclusion, all the objectives of this study are achieved. Conflict data from various sites were
compared with different combinations of conflicts, types of vehicles and traffic volume. The comparison shows
that value of correlations for data compared between conflict and accident for different types of vehicles is
enough to showthe inconsistencies relationship between those two variables.
Overall, the study showed a weak accident and conflict relationship. This study did not provide strong
conclusive between conflicts and accident data at the unsignalized intersection. This might cause by inadequate
numbers of intersections to be studied due to limited time of study. It also might influence by short period of
observation for the conflict data. This also caused by the limitation of time and sources of observer and facilities
used. It also was problematic due to inadequate data of accidents or reporting accident at the locations studied.
However, this study provides useful insight into the correlation between accident and accident where
two equations derived for relationship between those two variables. This equation may be used to make a
predictionoftotal accident that might occur when conflict amount are known. This can be the good starting to do
a more detail studyof this relationship withthe traffic situation at the intersection in Malaysia by study others
aspect related to this conflict and accident at the location.
The important conclusion of this study is that using conflict data at a location for a treatment planning
may not immediately result in reducing accident rates at an unsignalized intersection.
Recommendations for Future Research
Based on recent research studied To get and produce a better result for this study, a few factors should
be considered including:
I. Details studies for the conflict study at an unsignalized intersection including another type of
intersection such as four legged intersections.
II. Much more time taken to count the conflict data, are useful to identify the main types of conflict
occurred at the intersection and studied the reason why this conflict happen at the location.
III. All the observers should understand the procedures and specifications of the study well to make sure
the location selected for the conflict data observation was at the right location.
IV. Control the other variables that might affect the result such as differences width of lanes and also the
number of lanes.
As for this study find out that there is a small value of correlation between traffic conflict and accident,
so further study are required to verify this study and to reach the acceptable level of statistical correlation
between conflicts and accidents. Also other study may be needed to look further into the equations derived from
this study. So for future improvement, agencies involving with the problem of accident can make a good
prediction the amount of accident that may occur at an unsignalized intersection only based on the equations so
treatment to avoid the potential of accidents can be done.
Reference
[1] Allen, B.L., Shin, B.T. and Cooper, P.J. (1978). Analysis of Trafsic Conflicts and Collisions. Report No. TRR 667, pp. 67-74.
Transportation Research Board.
[2] Amundsen, F.; Hyden, C. (1977). Proceedings of first workshop on traffic conflicts. Oslo, Institute of Transport Economics.
[3] Archer, Jeffery (2001).Traffic Conflict Technique Historical To Current State-Of-The-Art. Trita-Infra 02-010. Stockholm.
[4] Baker. W.T. (1972). An Evaluation of the Traffic Conflicts Technique. Report No. HRR 384, pp. 1-8. Highway Research Board.
[5] Brown, G. R. (1991). Use Of Traffic Conflicts For Near-Miss Reporting. In: Near-miss registration as a safety tool. Oxford,
Butterworth-Heinemann; U.K.: pp. 111-125.
[6] Fruhman, R.(1993). Safety Evaluation of Traffic Systems: Traffic Conflicts and Other Measures. Proceeding of the 6th ICTCT
Workshop. Austrian Road Safety Board, Salzburg; pp. 291-296.
[7] G. Tiwari, D. Mohan and J. Fazio. (1998). Conflict Analysis for Prediction of FatalCrash Locations in Mixed Traffic Streams. In
Accident Analysis and Prevention, Vol. 30, No. 2, pp. 207-215. Great Britain: Elsevier Science Ltd.
[8] Gunilla M. Bjorklund and Lars Aberg. (2005). Driver Behaviour In Intersections: Formal and Informal Traffic Rules. Transportation
Research Part F 8, pp. 239–253.
[9] Harris, J.I. & Perkins, S.R. (1968). Traffic Conflict Characteristics: Accident Potential At Intersections. Highway Research Record.
225, pp45-143, Highway Research Board, Washington DC.
[10] Herman W. Kruysse, Gert Jan Wijlhuizen. (1992). Why Are Experts Not Better In Judging the Danger of Filmed Traffic Conflicts.
Accident Analysis & Prevention. Vol. 24. No. 3. pp. 227-235.
[11] Hoong-Chor Chin and Ser-Tong Quek (1997). Measurement of Traffic Conflicts. Journal of Safety Science Vol. 26. No. 3, pp. 169-
185.
[12] Jian Jon Lu. (2005, November). Determination Of The Offset Distance Between Driveway Exits And Downstream U-Turn Locations
For Vehicles Making Right Turns Followed By U-Turns. Summary of Final Report, Bd.544-05.
[13] Jutaek Oh, Eungcheol Kim, Myungseob Kim, Sangho Choo. (2010). Development of Conflict Techniques For Left-Turn and Cross-
Traffic At Protected Left-Turn Signalized Intersections. Journal of Safety Science 48, pp. 460 -468.
[14] Navin, F. P. D.(1991). Computational techniques in Transportation Engineering. Proceedings, 4th International Conference on
Computing in Civil and Building Engineering, Tokyo, Japan.
[15] R., Zegeer, C.V., (1989a). Traffic Conflict Techniques for Safety and Operations: Engineer‟s Guide. FHWA-IP-88-026.

More Related Content

What's hot

Road Accident Study on Some Areas in Yangon
Road Accident Study on Some Areas in YangonRoad Accident Study on Some Areas in Yangon
Road Accident Study on Some Areas in Yangon
ijtsrd
 
The Effects of Vehicle Speeds on Accident Frequency within Settlements along ...
The Effects of Vehicle Speeds on Accident Frequency within Settlements along ...The Effects of Vehicle Speeds on Accident Frequency within Settlements along ...
The Effects of Vehicle Speeds on Accident Frequency within Settlements along ...
IJMER
 

What's hot (19)

Consequences of Road Traffic Accident in Nigeria: Time Series Approach
Consequences of Road Traffic Accident in Nigeria: Time Series Approach Consequences of Road Traffic Accident in Nigeria: Time Series Approach
Consequences of Road Traffic Accident in Nigeria: Time Series Approach
 
PREDICTION OF ROAD ACCIDENT MODELLING FOR INDIAN NATIONAL HIGHWAYS
PREDICTION OF ROAD ACCIDENT MODELLING FOR INDIAN NATIONAL HIGHWAYSPREDICTION OF ROAD ACCIDENT MODELLING FOR INDIAN NATIONAL HIGHWAYS
PREDICTION OF ROAD ACCIDENT MODELLING FOR INDIAN NATIONAL HIGHWAYS
 
ANALYSIS OF ROADWAY FATAL ACCIDENTS USING ENSEMBLE-BASED META-CLASSIFIERS
ANALYSIS OF ROADWAY FATAL ACCIDENTS USING ENSEMBLE-BASED META-CLASSIFIERSANALYSIS OF ROADWAY FATAL ACCIDENTS USING ENSEMBLE-BASED META-CLASSIFIERS
ANALYSIS OF ROADWAY FATAL ACCIDENTS USING ENSEMBLE-BASED META-CLASSIFIERS
 
IRJET- Measuring The Driver's Perception Error in the Traffic Accident Risk E...
IRJET- Measuring The Driver's Perception Error in the Traffic Accident Risk E...IRJET- Measuring The Driver's Perception Error in the Traffic Accident Risk E...
IRJET- Measuring The Driver's Perception Error in the Traffic Accident Risk E...
 
Road Accident Study on Some Areas in Yangon
Road Accident Study on Some Areas in YangonRoad Accident Study on Some Areas in Yangon
Road Accident Study on Some Areas in Yangon
 
Analysis of Machine Learning Algorithm with Road Accidents Data Sets
Analysis of Machine Learning Algorithm with Road Accidents Data SetsAnalysis of Machine Learning Algorithm with Road Accidents Data Sets
Analysis of Machine Learning Algorithm with Road Accidents Data Sets
 
Traffic Accident Data Profiling and Clusteringwith Data Mining Process
Traffic Accident Data Profiling and Clusteringwith Data Mining  ProcessTraffic Accident Data Profiling and Clusteringwith Data Mining  Process
Traffic Accident Data Profiling and Clusteringwith Data Mining Process
 
The Effects of Vehicle Speeds on Accident Frequency within Settlements along ...
The Effects of Vehicle Speeds on Accident Frequency within Settlements along ...The Effects of Vehicle Speeds on Accident Frequency within Settlements along ...
The Effects of Vehicle Speeds on Accident Frequency within Settlements along ...
 
I1037175
I1037175I1037175
I1037175
 
34 relationship between speed_risk_fatal_injury_pedestrians_and_car_occupants...
34 relationship between speed_risk_fatal_injury_pedestrians_and_car_occupants...34 relationship between speed_risk_fatal_injury_pedestrians_and_car_occupants...
34 relationship between speed_risk_fatal_injury_pedestrians_and_car_occupants...
 
PREDICTING ROAD ACCIDENT RISK USING GOOGLE MAPS IMAGES AND ACONVOLUTIONAL NEU...
PREDICTING ROAD ACCIDENT RISK USING GOOGLE MAPS IMAGES AND ACONVOLUTIONAL NEU...PREDICTING ROAD ACCIDENT RISK USING GOOGLE MAPS IMAGES AND ACONVOLUTIONAL NEU...
PREDICTING ROAD ACCIDENT RISK USING GOOGLE MAPS IMAGES AND ACONVOLUTIONAL NEU...
 
20320140506003
2032014050600320320140506003
20320140506003
 
Virtual pedestrians risk modeling
Virtual pedestrians risk modelingVirtual pedestrians risk modeling
Virtual pedestrians risk modeling
 
4Data Mining Approach of Accident Occurrences Identification with Effective M...
4Data Mining Approach of Accident Occurrences Identification with Effective M...4Data Mining Approach of Accident Occurrences Identification with Effective M...
4Data Mining Approach of Accident Occurrences Identification with Effective M...
 
Pedestrian Accident Scenario of Dhaka City and Development of a Prediction Model
Pedestrian Accident Scenario of Dhaka City and Development of a Prediction ModelPedestrian Accident Scenario of Dhaka City and Development of a Prediction Model
Pedestrian Accident Scenario of Dhaka City and Development of a Prediction Model
 
Forecasting Road Accident Fatalities in India
Forecasting Road Accident Fatalities in IndiaForecasting Road Accident Fatalities in India
Forecasting Road Accident Fatalities in India
 
Advance methodologies to ensure road safety
Advance methodologies to ensure road safetyAdvance methodologies to ensure road safety
Advance methodologies to ensure road safety
 
IRJET- Algorithms for the Prediction of Traffic Accidents
IRJET-  	  Algorithms for the Prediction of Traffic AccidentsIRJET-  	  Algorithms for the Prediction of Traffic Accidents
IRJET- Algorithms for the Prediction of Traffic Accidents
 
Human Factor
Human FactorHuman Factor
Human Factor
 

Viewers also liked

Quality Assurancein Technical Vocational Education (TVE)for Sustainable Natio...
Quality Assurancein Technical Vocational Education (TVE)for Sustainable Natio...Quality Assurancein Technical Vocational Education (TVE)for Sustainable Natio...
Quality Assurancein Technical Vocational Education (TVE)for Sustainable Natio...
IOSR Journals
 

Viewers also liked (20)

J018127176.publishing paper of mamatha (1)
J018127176.publishing paper of mamatha (1)J018127176.publishing paper of mamatha (1)
J018127176.publishing paper of mamatha (1)
 
L012328593
L012328593L012328593
L012328593
 
N01741100102
N01741100102N01741100102
N01741100102
 
I012126670
I012126670I012126670
I012126670
 
F1802043747
F1802043747F1802043747
F1802043747
 
L012337275
L012337275L012337275
L012337275
 
A017260110
A017260110A017260110
A017260110
 
Vitality of Physics In Nanoscience and Nanotechnology
Vitality of Physics In Nanoscience and NanotechnologyVitality of Physics In Nanoscience and Nanotechnology
Vitality of Physics In Nanoscience and Nanotechnology
 
C012421626
C012421626C012421626
C012421626
 
F012113746
F012113746F012113746
F012113746
 
Exact Analytical Expression for Outgoing Intensity from the Top of the Atmosp...
Exact Analytical Expression for Outgoing Intensity from the Top of the Atmosp...Exact Analytical Expression for Outgoing Intensity from the Top of the Atmosp...
Exact Analytical Expression for Outgoing Intensity from the Top of the Atmosp...
 
L018147377
L018147377L018147377
L018147377
 
A017660107
A017660107A017660107
A017660107
 
Pollution Due To Noise from Selected Places
Pollution Due To Noise from Selected PlacesPollution Due To Noise from Selected Places
Pollution Due To Noise from Selected Places
 
I- Function and H -Function Associated With Double Integral
I- Function and H -Function Associated With Double IntegralI- Function and H -Function Associated With Double Integral
I- Function and H -Function Associated With Double Integral
 
Quality Assurancein Technical Vocational Education (TVE)for Sustainable Natio...
Quality Assurancein Technical Vocational Education (TVE)for Sustainable Natio...Quality Assurancein Technical Vocational Education (TVE)for Sustainable Natio...
Quality Assurancein Technical Vocational Education (TVE)for Sustainable Natio...
 
Investigation of General Equation That Best Describe the Relationship between...
Investigation of General Equation That Best Describe the Relationship between...Investigation of General Equation That Best Describe the Relationship between...
Investigation of General Equation That Best Describe the Relationship between...
 
I012527580
I012527580I012527580
I012527580
 
E012542629
E012542629E012542629
E012542629
 
E010123337
E010123337E010123337
E010123337
 

Similar to Study On Traffic Conlict At Unsignalized Intersection In Malaysia

PHYS102 Introduction To Electromagnetism.docx
PHYS102 Introduction To Electromagnetism.docxPHYS102 Introduction To Electromagnetism.docx
PHYS102 Introduction To Electromagnetism.docx
write5
 
Introduction When highway planners examine ways to improve the.pdf
Introduction When highway planners examine ways to improve the.pdfIntroduction When highway planners examine ways to improve the.pdf
Introduction When highway planners examine ways to improve the.pdf
sdfghj21
 
The influence of road geometric design elements on highway safety
The influence of road geometric design elements on highway safetyThe influence of road geometric design elements on highway safety
The influence of road geometric design elements on highway safety
IAEME Publication
 
PREDICTING ACCIDENT SEVERITY: AN ANALYSIS OF FACTORS AFFECTING ACCIDENT SEVER...
PREDICTING ACCIDENT SEVERITY: AN ANALYSIS OF FACTORS AFFECTING ACCIDENT SEVER...PREDICTING ACCIDENT SEVERITY: AN ANALYSIS OF FACTORS AFFECTING ACCIDENT SEVER...
PREDICTING ACCIDENT SEVERITY: AN ANALYSIS OF FACTORS AFFECTING ACCIDENT SEVER...
IJCI JOURNAL
 

Similar to Study On Traffic Conlict At Unsignalized Intersection In Malaysia (20)

Pedestrian Conflict Risk Model at Unsignalized Locations on a Community Street
Pedestrian Conflict Risk Model at Unsignalized Locations on a Community StreetPedestrian Conflict Risk Model at Unsignalized Locations on a Community Street
Pedestrian Conflict Risk Model at Unsignalized Locations on a Community Street
 
International Refereed Journal of Engineering and Science (IRJES)
International Refereed Journal of Engineering and Science (IRJES)International Refereed Journal of Engineering and Science (IRJES)
International Refereed Journal of Engineering and Science (IRJES)
 
Analysis of Roadway Fatal Accidents using Ensemble-based Meta-Classifiers
Analysis of Roadway Fatal Accidents using Ensemble-based Meta-ClassifiersAnalysis of Roadway Fatal Accidents using Ensemble-based Meta-Classifiers
Analysis of Roadway Fatal Accidents using Ensemble-based Meta-Classifiers
 
Prediction of the Occurrence of Crashes along the Dar es Salaam Bus Rapid Tra...
Prediction of the Occurrence of Crashes along the Dar es Salaam Bus Rapid Tra...Prediction of the Occurrence of Crashes along the Dar es Salaam Bus Rapid Tra...
Prediction of the Occurrence of Crashes along the Dar es Salaam Bus Rapid Tra...
 
2023-02-01-A novel Road User Safety Field Theory for traffic safety assessmen...
2023-02-01-A novel Road User Safety Field Theory for traffic safety assessmen...2023-02-01-A novel Road User Safety Field Theory for traffic safety assessmen...
2023-02-01-A novel Road User Safety Field Theory for traffic safety assessmen...
 
ADVANCE METHODOLOGIES TO ENSURE ROAD SAFETY
ADVANCE METHODOLOGIES TO ENSURE ROAD SAFETYADVANCE METHODOLOGIES TO ENSURE ROAD SAFETY
ADVANCE METHODOLOGIES TO ENSURE ROAD SAFETY
 
PHYS102 Introduction To Electromagnetism.docx
PHYS102 Introduction To Electromagnetism.docxPHYS102 Introduction To Electromagnetism.docx
PHYS102 Introduction To Electromagnetism.docx
 
IRJET-Road Traffic Accident Analysis and Prediction Model: A Case Study of Va...
IRJET-Road Traffic Accident Analysis and Prediction Model: A Case Study of Va...IRJET-Road Traffic Accident Analysis and Prediction Model: A Case Study of Va...
IRJET-Road Traffic Accident Analysis and Prediction Model: A Case Study of Va...
 
Q01262105114
Q01262105114Q01262105114
Q01262105114
 
Q01262105114
Q01262105114Q01262105114
Q01262105114
 
9 is your-road_forgiving (4)
9   is your-road_forgiving (4)9   is your-road_forgiving (4)
9 is your-road_forgiving (4)
 
Introduction When highway planners examine ways to improve the.pdf
Introduction When highway planners examine ways to improve the.pdfIntroduction When highway planners examine ways to improve the.pdf
Introduction When highway planners examine ways to improve the.pdf
 
Causes of accident on Mumbai-Pune Expressway
Causes of accident on Mumbai-Pune ExpresswayCauses of accident on Mumbai-Pune Expressway
Causes of accident on Mumbai-Pune Expressway
 
Project on Traffics jams and Dell EMC CMR University with references
Project on Traffics jams and Dell EMC CMR University with referencesProject on Traffics jams and Dell EMC CMR University with references
Project on Traffics jams and Dell EMC CMR University with references
 
4 estimating benefits-from_specific_highwa
4   estimating benefits-from_specific_highwa4   estimating benefits-from_specific_highwa
4 estimating benefits-from_specific_highwa
 
Impact of Roadway Condition, Traffic and Manmade Features on Road Safety
Impact of Roadway Condition, Traffic and Manmade Features on Road SafetyImpact of Roadway Condition, Traffic and Manmade Features on Road Safety
Impact of Roadway Condition, Traffic and Manmade Features on Road Safety
 
The influence of road geometric design elements on highway safety
The influence of road geometric design elements on highway safetyThe influence of road geometric design elements on highway safety
The influence of road geometric design elements on highway safety
 
PREDICTING ACCIDENT SEVERITY: AN ANALYSIS OF FACTORS AFFECTING ACCIDENT SEVER...
PREDICTING ACCIDENT SEVERITY: AN ANALYSIS OF FACTORS AFFECTING ACCIDENT SEVER...PREDICTING ACCIDENT SEVERITY: AN ANALYSIS OF FACTORS AFFECTING ACCIDENT SEVER...
PREDICTING ACCIDENT SEVERITY: AN ANALYSIS OF FACTORS AFFECTING ACCIDENT SEVER...
 
Mitigating collisions between pedestrians and vehicles
Mitigating collisions between pedestrians and vehiclesMitigating collisions between pedestrians and vehicles
Mitigating collisions between pedestrians and vehicles
 
A Case Study Of Public Bus Driver Behaviour At Batu Feringghi
A Case Study Of Public Bus Driver Behaviour At Batu FeringghiA Case Study Of Public Bus Driver Behaviour At Batu Feringghi
A Case Study Of Public Bus Driver Behaviour At Batu Feringghi
 

More from IOSR Journals

More from IOSR Journals (20)

A011140104
A011140104A011140104
A011140104
 
M0111397100
M0111397100M0111397100
M0111397100
 
L011138596
L011138596L011138596
L011138596
 
K011138084
K011138084K011138084
K011138084
 
J011137479
J011137479J011137479
J011137479
 
I011136673
I011136673I011136673
I011136673
 
G011134454
G011134454G011134454
G011134454
 
H011135565
H011135565H011135565
H011135565
 
F011134043
F011134043F011134043
F011134043
 
E011133639
E011133639E011133639
E011133639
 
D011132635
D011132635D011132635
D011132635
 
C011131925
C011131925C011131925
C011131925
 
B011130918
B011130918B011130918
B011130918
 
A011130108
A011130108A011130108
A011130108
 
I011125160
I011125160I011125160
I011125160
 
H011124050
H011124050H011124050
H011124050
 
G011123539
G011123539G011123539
G011123539
 
F011123134
F011123134F011123134
F011123134
 
E011122530
E011122530E011122530
E011122530
 
D011121524
D011121524D011121524
D011121524
 

Recently uploaded

Kuwait City MTP kit ((+919101817206)) Buy Abortion Pills Kuwait
Kuwait City MTP kit ((+919101817206)) Buy Abortion Pills KuwaitKuwait City MTP kit ((+919101817206)) Buy Abortion Pills Kuwait
Kuwait City MTP kit ((+919101817206)) Buy Abortion Pills Kuwait
jaanualu31
 
scipt v1.pptxcxxxxxxxxxxxxxxxxxxxxxxxxxxxxxxxxxxxxxxxxxxxxxxxxxxxxxxxxxxxxxxx...
scipt v1.pptxcxxxxxxxxxxxxxxxxxxxxxxxxxxxxxxxxxxxxxxxxxxxxxxxxxxxxxxxxxxxxxxx...scipt v1.pptxcxxxxxxxxxxxxxxxxxxxxxxxxxxxxxxxxxxxxxxxxxxxxxxxxxxxxxxxxxxxxxxx...
scipt v1.pptxcxxxxxxxxxxxxxxxxxxxxxxxxxxxxxxxxxxxxxxxxxxxxxxxxxxxxxxxxxxxxxxx...
HenryBriggs2
 
XXXXXXXXXXXXXXXXXXXXXXXXXXXXXXXXXXXXXXXXXXXXXXXXXXXX
XXXXXXXXXXXXXXXXXXXXXXXXXXXXXXXXXXXXXXXXXXXXXXXXXXXXXXXXXXXXXXXXXXXXXXXXXXXXXXXXXXXXXXXXXXXXXXXXXXXXXXXX
XXXXXXXXXXXXXXXXXXXXXXXXXXXXXXXXXXXXXXXXXXXXXXXXXXXX
ssuser89054b
 

Recently uploaded (20)

Linux Systems Programming: Inter Process Communication (IPC) using Pipes
Linux Systems Programming: Inter Process Communication (IPC) using PipesLinux Systems Programming: Inter Process Communication (IPC) using Pipes
Linux Systems Programming: Inter Process Communication (IPC) using Pipes
 
Hostel management system project report..pdf
Hostel management system project report..pdfHostel management system project report..pdf
Hostel management system project report..pdf
 
Max. shear stress theory-Maximum Shear Stress Theory ​ Maximum Distortional ...
Max. shear stress theory-Maximum Shear Stress Theory ​  Maximum Distortional ...Max. shear stress theory-Maximum Shear Stress Theory ​  Maximum Distortional ...
Max. shear stress theory-Maximum Shear Stress Theory ​ Maximum Distortional ...
 
HAND TOOLS USED AT ELECTRONICS WORK PRESENTED BY KOUSTAV SARKAR
HAND TOOLS USED AT ELECTRONICS WORK PRESENTED BY KOUSTAV SARKARHAND TOOLS USED AT ELECTRONICS WORK PRESENTED BY KOUSTAV SARKAR
HAND TOOLS USED AT ELECTRONICS WORK PRESENTED BY KOUSTAV SARKAR
 
Ground Improvement Technique: Earth Reinforcement
Ground Improvement Technique: Earth ReinforcementGround Improvement Technique: Earth Reinforcement
Ground Improvement Technique: Earth Reinforcement
 
Online electricity billing project report..pdf
Online electricity billing project report..pdfOnline electricity billing project report..pdf
Online electricity billing project report..pdf
 
Kuwait City MTP kit ((+919101817206)) Buy Abortion Pills Kuwait
Kuwait City MTP kit ((+919101817206)) Buy Abortion Pills KuwaitKuwait City MTP kit ((+919101817206)) Buy Abortion Pills Kuwait
Kuwait City MTP kit ((+919101817206)) Buy Abortion Pills Kuwait
 
👉 Yavatmal Call Girls Service Just Call 🍑👄6378878445 🍑👄 Top Class Call Girl S...
👉 Yavatmal Call Girls Service Just Call 🍑👄6378878445 🍑👄 Top Class Call Girl S...👉 Yavatmal Call Girls Service Just Call 🍑👄6378878445 🍑👄 Top Class Call Girl S...
👉 Yavatmal Call Girls Service Just Call 🍑👄6378878445 🍑👄 Top Class Call Girl S...
 
Introduction to Data Visualization,Matplotlib.pdf
Introduction to Data Visualization,Matplotlib.pdfIntroduction to Data Visualization,Matplotlib.pdf
Introduction to Data Visualization,Matplotlib.pdf
 
Worksharing and 3D Modeling with Revit.pptx
Worksharing and 3D Modeling with Revit.pptxWorksharing and 3D Modeling with Revit.pptx
Worksharing and 3D Modeling with Revit.pptx
 
Employee leave management system project.
Employee leave management system project.Employee leave management system project.
Employee leave management system project.
 
Augmented Reality (AR) with Augin Software.pptx
Augmented Reality (AR) with Augin Software.pptxAugmented Reality (AR) with Augin Software.pptx
Augmented Reality (AR) with Augin Software.pptx
 
Post office management system project ..pdf
Post office management system project ..pdfPost office management system project ..pdf
Post office management system project ..pdf
 
PE 459 LECTURE 2- natural gas basic concepts and properties
PE 459 LECTURE 2- natural gas basic concepts and propertiesPE 459 LECTURE 2- natural gas basic concepts and properties
PE 459 LECTURE 2- natural gas basic concepts and properties
 
UNIT 4 PTRP final Convergence in probability.pptx
UNIT 4 PTRP final Convergence in probability.pptxUNIT 4 PTRP final Convergence in probability.pptx
UNIT 4 PTRP final Convergence in probability.pptx
 
Design For Accessibility: Getting it right from the start
Design For Accessibility: Getting it right from the startDesign For Accessibility: Getting it right from the start
Design For Accessibility: Getting it right from the start
 
Introduction to Serverless with AWS Lambda
Introduction to Serverless with AWS LambdaIntroduction to Serverless with AWS Lambda
Introduction to Serverless with AWS Lambda
 
scipt v1.pptxcxxxxxxxxxxxxxxxxxxxxxxxxxxxxxxxxxxxxxxxxxxxxxxxxxxxxxxxxxxxxxxx...
scipt v1.pptxcxxxxxxxxxxxxxxxxxxxxxxxxxxxxxxxxxxxxxxxxxxxxxxxxxxxxxxxxxxxxxxx...scipt v1.pptxcxxxxxxxxxxxxxxxxxxxxxxxxxxxxxxxxxxxxxxxxxxxxxxxxxxxxxxxxxxxxxxx...
scipt v1.pptxcxxxxxxxxxxxxxxxxxxxxxxxxxxxxxxxxxxxxxxxxxxxxxxxxxxxxxxxxxxxxxxx...
 
Convergence of Robotics and Gen AI offers excellent opportunities for Entrepr...
Convergence of Robotics and Gen AI offers excellent opportunities for Entrepr...Convergence of Robotics and Gen AI offers excellent opportunities for Entrepr...
Convergence of Robotics and Gen AI offers excellent opportunities for Entrepr...
 
XXXXXXXXXXXXXXXXXXXXXXXXXXXXXXXXXXXXXXXXXXXXXXXXXXXX
XXXXXXXXXXXXXXXXXXXXXXXXXXXXXXXXXXXXXXXXXXXXXXXXXXXXXXXXXXXXXXXXXXXXXXXXXXXXXXXXXXXXXXXXXXXXXXXXXXXXXXXX
XXXXXXXXXXXXXXXXXXXXXXXXXXXXXXXXXXXXXXXXXXXXXXXXXXXX
 

Study On Traffic Conlict At Unsignalized Intersection In Malaysia

  • 1. IOSR Journal of Mechanical and Civil Engineering (IOSR-JMCE) e-ISSN: 2278-1684,p-ISSN: 2320-334X, Volume 8, Issue 4 (Sep. - Oct. 2013), PP 39-48 www.iosrjournals.org www.iosrjournals.org 39 | Page Study On Traffic Conlict At Unsignalized Intersection In Malaysia Gunalaan Vasudevan Faculty of Engineering and Built Environment, Lecturer,Tunku Abdul Rahman University College ,Malaysia Abstract: The research conducted is traffic conflict at unsignalized intersections . The purpose of this research is to study accident data used as an identification of hazardous location leads to less accurate countermeasures. It is because accidents are not always reported especially accident involving damage only and this situation can reduce good comparative analysis. To overcome these lacks of accident data, many ways of employing non- accident data have been suggested. One of the ways using non-accident data is traffic conflicts, which is defined as critical incidents not necessarily involving collisions. The traffic conflict technique was originally set up to provide more reliable data and information of traffic problems at intersections which actually would replace the unclear and incomplete recorded data accident. The conflict study was done at the selected unsignalized intersection where types of traffic conflict can be identified and classified. Various road users involved in the conflict at the unsignalized intersection were also observed. Then conflicts data captured were analyzed using the computer program to observe for any conflicts at the intersections. The linear regression graph was used to show the relationship between conflict and accident data where two different equations were derived from the graph. This equation may be used to make a prediction for the relationship that might exist between those two variables at another location. Index Terms: Traffic conflict and unsignalized intersection I. Introduction Traffic conflict is generally defined as an observed situation in which two or more road user approach each other in space and time to such a point that there is a risk of collision is about to happen if their movements remain unchanged (Amundsen and Hyden, 1977). Various models have been used to describe the relationship between collision and conflict. Amundsen and Hyden have set up such model to describe the relationship between collision and conflict. Generally the accident data and statistics used to address road safety problems and other related concerns, such as which most hazardous locations (blackspots location), what kinds of hazards are present and evaluation of safety programs or correction of driver behavior. In most cases, an event of an accident may not recognize a single cause. It is somewhat an outcome of the complex interactive processinvolving the driver, the vehicle and the road environment. Therefore, it is difficult sometimes for a traffic safety analyst to pinpoint the main causes of accidents just from accident data alone. By using only the accident data also, will sometimes cause problems such as to determine a location that is probably dangerous to the road user. It is because accidents are not always reported especially accident involving damage only and this situation can reduce good comparative analysis. Using incomplete accident data makes the identification of hazardous location less accurate. To overcome these lacks of accident data, many ways of employing non-accident data have been suggested (Dattat, 1979). One of many ways using non-accident data is traffic conflicts, which is defined as critical incidents not necessarily involving collisions. This idea of traffic conflict has long been employed by the highway engineers when they used „engineering judgment‟ to identify hazardous locations on the highways (Baker, 1977). Despite that, the concept of traffic conflicts was formally acknowledged when Stuart R. Perkins and Joseph I. Harris (1968) does more quantitative works. By identifying the type of traffic conflicts that appear at any location such as at intersection either cross junction, T-junction or cross junction, then any remedial action can be taken to reduce or avoid potential for an accident to happen. The traffic conflict technique was originally set up to provide more reliable data and information of traffic problems at intersections which actually would replace the unclear and incomplete recorded data accidentally (Perkin and Harris, 1969; Campbell and King, 1970; Baker, 1972). The inadequacy and deficiencies of road accident data have been discussed and documented widely (Matson et. Crl., 1955; Allen and Shin, 1978; Roosmark and Fraki, 1969; Paddock, 1974) and these documents has been accepted by most traffic conflicts technique users. However, what has been overlooked is that this same unreliable accident data has been used in all recorded attempts to link traffic conflicts with accidents. The conflict technique enables us to study “hazards” in traffic in a way where we can judge whether the site is dangerous after only three to five days of conflict studies, and suitable countermeasures can be proposed. It is better than waiting for three to five years for collection of sufficient statistic data. The nature of traffic
  • 2. Study On Traffic Conlict At Unsignalized Intersection In Malaysia www.iosrjournals.org 40 | Page conflicts enables analysis done and diagnoses inappropriate traffic control, road user behavior and geometric design at intersections. Where traffic accident records are not available, the traffic conflict analysis can provide valuable information and also quantifiable safety measures for any evaluation purposes. In Malaysia, for a road accident analysis study that was done in any location, sometimes no accident data statistics were available. Moreover, they're also not a single reference data available to indicate the magnitude of the safety problem or its main characteristic. Also the time period allocated to design and implement from scratch a complete accident data collection system was too short. This situation obviously showed the needs of other approaches to replace the dependable on the accident data. Therefore, there is a need to study if there is any relationship or correlation exist between the conflict data with the accident data so that the comparison can be made and that correlation can be identified. There was no research done yet based on the traffic characteristic in Malaysia on the relationship between these two variables. From the traffic conflict study, the observation can be done at the selected intersection where types of traffic conflict can be identified and classified. From the study, differences types of conflict that might happen at the similar location elsewhere can be observed. Also various road usersare involved in the conflict at the intersection including types of pedestrian conflict at the intersection can be observed. Conflict occurs more often than accidents, so that determination of conflict in much shorter time than for accident studies. Then the evaluation of remedial treatment can be completed much sooner. When correlation between traffic conflicts with the accident data may be identified, an equation can be developed so that estimation can be done in another location with the same conflict characteristic using that equation. So that possibility of accident occurs at any other location can be identified by comparing correlation between traffic conflicts with the accident data. II. Literature Review Improving road safety is a worldwide political issue to be urgently tackled. In Malaysia, about 373,071 accidents were reported occurred consist of fatal, hospitalized, slightly injury and damage only in 2008according to the Royal Malaysian Police (RMP). From that, 5974 were reported as the fatal accident and 7019 were the hospitalized cases. The statistic of accident in Malaysia from 1990 – 2008. A recent statistics suggest that about 67% of accidents are caused mainly by some kind of human behavior error. 2.1 Road User Behavior Related to Traffic Safety A lot of conflicts happen at various points of a location such as in cross section, T-junction, Y-junction and mid-block. When total vehicles increase, it might contribute to higher potential of traffic conflict due to interactions among road users. At intersections, vehicle driver not only influenced by the rules of priority there, but also by the design of the intersection as well as the behavior of other road users. Study done by Summala et.al (1996) revealed that during the three year period in the city of Helsinki, 69% of all accidents between bicycles andcars occurring at unsignalized intersections involved drivers making a right turn and cyclist coming from the right. So to ensure this situation can be avoided, every road user has to take the intentions and behaviors of other road users into account. The process of selection the lane after vehicles are generated is to ensure that vehicles will reach the desired destination. When a lane is selected, the vehicle will proceed and try to enter an intersection. Vehicles on the major road are either being free in moving or in a platoon. Free moving can achieve the desired speeds that are controlled by the speed limit at the location. For the platoon situation, the speed will be determined by the vehicles that lead the platoon. The minor road consists of two sections, the approach section and the decelerating and or queuing section. Vehicles have lower speeds than the desired speed at the approach section because they are preparing to negotiate the intersection. 2.2 Traffic Conflict Survey To conduct traffic conflict survey, the study usually lead by the engineer that decide and determine the need of study, data supervision, schedule of site survey and supervises the result and analysis. The engineer also responsible to evaluate the finding and makes decisions and recommendations on the intersection improvement while the technician is normally responsible for field data collection. A traffic conflict survey usually takes from a few hours to several days of careful manual observation of traffic at an intersection. To assure uniform data collection, specific procedures are used so that valid comparisons can be made. A survey needs a few observers who do the task including recording dimensions and other details about the intersection such as type of traffic control devices used, observe and record traffic events. 2.3 Traffic Conflict Methodology Conflict study methodology for both conflicts and events has been used since 1960‟s. Conflict data are generally obtained when traffic volumes are the heaviest however congested conditions period are avoided. Conflicts and events are most often quantified in units of conflicts/events-per hour or conflicts/events-pre-1,000
  • 3. Study On Traffic Conlict At Unsignalized Intersection In Malaysia www.iosrjournals.org 41 | Page entering vehicles. Conflict rates for various maneuvers have been quantified by the Institute of Transportation Engineers (ITE) 2.4 Method of Traffic Conflict Study by U.S. Department Of Transportation, Federal Highway Administration (FHWA) Based on the Traffic Conflict Techniques For Safety and Operations-- Observers Manual produced by U.S. Department Of Transportation, Federal Highway Administration (FHWA), traffic conflict survey are done including making a conflict count along with collecting other data needed to make a complete study of the location. Traffic conflict data can be used along with traffic accident data, capacity analysis, signal warrants or other engineering data needed to identify problems and recommended improvements. i) Observation procedures include: ii) Number of personnel needed; iii) Approach legs to be studied; iv) Special conflict types (if any); v) Other data to be collected; and vi) Hours of observation needed. III. Methodology For the purpose of the study, To accomplish the objectives of the traffic conflict study at the unsignalized junction, several tasks were conducted as below: i. Perform literature review to provide sufficient information on traffic conflict study technique, its background and make a review of the previous result of a study done; ii. Selection of relevant accident data and study site also identify the individual study of intersections; iii. Develop the procedures of data collection, identify equipment needed and required sample size; iv. Collect the conflict data at the identified study intersections; and v. Do the analysis of the data collection 3.1 Selection of Accident Data and Study Area In this study, the first step is to determine a suitable location and it is selected based on location focused on the intersection. The intersection area can be defined as the area that are within the view of the data collection team and is, therefore subject to observation. The intersection area can be defined as that area which falls within the view of the data collection team and is, therefore, subject to observation. The intersection area should include all approaches and the area within 90 meters of the center of the intersection. A position is selected 30 - 90 meter from the intersection on one approach; the actual distance being determined by the amount of intersection area visible to the observer, space available for parking the observation vehicle. The unsignalized intersection selected where the T-junction and Y-junction.The traffic conflicts that occurred at the time of a signal violation were differentiated according to types. Selection of study location was based on the accident data collected. The accident data collected criteria were described further below. Based on the data, five (5) locations of unsignalized intersection were selected for the study. 3.1 Accident Data Accident data were collected based on the source of accident data from Royal Malaysia Police (RMP). The data were collected from Borang POL-27 that is the form used by the RMP to collect information about each of an accident. The form has all the important information about the accident including time of accident, date, location, type of injuries, types of vehicles involved, number of people injured, death or hospitalized and also a sketch of how the accident happened and others information. All this information was then analyzed to select the best location to do the conflict study. This study used the data between latest 2 -3 years at the selected intersection depends on the availability of accident data. Year selected were 2008, 2009 and 2010. 3.1.1 Traffic Conflict data For collection of traffic conflict data, selection of location is based on the accident data collected. For this study, data collection of conflict data was selected from the list of the following criteria: i) Location set up near the junction to observe the road user character; and ii) The locations selected is not near bus stop, petrol station etc. to keep off modification maneuvers from road users. 3.2 Measuring Devices and Data Collection Methodology Conflicts were possible between all types of road users including pedestrians. Video camera used to record types of traffic conflict and road user involved at the study intersections that were selected. The study
  • 4. Study On Traffic Conlict At Unsignalized Intersection In Malaysia www.iosrjournals.org 42 | Page was done based on the Traffic Conflict Techniques For Safety and Operations-- Observers Manual produced by the U.S. The observation and recording method is an on-site, online record of the incidence and severity of the traffic conflict. The observations were made for one day at each intersection. Methodology done by Zegeer and Dean in 1978 in their research is by use the collected data for 15 minutes each hour to an 11 hour count day and multiplied each of the count by four to estimate each hourly count. From their study, they found that conflict data could be limited to peak hours because other periods were uneventful. So for this study, conflict data taken at the peak hours time at daylight hours. Selected of peak hours time is divided to peak hours' time in the morning and afternoon or evening and were between ranges as below: i) 7.00 am – 11.00 am ii) 12.00 pm – 2.00 pm iii) 4.00 pm – 7.00 am The data were taken at daylight time for optimum visibility. Also the data were recorded during the peak hour period to ensure capturing the greatest interaction between non motorist and motorist traffic. The recordings of data were not undertaken during off peak period because under such conditions, it would not obtain good and high interaction between road users. Total time collected for the conflict data were for 4 hours for each location in one day. 3.4. Procedure for Data Collection Four hours traffic conflict study was conducted at each of the intersections selected. No traffic breakdowns including congestion, signal failure, or weather conditions were experienced that inhibited the data collection process. After the data requirement clarified and apparatus prepared, on-site data were collected using video recording technique. Both traffic conflict and traffic volume event data were recorded during the data collection period. The video data collected using the video as a backup to the manual data collection. Video formatting is depending on the video source, it may be necessary to encode video in suitable format for processing and correct recording artifacts. For this study, a digital video recorder was used that encoded suitable video format. i) One digital video recorder was set up at suitable locations and height where full view of the study sites that captured all the traffic movement at the selected sites at the specified time periods as decided earlier. ii) For this technique, it required two corresponding persons at the sites in order to observe the proper video recording and install the video. iii) The system consisted of a portable video camera, tripod and a computer. iv) Then, the filming traffic operations captured on-site were converted into media video file type. The media video files then replayed on a computer and interpreted until entire necessary data were accomplished on the traffic laboratory. IV. Results 4.1 Introduction Five unsignalized intersections were selected for the traffic conflicts study as shown in Table 4.1 below. Two (2) types of unsignalized intersection were selected to carry out the conflict study that is Y-junction and T- junction. Selection of intersections was based on the accident data collected for 3 years data from 2008 to 2010. Selection of conflict study location carried out also based on an accident at the location for at least 3 accidentsoccurred within 3 years. Accident involving damage only is not considered in the selection of the study location. The traffic conflict data were collected for 4 hours at the peak hour between morning to evening. All the traffic conflict data are captured and analyzed. The traffic movements were referring to Malaysian driver that was the right hand rules. The observation was made using the video camera to capture the traffic movement at the location. Then the data were analyzed using a computer to observe any conflicts at the intersections. Table 4.1 : Details of selected unsignalized Intersection No. Location Route No. Type of Intersection Section No. No. of Lanes (per direction) 1 Simpang Jalan Bomba, Jalan Klang-Teluk Intan FT005 Y-Junction 496 2 2 Simpang Bagan Tengkorak, Jalan Klang-Teluk Intan FT005 Y- Junction 497 2 3 Simpang Tiga Rasa, Jalan Kuala Lumpur-Ipoh FT001 T-Junction 441.5 1 4 Pekan banting, Jalan Klang- FT005 T-Junction 400 2
  • 5. Study On Traffic Conlict At Unsignalized Intersection In Malaysia www.iosrjournals.org 43 | Page 4.2 Accident Data Collection A total of 32 accident data were collected for further comparison with the conflict data observed at the sites for the five (5) unsignalized intersections. The total of accident for three years range between 3 accident to 10 accidents where Simpang Bagan Tengkorak and Simpang Jalan Waja recorded the highest total of accident for those years. Most of the accidents involving serious injury involving 16 accident following by 10 slightly injury and 6 cause death. There are total 66 vehicles involved for in all the accidents and further details will be discussed later. Table 4.2 : Accident characteristic at unsignalized junction No. Location Total Accident (3 years) Total Vehicles Involve Type of Injury Death Serious Injury Slightly Injury 1 Simpang Jalan Bomba, Seksyen 496 Jalan Klang-teluk Intan 3 6 2 1 0 2 Simpang Bagan Tengkorak, Seksyen 497 Jalan Klang-teluk Intan 9 18 2 1 6 3 Simpang Tiga Rasa, Seksyen 441.5 Jalan Kuala Lumpur-Ipoh 6 12 2 1 3 4 Pekan banting, Seksyen 400, Jalan Klang-Banting-Port Dickson 4 10 0 3 1 5 Simpang Jalan Waja, Teluk Panglima Garang. Seksyen 419, KM19 Klang,Jalan Klang-Banting-Port Dickson 10 20 0 10 0 TOTAL 32 66 6 16 10 4.3 Analysis of Conflict and Accident Data 4.3.1 Types of vehicles Involve in Accident and Conflict From the graph in Figure 4.1 show that both conflicts and accidents involved cars were the highest percentage of the total of conflict and accident data followed with the motorcycle and other vehicles. Differences involving a car and a motorcycle were that conflict involving car was higher (79.7%) compare to motorcycle (7.1%). However for accident data recorded, the accident involving a car and motorcycle show smaller differences where percentage involved in an accident was 47.0% for car and 39.4% of motorcycle. For bus and involving animal, there was no accident recorded. Figure 4.1 : Types of Vehicles Involve in Accident and Conflict Figure 4.1 : Types of Vehicles Involve in Accident and Conflict Banting-Port Dickson 5 Simpang Jalan Waja, Teluk Panglima Garang. KM19 Klang, Jalan Klang-Banting-Port Dickson FT005 T-Junction 419 4 Conflict Accident
  • 6. Study On Traffic Conlict At Unsignalized Intersection In Malaysia www.iosrjournals.org 44 | Page 4.3.2 The correlation between Types of Vehicles Involve in Conflict and Accident The value of the correlation coefficient in the Table 4.4 showed that there is positive value of correlation between accident with conflict for the car, pedestrian, lorry and van that are 0.44, 0.69, 0.02 and 0.06. But car, lorry and van showed a weak correlation between accident and conflict because the value of correlation coefficient was less than 0.5. The value of 0.5 for correlation coefficient was takes into consideration to indicate weak or strong correlation between those two variables. For the motorcycle and bicycle, both data shownegative values of correlation coefficient that were - 0.45 and -0.25 for accident and conflict relationship. For the bus and animal, no correlation shown between accident and conflict because there was no data for accident collected. 4.4 Analysis of correlation between conflicts and accidents for different types of conflict/accident The correlation coefficient used to identify the correlation that exists between conflict and accident by the types of conflict and accident. From the table 4.5 (a), it shows that the highest conflict involving slow vehicle same direction conflict that is 103 conflicts, following by 42 conflicts for slow vehicle same direction for secondary conflict and 23 conflict for type of opposing right turn conflict. Most of the correlation coefficient shows negative values that referto no significant correlation between total types of conflict with the total accident for the same types. The highest positive correlation that analyzed was for type of right turn cross traffic from left conflict and the correlation coefficient value is 0.77. The value is referred as strong relationship because the value of correlation coefficient was more than 0.5. For right turn same direction conflict/accident, the value is 0.48 followed by slow vehicle same-direction conflict/accident (0.33). Both types of conflict/accident show a weak relationship between conflict and accident because the value is less than 0.5. 4.4.3. Linear Regression Graph Analysis for Types of Conflicts and Accidents The graph plotted below shows the relationship between conflicts with the accident of differences type of conflict/accident. There are 6 graphs plotted for each type of conflict/accident and each of the graph show difference linear relationship. From the entire graph, 6 equations were obtained from the graph with each of the graphs show different value of the equation. Figure 4.2: Relationship between accident and conflict for same direction Conflict/accident y = 0.005x + 2.262 0 1 2 3 4 5 6 7 0 10 20 30 40 50 Accident Conflict Accident vs Conflict (Type :Same Direction)
  • 7. Study On Traffic Conlict At Unsignalized Intersection In Malaysia www.iosrjournals.org 45 | Page Figure 4.3: Relationship between accident and conflict for opposing right turn Conflict/accident Figure 4.5: Relationship between accident and conflict for cross traffic/accident From left cross street approach y = -0.044x + 1.203 0 0.5 1 1.5 2 2.5 3 3.5 0 2 4 6 8 10 Accident Conflict Accident vs Conflict (Type : Opposing Right-Turn Conflict/Accident) y = 0.203x - 0.055 -1 0 1 2 3 4 0 5 10 15 Accident Conflict Accident vs Conflict (Type : Cross-Traffic Conflicts/Accident From Left Cross Street Approach)
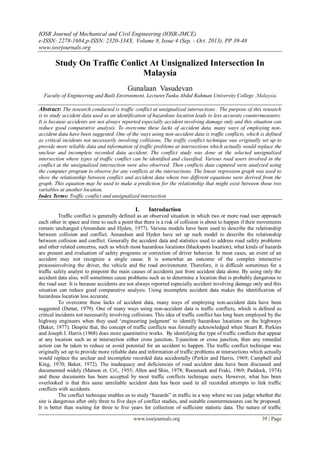
  • 8. Study On Traffic Conlict At Unsignalized Intersection In Malaysia www.iosrjournals.org 46 | Page Figure 4.6: Relationship between accident and conflict for cross-traffic Conflict/accident from the right cross street approach Figure 4.7: Relationship between accident and conflict for secondary Conflict/accident 4.4.4 Linear Regression Graph for Analysis of Relationship between conflict and accident data The linear regression graph method used to show the relationship between conflict and accident data. The graph in Figure 4.8 below shows the relationship between conflicts with the accident. It was found that conflicts per 4 hours were related to average accidents from three year total. The equation derived from the linear graph is y = 0.03x+ 4.789 where y is the value of accident data and x is the value of conflict. y = -0.923x + 7.692 0 0.5 1 1.5 2 2.5 3 3.5 4 4.5 0 2 4 6 8 10 Accident Conflict Accident vs Conflict (Type : Cross-Traffic Conflicts/Accident From Right Cross Street Approach y = -0.024x + 0.654 -0.4 -0.2 0 0.2 0.4 0.6 0.8 1 1.2 0 10 20 30 40 Accident Conflict Accident vs Conflict (Type : Secondary)
  • 9. Study On Traffic Conlict At Unsignalized Intersection In Malaysia www.iosrjournals.org 47 | Page 4.4.5 Linear Regression Graph for Analysis of Relationship between conflict/traffic Volumes and accident data To get a better linear graph, the traffic volume data were taken into consideration for total of conflict occurred as shown in Figure 4.9. Linear regression graph then were also used to show the linear relationship between data of conflict/traffic volume with the accident. The equation derived from the linear graph is y= 27.06x+ 6.167 where y is the value of accident data and x is the value of conflict/traffic volume. Table 4.6 : Conflict and traffic volume Figure 4.9: Relationship between the Conflict/Traffic Volumes with the Accident y = 27.06x + 6.167 0 2 4 6 8 10 12 0 0.005 0.01 0.015 0.02 0.025 Accident Conflict/ traffic volume Accident vs Conflict/ traffic volume Location Total Conflict (4 hour) Total traffic volume (4 hour) Average total traffic volume (1 hour) conflict/Total traffic- 4 hour Simpang Jalan Bomba, Jalan Klang- teluk Intan 19 7368 1842 0.0026 Simpang Bagan Tengkorak, Jalan Klang-teluk Intan 53 6288 1572 0.0084 Simpang Tiga Rasa, Jalan Kuala Lumpur-Ipoh 100 4260 1065 0.0235 Pekan banting, Jalan Klang-Banting- Port Dickson 46 12567 3142 0.0044 Simpang Jalan Waja, Teluk Panglima Garang. KM19 Klang,Jalan Klang- Banting-Port Dickson 50 12128 3032 0.0041 TOTAL 268
  • 10. Study On Traffic Conlict At Unsignalized Intersection In Malaysia www.iosrjournals.org 48 | Page V. Conclusion As a conclusion, all the objectives of this study are achieved. Conflict data from various sites were compared with different combinations of conflicts, types of vehicles and traffic volume. The comparison shows that value of correlations for data compared between conflict and accident for different types of vehicles is enough to showthe inconsistencies relationship between those two variables. Overall, the study showed a weak accident and conflict relationship. This study did not provide strong conclusive between conflicts and accident data at the unsignalized intersection. This might cause by inadequate numbers of intersections to be studied due to limited time of study. It also might influence by short period of observation for the conflict data. This also caused by the limitation of time and sources of observer and facilities used. It also was problematic due to inadequate data of accidents or reporting accident at the locations studied. However, this study provides useful insight into the correlation between accident and accident where two equations derived for relationship between those two variables. This equation may be used to make a predictionoftotal accident that might occur when conflict amount are known. This can be the good starting to do a more detail studyof this relationship withthe traffic situation at the intersection in Malaysia by study others aspect related to this conflict and accident at the location. The important conclusion of this study is that using conflict data at a location for a treatment planning may not immediately result in reducing accident rates at an unsignalized intersection. Recommendations for Future Research Based on recent research studied To get and produce a better result for this study, a few factors should be considered including: I. Details studies for the conflict study at an unsignalized intersection including another type of intersection such as four legged intersections. II. Much more time taken to count the conflict data, are useful to identify the main types of conflict occurred at the intersection and studied the reason why this conflict happen at the location. III. All the observers should understand the procedures and specifications of the study well to make sure the location selected for the conflict data observation was at the right location. IV. Control the other variables that might affect the result such as differences width of lanes and also the number of lanes. As for this study find out that there is a small value of correlation between traffic conflict and accident, so further study are required to verify this study and to reach the acceptable level of statistical correlation between conflicts and accidents. Also other study may be needed to look further into the equations derived from this study. So for future improvement, agencies involving with the problem of accident can make a good prediction the amount of accident that may occur at an unsignalized intersection only based on the equations so treatment to avoid the potential of accidents can be done. Reference [1] Allen, B.L., Shin, B.T. and Cooper, P.J. (1978). Analysis of Trafsic Conflicts and Collisions. Report No. TRR 667, pp. 67-74. Transportation Research Board. [2] Amundsen, F.; Hyden, C. (1977). Proceedings of first workshop on traffic conflicts. Oslo, Institute of Transport Economics. [3] Archer, Jeffery (2001).Traffic Conflict Technique Historical To Current State-Of-The-Art. Trita-Infra 02-010. Stockholm. [4] Baker. W.T. (1972). An Evaluation of the Traffic Conflicts Technique. Report No. HRR 384, pp. 1-8. Highway Research Board. [5] Brown, G. R. (1991). Use Of Traffic Conflicts For Near-Miss Reporting. In: Near-miss registration as a safety tool. Oxford, Butterworth-Heinemann; U.K.: pp. 111-125. [6] Fruhman, R.(1993). Safety Evaluation of Traffic Systems: Traffic Conflicts and Other Measures. Proceeding of the 6th ICTCT Workshop. Austrian Road Safety Board, Salzburg; pp. 291-296. [7] G. Tiwari, D. Mohan and J. Fazio. (1998). Conflict Analysis for Prediction of FatalCrash Locations in Mixed Traffic Streams. In Accident Analysis and Prevention, Vol. 30, No. 2, pp. 207-215. Great Britain: Elsevier Science Ltd. [8] Gunilla M. Bjorklund and Lars Aberg. (2005). Driver Behaviour In Intersections: Formal and Informal Traffic Rules. Transportation Research Part F 8, pp. 239–253. [9] Harris, J.I. & Perkins, S.R. (1968). Traffic Conflict Characteristics: Accident Potential At Intersections. Highway Research Record. 225, pp45-143, Highway Research Board, Washington DC. [10] Herman W. Kruysse, Gert Jan Wijlhuizen. (1992). Why Are Experts Not Better In Judging the Danger of Filmed Traffic Conflicts. Accident Analysis & Prevention. Vol. 24. No. 3. pp. 227-235. [11] Hoong-Chor Chin and Ser-Tong Quek (1997). Measurement of Traffic Conflicts. Journal of Safety Science Vol. 26. No. 3, pp. 169- 185. [12] Jian Jon Lu. (2005, November). Determination Of The Offset Distance Between Driveway Exits And Downstream U-Turn Locations For Vehicles Making Right Turns Followed By U-Turns. Summary of Final Report, Bd.544-05. [13] Jutaek Oh, Eungcheol Kim, Myungseob Kim, Sangho Choo. (2010). Development of Conflict Techniques For Left-Turn and Cross- Traffic At Protected Left-Turn Signalized Intersections. Journal of Safety Science 48, pp. 460 -468. [14] Navin, F. P. D.(1991). Computational techniques in Transportation Engineering. Proceedings, 4th International Conference on Computing in Civil and Building Engineering, Tokyo, Japan. [15] R., Zegeer, C.V., (1989a). Traffic Conflict Techniques for Safety and Operations: Engineer‟s Guide. FHWA-IP-88-026.