SlideShare a Scribd company logo
1 of 13
Download to read offline
International Journal of Advanced Engineering, Management and Science
(IJAEMS)
Peer-Reviewed Journal
ISSN: 2454-1311 | Vol-7, Issue-7; Jul, 2021
Journal Home Page: https://ijaems.com/
Article DOI: https://dx.doi.org/10.22161/ijaems.77.7
This article can be downloaded from here: www.ijaems.com 32
©2021 The Author(s). Published by Infogain Publication.
This work is licensed under a Creative Commons Attribution 4.0 License. http://creativecommons.org/licenses/by/4.0/
Performance of a two Chambers Reactor for the
Treatment of an Oily Effluent by Electro flocculation
Thalys de Freitas Fernandes1
, Gerônimo Barbosa Alexandre2
, Matheus Albuquerque de
Saturno3
, Ana Paula Trindade Rocha4
, José Nilton Silva5
, Gilmar Trindade de Araújo6
1,4,5,6
Federal University of Campina Grande - UFCG, CCT, Campina Grande Campus, Paraíba, Brazil.
2,3
Federal Institute of Pernambuco - IFPE, EBTT, Garanhuns Campus, Pernambuco, Brazil.
Received: 09 Jul 2021; Received in revised form: 07 Jul 2021; Accepted: 14 Jul 2021; Available online: 25 Jul 2021
Abstract— This work had as objective the development and analysis of a continuum flow reactor and
measure its efficiency in the treatment of residual water of the biodiesel purification process using electro
flocculation. The reactor was designed with two interconnected chambers with an 0.2 cm opening between
then and reaction volume was 0.883 L and an electrolytic area of 351 cm². The electrodes were all aluminum,
which were arranged in parallel and with 0.5 cm spacing, whose power was supplied by a DC source. As
design variables, the influence of electrical potential (U) and residence time (τ) on: current density, final pH,
removal of oils and greases, COD (Chemical Oxygen Demand), turbidity and total solids, in addition to
quantification of the sludge mass obtained and the energy cost of the reactor. The best performance was for
a potential of 6.0 volts and a τ of 29.43 min, with 90% removal of oils and greases, 53% COD and 4.38 g of
sludge, culminating in an energy consumption ranging from 0.708 kWhm-3
to 4.73 kWhm-3
. In addition, by
visual analysis of the formation of bubbles and the removal of turbidity (94%), it was concluded that the
division of the reactor in two chambers reduced the secondary contamination of the treated effluent.
Keywords— electrochemical process, continuous system, effluent treatment, environment.
I. INTRODUCTION
The biodiesel production process, for the most
part, is based on the use of homogeneous catalysts, usually
Sodium Hydroxide (NaOH) or Potassium (KOH) (Lage et
al., 2019; Gunaya et al., 2019). In this production route,
water is generally used to purify the synthesized biodiesel,
which at the end of the process generates a proportion of
three liters of wastewater for each liter of synthesized
biodiesel (Manique et al., 2012). Therefore, this effluent is
alkaline and contains a high content of oils and greases
(Chavalparit and Ongwandee, 2009; Meneses et al., 2012).
However, this wastewater contains low
concentrations of nitrogen and phosphorus, making an
eventual biological treatment, in itself, ineffective (Asia,
2003; Oliveira et al., 2018; Menezes et al., 2017). Other
treatment alternatives using only metal salts such as
polymers and polyelectrolytes have been used, however,
they are expensive, generate excess coagulant materials,
and can even lead to secondary pollution (Jun Lu et al.,
2015).
Lately, an electrochemical technique has been
studied, which although it is still little applied industrially,
has aroused a lot of interest due to its simplicity of operation
and application in different types of treatment, for example:
in textile effluents (Manenti et al., 2014), in waters that
show color (Bani-Melhem and Smith, 2012), waters
containing pharmaceutical residues (Chou et al., 2011),
effluents contaminated with heavy metals (Zhu J et al.,
2011), oily effluents (Chavalparit and Ongwandee, 2009;
Meneses et al., 2012; Fernandes et al., 2015; Ammar et al.,
2019). This is electro flocculation (EF), whose technique is
the sum of three sub-processes: coagulation, flotation and
electrochemistry (Moussa et al., 2017).
As shown in Fig.1, in an electrochemical reactor
containing a set of sacrificial electrodes immersed in the
effluent, an electric potential (U) is applied and as a
consequence, an electric current is generated in the medium.
Thalys de Freitas Fernandes et al. International Journal of Advanced Engineering, Management and Science, 7(7)-2021
This article can be downloaded from here: www.ijaems.com 33
©2021 The Author(s). Published by Infogain Publication.
This work is licensed under a Creative Commons Attribution 4.0 License. http://creativecommons.org/licenses/by/4.0/
Electronic mobility initially allows oxidation of the anode,
releasing the metal (M) in ionic form (Mn+
). These will then
react with hydroxyls (OH-
) generated at the cathode,
forming M (OH)n, which is the main coagulation agent in
the medium, in addition to forming other compounds such
as: M (OH)2+,
M2(OH)24+,
M(OH)2+,
M(OH)4−
, M6(OH)15
3+
(Holt et al., 2002; Yang Liu et al., 2018). Parallel to
coagulation, there is the formation of hydrogen gas (H2) at
the cathode and oxygen (O2) at the anode, which are
responsible for the flotation phenomenon, that is, most of
the coagulated material that is not decanted, adheres to the
bubbles and is carried to the reactor surface (Tezcan Un et
al., 2013).
Fig.1: View of the components generated between two sacrificial metal electrodes (M), in the electro flocculation process.
(Designed by the author).
Lately, a lot of work has been done to improve the design
of EF reactors, aiming to improve the efficiency of
contaminant removal (Abdelwahab et al., 2009; Chaudhary
and Sahu, 2013; Hamdan and El-Naas, 2014; Fernandes et
al., 2015; Ammar et al., 2019). With EF experiments, it has
been observed that the flotation of particulate material to the
reactor surface can be considered a critical step in this
process, since the coalescence between bubbles and
contaminating particles needs to be effective for the set to
reach the top of the reactor (Leite, 2009).
According to II'In and Sedashova (1999), this
contact is controlled by hydrodynamic interactions between
bubbles and particles, which, in turn, requires intrinsic care
with the electric field generated in the medium, with the rate
of agitation and with the flow of reactor supply, otherwise
the bubbles will burst and contaminate the effluent again
(Fig.2).
Fig.2: EF flotation process: a) pollutant and H2 and / or O2 gas bubble isolated; b) gas bubble and pollutant adhered and
emerging to the surface; c) particles of the pollutant diffusing in the liquid medium after the bubble ruptures. (Designed by
the author).
Thalys de Freitas Fernandes et al. International Journal of Advanced Engineering, Management and Science, 7(7)-2021
This article can be downloaded from here: www.ijaems.com 34
©2021 The Author(s). Published by Infogain Publication.
This work is licensed under a Creative Commons Attribution 4.0 License. http://creativecommons.org/licenses/by/4.0/
However, what has been observed is that even with
the strict attention given to the control of these parameters,
gas bubbles tend to burst naturally, due to the pressure
difference that they are subjected to when reaching the
reactor's liquid surface. Therefore, in order to minimize the
effect caused by the explosion of gas bubbles, this work
aimed to develop an electrochemical reactor with
continuous flow and consisting of two chambers, to analyze
it for efficiency in the treatment of wastewater for the
purification of biodiesel.
II. MATERIALS AND METHODS
2.1. Electro flocculation reactor design
Fig.3 shows the schematic drawing of the EF
reactor with the electrodes connected to a direct current
source (DC), as well as the numbering of each component,
as detailed in the legend. The reactor has the following
dimensions: 10 cm long, 23.5 cm high and 4.7 cm wide. The
total volume is 1,034 dm³ and the reaction volume is 0.883
dm³. There are also two streams, one for feeding and another
for the outlet of the treated effluent, in addition to a 25º
inclined gutter at the top, for the drainage of wet sludge,
coagulated and flotated material.
Fig.3: Design of the EF reactor coupled to the DC source:
1-effluent inlet, 2- electrochemical cell chamber, 3-sludge
removal channel, 4 - second reactor chamber, 5 - treated
effluent outlet, 6 - DC source. (Designed by the author).
The electrochemical cell is composed of four
aluminum electrodes whose purity is 96.89%. Each
electrode is 0.1 cm thick and has a total area of 128 cm².
They were distributed alternately, respecting a fixed
distance of 0.5 cm between anodes and cathodes, as studied
by Meneses et al., (2012) and Fernandes et al., (2015). The
effective reaction area was totaled 351 cm².
The passage of the effluent from the first to the
second chamber occurred through an opening of 0.2 cm
located at half the height of the reactor (Fig.4). This idea
was supported by the observations made by (Georg et al.,
2008). Who affirms that a gas bubble suspended in a viscous
medium is basically spherical and follows an upward and
rectilinear trajectory, since the upward vertical tensions,
drag Force (Fd) and Thrust Force (Ft), which act on the
particle (bubble + pollutant), prevail over the gravitational
Force (Fg) and horizontal frictional forces (Ff).
Therefore, knowing that the biodiesel effluent has
a viscous aspect, it was deduced that most of the particles
must emerge in the first chamber of the reactor and that a
minority follows a horizontal path towards the second
chamber.
Fig.4: Highlight for the access between the EF reactor
chambers and the field of hydrodynamic forces that act on
a coagulated particle (contaminant + bubble). (Designed
by the author).
2.2. Analytical Techniques
The pH was measured with a bench pH meter of
the brand pH Meter, model Instrutherm pH - 1900, with
automatic temperature compensation and reading range
from 0.0 to 14 and accuracy of 0.01. The electrical
conductivity was measured by direct reading with a
TECNOPON conductivity meter, model mCA - 150, with a
measurement range between 0.01 and 2000 µScm -1
and
resolution of 0.1 µScm -1
. Turbidity was measured with a
HACH turbidimeter, model 2100P, with a scale of 0.0 to
1000 NTU and precision of 0.01 NTU. The concentration
of total solids (TS) was determined by the gravimetric
method, using a SOLAB oven, model SL 102, with a
capacity of 150 L and automatic programming, whose
drying temperature of the samples was (103 ± 2) ºC. The
concentrations of oils and greases (O&G) and the chemical
oxygen demand (COD) were determined with an Agilent
Technologies spectrophotometer; model Cary 60 UV-vis.
For COD, samples were previously digested in a
Thalys de Freitas Fernandes et al. International Journal of Advanced Engineering, Management and Science, 7(7)-2021
This article can be downloaded from here: www.ijaems.com 35
©2021 The Author(s). Published by Infogain Publication.
This work is licensed under a Creative Commons Attribution 4.0 License. http://creativecommons.org/licenses/by/4.0/
MARCONI DRY BLOCK MA4004 digesting block, at a
temperature of 150ºC for a period of 2 hours. The oils and
greases were previously separated by hexane extraction. All
analyzes were adapted from the American Public Health
Association (APHA, 2005) and Gobbi (2013).
2.3. Waste water from biodiesel purification
The wastewater was obtained synthetically at an
ambient temperature of 25ºC. Soybean oil (2.01 gL -1
),
biodiesel (4.01 gL -1
) and glycerin (1.36 gL -1
) were inserted
in the reactor feed tank, with a capacity of 8.0 L, according
to values determined by (Chavalparit and Ongwandee,
2009), for biodiesel wastewater. The mixture was subjected
to mechanical stirring at 700 rpm, with a Stainless Steel 304
stirrer, model DLMYP2011-100, for a period of 30 min,
until an apparently stable emulsion was obtained, with an
alkaline pH ranging between (9 - 11). The brand soy oil
(LISA), 100% vegetable, was purchased in local stores,
while biodiesel and glycerin were synthesized by the
transesterification process, via homogeneous catalysis, at
the Chemistry and Biomass Laboratory (LQB or CBL) of
the Science Center and Technology, UFCG, Brazil. 1M
aqueous solutions of HCl and NaOH, previously prepared,
were used to adjust the pH of the emulsion to 8.0, the pH of
the experiment. According to (Mansoorian et al., 2014;
Gatsios et al., 2015; Moussa et al., 2017), for pH values
between 6 and 9 a good formation of coagulating agents in
EF is achieved. Conductivity was measured right after
adjusting the pH.
2.4. Reagents and solutions
All chemical reagents were of analytical purity
grade and were used without pretreatment. The effluent was
prepared with local water supply, whose average
conductivity was 217 µScm -1
and pH equal to 7. The
solutions used in the physical-chemical analyzes and for pH
control were prepared with pure material, using water
distilled with an average conductivity of 1.0 µScm -1
.
2.5. Experimental planning
The performance evaluation of the reactor was
carried out with the control over two system factors:
Residence Time (τ) and Electric Potential (U), varying
between the levels, low (17.6 min and 3.6 volts) and high
(29.43 min and 6.0 volts), as shown in Table 1.
Table 1: Factors and experimental levels.
Exp.*
τ U
(min) (volt)
1 17.66 3.6
2 17.66 6.0
3 29.43 3.6
4 29.43 6.0
*Experiments
The levels were chosen based on studies by
(Fernandes et al., 2015), which analyzed an electrochemical
reactor with a tubular geometry and aluminum electrodes
for treating oily water, yielding removals above 80% for oils
and greases. In this study, the volumetric flow rates of the
reactor inlet varied between 0.03 and 0.05 Lmin-1
.
Therefore, for these two extremes, knowing that the
proposed reactor useful volume was 0.883 L, the theoretical
residence times were calculated (Table 1), using Eq. (1)
(Gardiman Junior et al., 2019).
V
v
 =
(1)
Using τ in (minutes), V the useful volume of the reactor in
(L) and ν the volumetric flow of the reactor inlet in (Lmin-
1
).
As response variables were analyzed: the density
of electric current (DC), the final pH, the concentrations of
O&G, COD, TS, turbidity, in addition to the sludge mass
and energy consumption (EC). All were analyzed for
behavior over the treatment time, with O&G, COD,
turbidity and TS being analyzed as removal efficiency (%),
calculated from Eq. (2) (Fei Liua et al., 2019).
0
0
(%) 100%
i
C C
C
−
= 
(2)
Adopting (C 0) the concentration measured at time t 0 = 0
min and (Ci) the concentration of the variable analyzed at
time ti different from zero.
The behavior of the electric current (I) generated in
the reaction medium was also monitored in the DC source,
whose values were applied to Eq. (3) to calculate the energy
(E) spent with the EF reactor, which was used to calculate
energy cost (EC) using Eq. (4).
( )
3
/ m
t
U I t
E kWh m
V
 
=
(3)
( )
3
$ / i
EC R m E t
= 
(4)
E is given in (R$m-3
), ti the tariff defined by the energy
concessionaire of each state or country given in R$(kWh)-1
,
U the potential difference in (volts), Im the average electric
current in (A), Vt the volume of effluent treated in (m³) and
∆t the time interval of experiment in (h).
Thus, based on the levels and factors presented,
four tests were performed in triplicate, totaling twelve
experiments. These were performed at random, according
to (Montgomery et al., 2004).
2.6. The continuous electro flocculation system
The set of equipment connected to the
electrochemical reactor formed the continuous EF system
(Fig.5). The tank (T-01) with capacity for 8L and a coupled
Thalys de Freitas Fernandes et al. International Journal of Advanced Engineering, Management and Science, 7(7)-2021
This article can be downloaded from here: www.ijaems.com 36
©2021 The Author(s). Published by Infogain Publication.
This work is licensed under a Creative Commons Attribution 4.0 License. http://creativecommons.org/licenses/by/4.0/
agitation system, contained the biodiesel wastewater, which
fed the reactor by a peristaltic pump of the brand BPT tube,
model KXF-DC-B08. This contained the valve (V-01),
which allowed adjusting the flow at the entrance to the
reactor (range from 0.003 to 0.08 Lmin-1
). A DC source,
which connected to the reactor, allowed adjusting the
electrical potential and monitoring the variation of the
electrical current throughout the process. At the top of the
reactor, the sludge generated during the electrochemical
process was removed, which was stored in the tank (T-02)
with a capacity of 3 L. In the outlet current for the treated
effluent, there was the valve (V-02) used to control the
liquid level in the reactor, the value of which remained at 14
± 1.0 cm throughout the treatment process. The treated
effluent was collected in the tank (T-03) and sent to perform
the physical-chemical analyzes.
Fig.5: Schematic diagram of the experimental configuration (T-01: biodiesel wastewater tank; PP peristaltic pump; V-01:
flow control valve; T-02: sludge tank; R-EF: electro flocculation reactor; F-DC: direct current source; V-02: valve for level
control; T-03: tank for the treated effluent). (Designed by the author).
2.7 Experimental procedure
The biodiesel wastewater was synthesized in the T-
01 tank, according to the procedure shown in sub-item 2.2.
Agitation was reduced from 700 rpm to 100 rpm after
preparation and maintained throughout the experiment, to
ensure homogenization of the emulsion. A 0.2 L sample was
collected to perform the physical-chemical analyzes at zero
time. The peristaltic pump was switched on and the volume
flow in the valve (V-01) was adjusted, according to the test
τ. When the reactor reached the operating liquid level, the
valve (V-02) was manipulated to keep it in the specified
range. With the hydrodynamic variables controlled, the DC
source was connected to the electrical potential of the
experiment and a timer was started. Samples of the treated
effluent were collected every 5 min to perform the physical-
chemical analyzes, and so on, until completing 40 min of
the experiment. At the end, the equipment was turned off
and the electrodes were washed with soap and water, using
steel anchors to ensure the complete scraping of
contaminants adhered to the aluminum plates.
III. RESULTS AND DISCUSSION
The physical-chemical characterization of the
wastewater purification of Biodiesel was performed and
listed in Table 2. It was observed that the conductivity, a
very important parameter of the process variables presented
values because, based on the initial pH was added a greater
or lesser volume of acid and/or alkaline solution to equalize
the pH in 8, the pH of the experiments. The initial pH varied
between (9 - 11), since the biodiesel and glycerin used in
the preparation of the effluent were non-pure and came from
a homogeneous catalytic process that used potassium
hydroxide (KOH) as a catalyst and methyl alcohol as
reagent. Therefore, in addition to the high alkalinity
resulting from potassium hydroxide, methyl alcohol
contributed to the wastewater to present a high quantity and
dissolved organic material.
Thalys de Freitas Fernandes et al. International Journal of Advanced Engineering, Management and Science, 7(7)-2021
This article can be downloaded from here: www.ijaems.com 37
©2021 The Author(s). Published by Infogain Publication.
This work is licensed under a Creative Commons Attribution 4.0 License. http://creativecommons.org/licenses/by/4.0/
Table 2: Results of physical-chemical analyzes for
wastewater from biodiesel purification.
Physical-chemical parameters Values
Initial pH 9 – 11
Experiment pH * 8
Temperature (ºC) 23 - 25
Conductivity (μScm-1
) 936.7-1198
Total Solids (gL-1
) 1.6317
Chemical Oxygen Demand (mgL-1
) 1276.03
Oils and Greases (mgL-1
) 1598.1
Turbidity (NTU) 236.83
* Value adjusted with 1M HCl and NaOH solutions.
3.1 Influence of residence time and electrical potential
The behavior of the electric current density was
monitored for each experiment and recorded according to
the profiles of (Fig.6). These values were obtained
according to (Kobya et al., 2016; Yang Liu et al., 2018),
calculating the ratio between the electric current registered
in the DC source, over time, by the sum of the reaction area
of all electrodes of the electrochemical cell, which is 351
cm². The initial conductivity for the experiments was 1063,
1198, 1192 and 936.7 μScm-1
, respectively. According to
Moussa et al., (2017), conductivity is essential for the
electrochemical processes of wastewater treatment, as it
guarantees the conduction of current in the environment and
reduces energy consumption.
Exp. (1 and 3) developed on the same average
current density, which was approximately 1.6 mAcm-2
.
Therefore, for a voltage of 3.6 volts, τ did not influence the
current density of the experiment. On the other hand, the
increase in voltage from 3.6 volts to 6 volts contributed to
the increase in the current density of the Exp. (2 and 4) in
comparison with the previous ones. This effect derives from
Ohm's first law: that the potential (U) is proportional to the
electric current (I) in the environment (Walsh, 1993). In
addition, according to Faraday's Law, in electrolysis, the
electric current is proportional to the amount of metal ions
(Al) that are sacrificed at the anode, as can be seen in Eq.
(4), (Gamage and Chellam, 2011; Tanneru and Chellam,
2012; Ammar et al., 2019).
3
Al
M I t
m
n F
+
 
=
 (4)
Adopting mAl
3+
is the mass of aluminum ions given off at
the anode, I the electric current, t the electrolysis time, n the
number of electrons in the redox reaction and F the Faraday
constant. Therefore, the greater the applied potential, the
greater the current density and, consequently, the greater the
number of ions present in the medium, which contribute to
sustaining the current at higher values (Priya and Jeyanthi,
2019).
A comparison between Exp. (2 and 4) shows that
for a voltage of 6 volts, the current density has stabilized at
3.6 and 4 mAcm-2
, respectively. This shows that the
increase in τ caused a sudden increase in current density, as
the consequent reduction in flow decreased the interaction
between aluminum cations (Al3+
) and hydroxy anions (OH-
). This resulted in a medium more saturated in ions than in
hydroxy aluminum compounds, contributing to a higher
current density value.
Fig.6: Current density behavior over the treatment time.
0
0.5
1
1.5
2
2.5
3
3.5
4
4.5
0 1 5 10 15 20 25 30 35 40
Current
density
(mAcm
-2
)
Time (min)
17,66 min; 3,6 volts 17,66 min; 6,0 volts
29,43 min; 3,6 volts 29,43 min; 6,0 volts
Thalys de Freitas Fernandes et al. International Journal of Advanced Engineering, Management and Science, 7(7)-2021
This article can be downloaded from here: www.ijaems.com 38
©2021 The Author(s). Published by Infogain Publication.
This work is licensed under a Creative Commons Attribution 4.0 License. http://creativecommons.org/licenses/by/4.0/
The changes in the pH behavior over the treatment
time were monitored and recorded according to the profiles
in (Fig.7), for an initial pH equal to 8. The graphic analysis
shows that the pH decreased for all experiments, stabilizing
in the range (6.53 and 7.35), as final pH. Behavior that was
also observed by (Meneses et al., 2012; Ammar and Akbar,
2018). With the exception of Exp. (2), the pH hardly
changed between the initial 10 min and showed a linear
trend for all tests in the interval from 0.0 to 25 min of
experiment, from which it became constant until the end of
the experiment.
Exp. (1 and 3) showed values approximately equal
to 7.0 for the final pH, verifying that for a voltage of 3.6
volts, the τ variation did not influence the final result.
However, when the voltage was increased to 6 volts in Exp.
(2 and 4), there was a small influence of τ on the final pH.
For an initial pH less than or equal to 8.0, the increase in
voltage caused the reduction of OH-
molecules, which gave
rise to cationic hydroxide species, such as Al(OH)2+
,
Al(OH)2
+
, Al2(OH)2
4+
, Al(OH)3 (Saur et al., 1996; Ammar
et al., 2019). However, the formation of these compounds
can be more accentuated, if the time that the anionic species
(OH-
) meet with the cationic species (Al3+
) is reduced. This
is the case of Exp. (2) when compared to Exp. (4), that is,
the reduction in τ, which is due to the increase in the
volumetric flow at the reactor inlet, favors greater agitation
of the medium. Thus, more hydroxy - aluminum compounds
are formed and, consequently, the reduction of free
hydroxyls decreases the alkalinity of the medium.
Fig.7: Influence of residence time and electrical potential on the final pH.
In Fig. (8 and 9) the behaviors of the variables,
efficiency of removal of O&G and COD, respectively, are
presented. The joint analysis of the profiles shows that for a
τ of 29.43 min and a potential of 6 volts it is possible to
obtain the greatest removals of oils and greases (90%) and
COD (53%), approximately.
According to (Ammar et al., 2019), for a pH
between 6 and 9, the greater the electrical potential the more
insoluble compounds of Al(OH)3 are formed, and the
greater the τ, the longer the interaction time between the
coagulant with the particles oily, allowing greater removal
by coagulation and, consequently, by flotation. In addition,
a higher τ implies a lower volumetric flow at the reactor
inlet, therefore, the less force the flow exerts on impurities
that are coagulated, minimizing their fragmentation and,
therefore, improving the removal of O&G and COD.
The greater efficiency of O&G and COD removal
contrasted with a higher generation of turbidity and TS. For,
for the same experimental conditions, more Al(OH)3 is
generated and, consequently, more insoluble material is
formed and dispersed in the medium. The profiles of
turbidity removal and TS are shown in Fig. (10 and 11),
respectively. As noted, the best removals (94%) and (49%)
were obtained for an electrical potential of 6 volts and an τ
of 17.66 min. That is, for the same amount of Al(OH)3
produced and for the same flotation rate, a shorter
interaction time between the impurities and Al(OH)3 results
in a lower coagulation rate of oily contaminants. As a
consequence, only the micro particles with a larger surface
area are removed, mostly, by flotation, as well as Al(OH)3,
which is also carried to the liquid surface, resulting in less
turbidity and TS.
6
6.5
7
7.5
8
8.5
0 5 10 15 20 25 30 35 40
pH
Time (min)
17,66 min; 3,6 volts 17,66 min; 6,0 volts
29,43 min; 3,6 volts 29,43 min; 6,0 volts
Thalys de Freitas Fernandes et al. International Journal of Advanced Engineering, Management and Science, 7(7)-2021
This article can be downloaded from here: www.ijaems.com 39
©2021 The Author(s). Published by Infogain Publication.
This work is licensed under a Creative Commons Attribution 4.0 License. http://creativecommons.org/licenses/by/4.0/
Fig.8: Influence of residence time and electrical potential on the removal of oils and greases.
Fig.9: Influence of residence time and electrical potential on COD removal.
Fig.10: Influence of residence time and electrical potential on the removal of turbidity.
0.0
20.0
40.0
60.0
80.0
100.0
0 5 10 15 20 25 30 35 40
O&G
removal
(%)
Time (min)
17,66 min; 3,6 volts 17,66 min; 6,0 volts
29,43 min; 3,6 volts 29,43 min; 6,0 volts
0.00
10.00
20.00
30.00
40.00
50.00
60.00
0 5 10 15 20 25 30 35 40
DQO
removal
(%)
Time (min)
17,66 min; 3,6 volts 17,66 min; 6,0 volts
29,43 min; 3,6 volts 29,43 min; 6,0 volts
0
20
40
60
80
100
120
0 5 10 15 20 25 30 35 40
Turbidity
removal
(%)
Time (min)
17,66 min; 3,6 volts 17,66 min; 6,0 volts
29,43 min; 3,6 volts 29,43 min; 6,0 volts
Thalys de Freitas Fernandes et al. International Journal of Advanced Engineering, Management and Science, 7(7)-2021
This article can be downloaded from here: www.ijaems.com 40
©2021 The Author(s). Published by Infogain Publication.
This work is licensed under a Creative Commons Attribution 4.0 License. http://creativecommons.org/licenses/by/4.0/
Fig.11: Influence of residence time and electrical potential on the removal of total solids.
The joint analysis on the efficiency of removing
O&G, COD, turbidity and TS, allows us to infer that it is in
the interval of 0.0 to 10 minutes that the highest rates of
removal of impurities from biodiesel wastewater are
obtained. In addition, it can be said that the removals
become practically constant after the 25 minutes of the
experiment. Characteristics that were also observed by
(Chavalparit and Ongwandee, 2009; Priya and Jeyanthi,
2019; Ammar et al., 2019).
3.2 Global analysis of the physical-chemical parameters
of the effluent
Fig.12 contains the best results for the physical-
chemical parameters of biodiesel wastewater after
treatment. It is possible to compare the results of the final
concentrations of O&G, COD, TS and turbidity, with the
respective initial values for effluent, before treatment, in
addition to also comparing them with the limits established
by Brazilian legislation (CONAMA, 2011).
As already seen, Exp. (4) presented the best results
for O&G and COD, with removals above 90% and 53%,
respectively. The low COD removal compared to oils and
greases is due to the large volume of alcohol used in the
synthesis of biodiesel, which cannot be removed by the
electro flocculation process (Chavalparit and Ongwandee,
2009). The COD removal efficiency was close to the values
obtained by (Siles et al., 2010) and (Chavalparit and
Ongwandee, 2009), 45% and 55%, respectively. However,
with lower O&G removal efficiency than that obtained by
those and by Meneses et al., (2012), for wastewater for the
purification of biodiesel. Exp. (2) had the best results for ST
and turbidity, with removals above 49% and 94%,
respectively.
The analysis of Fig.12 also shows that the only
parameter that meets the Brazilian legislation (CONAMA,
2011) is turbidity. Thus, even though the reactor has a good
efficiency in removing O&G and turbidity, the effluent
needs to undergo a post-treatment before being released into
the environment, because the high COD values (589.3 mgL-
1
) and TS (825 mgL-1
) may favor eutrophication of the water
environment (Menezes et al., 2017). A suggestion would be
the insertion of the same system in series, or a biological
system to reduce COD, or even decantation and/or post-
reactor PE filtration units to reduce the TS concentration.
0
10
20
30
40
50
0 5 10 15 20 25 30 35 40
TS
removal
(%)
Time (min)
17,66 min; 3,6 volts 17,66 min; 6,0 volts
29,43 min; 3,6 volts 29,43 min; 6,0 volts
Thalys de Freitas Fernandes et al. International Journal of Advanced Engineering, Management and Science, 7(7)-2021
This article can be downloaded from here: www.ijaems.com 41
©2021 The Author(s). Published by Infogain Publication.
This work is licensed under a Creative Commons Attribution 4.0 License. http://creativecommons.org/licenses/by/4.0/
Fig.12: Comparison between the best results obtained for the physical-chemical parameters of wastewater from biodiesel
purification.
3.3 Sludge removal
Sludge removal is directly related to the flotation
of contaminants previously coagulated and flocculated by
Al(OH)3 (Kobya et al., 2016). The EF reactor with two
chambers was developed with the prerogative that the
flotation occurred practically in the region where the
electrochemical cell was located. In (Fig.13) the upper
image of the reactor is shown, with emphasis on the H2(g)
and O2(g) bubbles, which emerged onto the liquid surface
surrounding the coagulated material, called wet sludge. It is
possible to notice that the bubbles ascended practically in
the first chamber, thus minimizing the contamination of the
effluent that flowed into the second chamber of the EF
reactor. This statement was ratified by the high removal of
turbidity (94%), since it represents all the insoluble organic
and inorganic solids in the medium (APHA, 2005), which
were largely removed in the first chamber.
The wet sludge collected by the reactor channel
was subsequently dried in the oven and quantified for all
tests, the values of which were presented in Fig.14.
According to the masses obtained, for a voltage of 3.6 volts
and regardless of residence time, practically the same
amount of sludge, Exp. (1 and 3), was obtained. On the other
hand, with the increase in electrical potential to 6.0 volts,
Exp. (2 and 4), the amount of sludge removed was
practically doubled. However, this amount is slightly higher
for Exp. (4), which operated with a τ equal to 29.43 min.
Therefore, it can be inferred that a greater amount of sludge
is obtained at the same time that significant removals of
O&G and COD are achieved.
Fig.13: Top view of the electro flocculation reactor used in
the treatment of wastewater for the purification of
biodiesel after an experiment. (Source: research’ image).
1598.1
1276.0
1631.7
236.8
144.7
589.3
825.5
12.3
50
400
500
40
0.0
300.0
600.0
900.0
1200.0
1500.0
1800.0
Oil &
Grease
COD Total
Solids
Turbidity
Content
(mgL
-1
or
NTU)
Initial value Final value CONAMA
Thalys de Freitas Fernandes et al. International Journal of Advanced Engineering, Management and Science, 7(7)-2021
This article can be downloaded from here: www.ijaems.com 42
©2021 The Author(s). Published by Infogain Publication.
This work is licensed under a Creative Commons Attribution 4.0 License. http://creativecommons.org/licenses/by/4.0/
Fig.14: Mass of dry sludge removed in the biodiesel wastewater PE process.
3.4 The energy consumed by the EF reactor
The energy (E) spent in the EF reactor for each m³
of treated effluent was calculated using Eq.3 for all
experiments, as shown in (Table 3). For this, it was
necessary to determine the volume of treated effluent (Vt)
and the current mean (Im), whose selected interval was
between 10 and 40 minutes (Fig.6), a period in which the
current density values became approximately constant.
With the values of E, the energy cost (EC) per m³ of treated
effluent was also calculated, multiplying E by the low
voltage industrial tariff, which is R$ 0.49766 per kWh,
according to (ENERGISA, 2020) to the state of Paraiba,
Brazil.
The analysis of Table 3 shows that the energy
consumption varied between 0.708 and 4.73 kWhm-3
, which
is equivalent to between R$ 0.35 and R$ 2.36 per m³ of
treated effluent. The highest consumptions occurred in the
experiments that obtained the greatest removal of
contaminants, that is, Exp. (2 and 4), respectively.
Electricity consumption was close to the values found by
Chavalparit and Ongwandee (2009); Meneses et al., (2012)
and Fernandes et al., (2015), who obtained respectively:
5.57 kWhm-3
, 0.65–2.33 kWhm-3
, 2.07 kWhm-3
, in the
treatment of biodiesel wastewater. Energy costs can be
minimized by optimizing this reactor, adding, for example,
renewable energy generators, such as photovoltaic or wind
systems (Rahmani et al., 2017).
Table 3: Results of the energy spent and the cost obtained with the EF reactor for 40 min of experiment.
Experiment τ U Vt Im E EC
(minutes) (volts) (L) (A) (kWh.m-3
) (R$.m-3
)
1 17,66 3,6 2 0,59 0,708 0,35
2 17,66 6 2 1,27 2,54 1,26
3 29,43 3,6 1,2 0,57 1,14 0,57
4 29,43 6 1,2 1,42 4,73 2,36
IV. CONCLUSIONS
The experimental results showed that:
1) the EF reactor reached its best removal efficiency when
it was operated with a potential of 6.0 volts and with a τ of
29.43 min, in which removals above 90% for oils and
greases and 53% for COD were achieved, in addition to
greater sludge removal (4.38g). On the other hand, for the
same applied potential, when the τ was reduced to 17.66
min, those removals were reduced and the reactor started to
obtain better performance for the removal of turbidity
(94%) and total solids (49%).
2) the electrical potential (U) and the residence time (τ) are
parameters that are intrinsically linked with the greater or
lesser formation of the coagulant agent - Al(OH)3 and,
therefore, influenced in all the system responses variables.
3) the visualization of gas bubbles on the liquid surface of
the first chamber of the reactor and their absence in the
second chamber, showed that the section of the EF reactor
1.88
3.92
2.06
4.38
0
1
2
3
4
5
1 2 3 4
Sludge
removal
(g)
Experiment
Thalys de Freitas Fernandes et al. International Journal of Advanced Engineering, Management and Science, 7(7)-2021
This article can be downloaded from here: www.ijaems.com 43
©2021 The Author(s). Published by Infogain Publication.
This work is licensed under a Creative Commons Attribution 4.0 License. http://creativecommons.org/licenses/by/4.0/
in two compartments was important to minimize the
contamination of the treated effluent, which left the reactor
through the second chamber, the results of which were
confirmed with the removal of more (94%) of turbidity.
4) the energy spent with the EF reactor proved to be
consistent with other values in the literature, which varied
between 0.708 and 4.73 kWhm-3
of treated effluent, the last
value being obtained for its best performance.
5) wastewater from the purification of biodiesel, still needs
to undergo a post-treatment before being released into the
environment, because it is an effluent with a high COD,
originating from glyceric organic matter and a large amount
of residual methanol, which could not be removed by
electro flocculation.
6) the EF reactor showed significant efficiency for the
removal of insoluble solids - oils and greases and turbidity
- when used in the treatment of wastewater for the
purification of biodiesel. However, it would be interesting
to combine it with another treatment system, for example,
an activated sludge, chemical coagulation system, or even a
physical separation system, such as filters and decanters, to
ensure better COD and total solids removal efficiency.
REFERENCES
[1] Abdelwahab, O., Amin, N.K., El-Ashtoukhy, E.S.Z., 2009.
Electrochemical removal of phenol from oil refinery
wastewater. J. Hazard. Mater. 163 (2 - 3), 711 - 716.
[2] Ammar, H.S., Akbar, S. A., 2018. Oil field produced water
treatment in internal-loop airlift reactor using
electrocoagulation/flotation technique. Chinese J. Chem.
Eng. 26, 879–885.
[3] Ammar, H.S., Ismail, A.D., Abbas, M. W., 2019.
Electrocoagulation technique for refinery wastewater
treatment in the internal loop split-plate airlift reactor.
Journal of Environmental Chemical Engineering. v.7, n.6,
103489.
[4] APHA. Standard Methods for Examination of Water and
Wastewater., 2005. 21th ed. Washington: American Public
Health Association.
[5] Asia, U. N. E. a. S. C. f. W., 2003. Wastewater Treatment
Technologies: a General Review. Economic and Social
Commission for Western Asia, United Nations.
[6] Bani-Melhem, K., Smith, E., 2012. Grey water treatment by
a continuous process of an electrocoagulation unit and a
submerged membrane bioreactor system. Chemical
Engineering Journal. 198 and 199, 201 and 210.
[7] Chavalparit, O., Ongwandee, M., 2009. Optimizing
electrocoagulation process for the treatment of biodiesel
wastewater using response surface methodology. Journal of
Environmental Sciences. v.21, n. 11, p. 1491-1496.
[8] Chaudhary, R., Sahu, O.P., 2013. Treatment of sugar
wastewater by electrocoagulation. J. Atmos. Pollut. 1 (1), 5
– 7.
[9] Chou, W.L., Wang, C.T., Huang, K.Y., Liu, T.C., 2011.
Electrochemical removal of salicylic acid from aqueous
solutions using aluminum electrodes. Desalination. 271, 55-
61.
[10] CONAMA - National Council for the Environment.
RESOLUTION n° 430, de 13 de March de 2011. Ministry of
the Environment. Available in
<http://www.mma.gov.br/port/conama>. Accessed in
20/05/2020.
[11] ENERGISA. Power Distribution Company in the State of
Paraiba. Website: www.energisa.com.br/. Accessed in
20/07/2020.
[12] Fernandes, F. T., Alexandre, B. G., Silva, N. J., Araújo, T.
G., 2015. Experimental plant for the treatment of effluent
from the production of biodiesel. Scientific Congress of
Engineering and Agronomy – CONTECC, v.2, p. 1-4.
[13] Fei L., Zhaoxiang Z., Zenglin W., Xiaqing L., Xiaodong D.,
Liqiang W., Xuewu W., Zhenhe Y., Jie Z., Mengxin C.,
Shuo W., 2019. Experimental study on treatment of tertiary
oil recovery wastewater by electrocoagulation. Chemical
Engineering & Processing: Process Intensification. 144,
107640.
[14] Gamage, N.P., Chellam, S., 2011. Aluminum
electrocoagulation pretreatment reduces fouling during
surface water microfiltration, J. Membr, v. 379 (1–2), p. 97–
105.
[15] Gardiman Junior, B. S., Garcia, G. O., Reis, E. F., 2019.
Definition of hydraulic retention time (trh) and efficiency in
the treatment of coffee wastewater by an electrolytic system.
Virtual Journal of Chemistry. 11 (1), 82 – 103.
[16] Gatsios, E., Hahladakis, J.N., Gidarakos, E., 2015.
Optimization of electrocoagulation (EC) process for the
purification of a real industrial wastewater from toxic
metals. J. Environ. Manag. 154, 117-127.
[17] Georg, C.I., Rezende, P.V.R., Maliska, R.C., 2008.
Numerical study of the upward flow of a gas bubble in a
liquid medium. 1st Brazilian Meeting on Boiling,
Condensing and Multiphase Liquid-Gas Flow. Federal
University of Santa Catarina (UFSC).
[18] Gobbi, L.R.A., 2013. Treatment of oily water by
electroflocculation. Masters dissertation. North of Espirito
Santo University Center. Federal University of Espirito
Santo (UFES).
[19] Hamdan, S.S., El-Naas, M.H., 2014. An electrocoagulation
column (ECC) for groundwater purification. J. Water
Process Eng. 4, 25 - 30.
[20] Holt, P.K., Barton, G.W., Wark, M., Mitchell, C.A., 2002. A
quantitative comparison between chemical dosing and
electrocoagulation. Colloid Surf. A Physicochem. Eng. Asp
211, 233 - 248.
[21] Kobya, M., Gengec, E., Demirbas, E., 2016. Operating
parameters and costs assessments of a real dyehouse
wastewater effluent treated by a continuous
electrocoagulation process. Chem. Eng. Process. Process
Intensif. 101, 87 - 100.
[22] Jun Lu., Yan Li., Mengxuan Yin., Xiaoyun Ma., Shengling
Lin. Removing heavy metal ions with continuous aluminum
electrocoagulation: a study on back mixing and utilization
Thalys de Freitas Fernandes et al. International Journal of Advanced Engineering, Management and Science, 7(7)-2021
This article can be downloaded from here: www.ijaems.com 44
©2021 The Author(s). Published by Infogain Publication.
This work is licensed under a Creative Commons Attribution 4.0 License. http://creativecommons.org/licenses/by/4.0/
rate of electro-generated al ions., 2015. Chemical
engineering journal, v. 267, p. 86 – 92.
[23] II’In,V.I., Sedashova, O.N., 1999. Industrial ecology – An
electroflotation method and plant for removing oil products
from effluents. Chemical and Petroleum Engineering. V.35,
pp. 07 – 08.
[24] Lage, A.H.A., Gonçalves, T.R, Oliveira, A de. U., Saliba,
A.W., 2019. Analysis of transesterification and
hydrohisterification processes in biodiesel production.
Journal of Exact Sciences – JES. 21, 09-14.
[25] Leite, J. C. A. Study of a reactor for electroflotation of
wastewater from the oil industry with a view to its reuse.,
2009. Doctoral Thesis. Science and Technology Center -
Process Engineering. Federal University of Campina
Grande.
[26] Mansoorian, H.J., Mahvi, A.H., Jafari, A.J., 2014. Removal
of lead and zinc from battery industry wastewater using
electrocoagulation process: influence of direct and
alternating current by using iron and stainless steel rod
electrodes. Sep. Purif. Technol. 135, 165-175.
[27] Yang Liu., Jie Yang., Wenming Jiang., Yimei Chen.,
Chaojiang Yang., Tianyu Wang., Yuxing Li., 2018.
Experimental studies on the enhanced performance of
lightweight oil recovery using a combined
electrocoagulation and magnetic field processes.
Chemosphere. 205, 601- 609.
[28] Manenti, D.R., M_odenes, A.N., Soares, P.A., Espinoza-
Quiñones, F.R., Boaventura, R.A.R., Bergamasco, R., Vilar,
V.J.P., 2014. Assessment of a multistage system based on
electrocoagulation, solar photo-Fenton and biological
oxidation processes for real textile wastewater treatment.
Chemical Engineering Journal. 252, 120-130.
[29] Menezes, F.L.G., Silva, A.J.C., Martínez-Huitle, C.A.,
Zanta, C.L.P.S., Alves, J.J.F., Castro, S.S.L., 2017.
Electrochemical treatment of shrimp farming effluent: role
of electrocatalytic material. Environ. Sci. Pollut. Res. 24,
6061 e 6070.
[30] Meneses, J.M.; Vasconcelos, R. F., Fernandes, T. F., Araújo,
G. T., 2012. Treatment of biodiesel wastewater by
electrocoagulation/flotation process: investigation of
operational parameters. Química Nova. v. 35, n. 2, p. 235-
240.
[31] Montgomery, D. C., Runger, G. C., Hubele, N. F., 2004.
Statistics Applied to Engineering. Second edition. Rio de
Janeiro. LCT Publisher.
[32] Moussa, T. D., El-Naas, H. M., Nasser, M., Al-Marri, J.M.,
2017. A comprehensive review of electrocoagulation for
water treatment: Potentials and challenges. Journal of
Environmental Management. 186, 24-41.
[33] Oliveira, S.M.E., Silva, R.F., Morais, O.C.C., Oliveira,
F.B.T., Martínez-Huitle, A.C., Motheo, J.A., Albuquerque,
C.C., Castro, L.S.S., 2018. Performance of (in)active anodic
for the electro-oxidation of phenolic wastewaters from
cashew-nut processing industry. Chemosphere. 201, 740-
748.
[34] Priya, M., Jeyanthi, J., 2019. Removal of COD, oil and
grease from automobile wash water effluent using
electrocoagulation technique. Microchemical Journal. 150,
104070.
[35] Gunaya, E.M., Turkerb, L. E., Tapanc, A. N., 2019.
Significant parameters and technological advancements in
biodiesel production systems. Fuel. 250, 27 – 41.
[36] Manique, M.C., Faccini, C.S., Onorevoli, B., Benvenutti,
E.V., Caramão, E.B., 2012. Rice husk ash as an adsorbent
for purifying biodiesel from waste frying oil. Fuel. 92, 56 –
61.
[37] Rahmani, M., Zerrouki, D., Djafer, L., Ayral, A., 2017.
Hydrogen recovery from the photovoltaic
electroflocculation-flotation process for harvesting
Chlorella pyrenoidosa microalgae. International Journal of
hydrogen energy. 30, I-6.
[38] Saur, F.I., Rubach, S., Forde, S. J., Kjaerheim, G., Syverser,
U., 1996. Electroflocculation: Removal of oil, heavy metals
and organic compounds from oil-in-water emulsions.
Filtration & Separation. 295 – 301.
[39] Siles, A. J., Martím, A. M., Chica, F.A., Martín, A., 2010.
Aerobic co-digestion of glycerol and wastewater derived
from biodiesel manufacturing. Bioresource Tecnology. 101,
6315 – 6321.
[40] Tanneru, C.T., Chellam, S., 2012. Mechanisms of virus
control during iron electrocoagulation - microfiltration of
surface water. Water Res, v. 46 (7), p. 2111 – 2120.
[41] Tezcan Un, U., Koparal, A. S., Ogutveren, U. B., 2013.
Fluoride removal from water and wastewater with a bach
cylindrical electrode using electrocoagulation. Chemical
Engineering Journal. v. 223, p. 110 – 115.
[42] Vepsalainen, M., 2012. Electrocoagulation in the Treatment
of Industrial Waters and Wastewaters. Doctor of Science
(Technology). Lappeenranta University of Technology.
[43] Walsh, F.C., 1993. A first course in electrochemical
engineering. Electrochemical Engineering Consultancy.
England. 381p.
[44] Xu, H.Y., 2016. Investigation of the Optimizing Control
Strategy and Dissolution/passivation Mechanism during
Electrocoagulation Process for Heavy Metals Wastewater
Treatment. PhD thesis. Environment Science and
Engineering. Hunan University.
[45] Zhu J., Wu F., Pan X., Guo J., Wens D., 2011. Removal of
antimony from antimony mineflotation wastewater by
electrocoagulation with aluminum electrodes. Journal of
Environmental Sciences, v. 23, n.7, p. 1066 – 1071.

More Related Content

What's hot

Comparative Study on Strength Enhancement of Concrete using Magnetic and Norm...
Comparative Study on Strength Enhancement of Concrete using Magnetic and Norm...Comparative Study on Strength Enhancement of Concrete using Magnetic and Norm...
Comparative Study on Strength Enhancement of Concrete using Magnetic and Norm...ijtsrd
 
Catalysis Connected, Utrecht - slides of invited talk by Prof. Riikka Puurunen
Catalysis Connected, Utrecht - slides of invited talk by Prof. Riikka PuurunenCatalysis Connected, Utrecht - slides of invited talk by Prof. Riikka Puurunen
Catalysis Connected, Utrecht - slides of invited talk by Prof. Riikka PuurunenRiikka Puurunen
 
Electrohydrodynamic drying
Electrohydrodynamic dryingElectrohydrodynamic drying
Electrohydrodynamic dryingNISHANK WAGHMARE
 
PillarHall basic concept SlideShare
PillarHall basic concept SlideSharePillarHall basic concept SlideShare
PillarHall basic concept SlideShareRiikka Puurunen
 
Synthesis, Ultrasonic Characterization and Comparative Studies of Silver and ...
Synthesis, Ultrasonic Characterization and Comparative Studies of Silver and ...Synthesis, Ultrasonic Characterization and Comparative Studies of Silver and ...
Synthesis, Ultrasonic Characterization and Comparative Studies of Silver and ...IRJET Journal
 
Electrodeposited nanostructured a-Fe2O3 thin films for solar water splitting:...
Electrodeposited nanostructured a-Fe2O3 thin films for solar water splitting:...Electrodeposited nanostructured a-Fe2O3 thin films for solar water splitting:...
Electrodeposited nanostructured a-Fe2O3 thin films for solar water splitting:...North Breeze
 
1 s2.0-s2666386421001661-main
1 s2.0-s2666386421001661-main1 s2.0-s2666386421001661-main
1 s2.0-s2666386421001661-mainAry Assuncao
 
The heating pattern of the microwave dehydrator for treating petroleum crude ...
The heating pattern of the microwave dehydrator for treating petroleum crude ...The heating pattern of the microwave dehydrator for treating petroleum crude ...
The heating pattern of the microwave dehydrator for treating petroleum crude ...eSAT Publishing House
 
The heating pattern of the microwave dehydrator for treating petroleum crude ...
The heating pattern of the microwave dehydrator for treating petroleum crude ...The heating pattern of the microwave dehydrator for treating petroleum crude ...
The heating pattern of the microwave dehydrator for treating petroleum crude ...eSAT Journals
 

What's hot (20)

Comparative Study on Strength Enhancement of Concrete using Magnetic and Norm...
Comparative Study on Strength Enhancement of Concrete using Magnetic and Norm...Comparative Study on Strength Enhancement of Concrete using Magnetic and Norm...
Comparative Study on Strength Enhancement of Concrete using Magnetic and Norm...
 
Catalysis Connected, Utrecht - slides of invited talk by Prof. Riikka Puurunen
Catalysis Connected, Utrecht - slides of invited talk by Prof. Riikka PuurunenCatalysis Connected, Utrecht - slides of invited talk by Prof. Riikka Puurunen
Catalysis Connected, Utrecht - slides of invited talk by Prof. Riikka Puurunen
 
Understanding Dynamic chemistry at the Catalytic Interface
Understanding Dynamic chemistry at the Catalytic InterfaceUnderstanding Dynamic chemistry at the Catalytic Interface
Understanding Dynamic chemistry at the Catalytic Interface
 
Electrohydrodynamic drying
Electrohydrodynamic dryingElectrohydrodynamic drying
Electrohydrodynamic drying
 
PillarHall basic concept SlideShare
PillarHall basic concept SlideSharePillarHall basic concept SlideShare
PillarHall basic concept SlideShare
 
Electrohydrodynamic Drying of Food
Electrohydrodynamic Drying of FoodElectrohydrodynamic Drying of Food
Electrohydrodynamic Drying of Food
 
W4103136140
W4103136140W4103136140
W4103136140
 
APGC-MS, ASAP-MS, and MAI-MS: Expanding the Horizons of API-MS
APGC-MS, ASAP-MS, and MAI-MS: Expanding the Horizons of API-MSAPGC-MS, ASAP-MS, and MAI-MS: Expanding the Horizons of API-MS
APGC-MS, ASAP-MS, and MAI-MS: Expanding the Horizons of API-MS
 
De25628631
De25628631De25628631
De25628631
 
PENG6023 res meth pres
PENG6023 res meth presPENG6023 res meth pres
PENG6023 res meth pres
 
Synthesis, Ultrasonic Characterization and Comparative Studies of Silver and ...
Synthesis, Ultrasonic Characterization and Comparative Studies of Silver and ...Synthesis, Ultrasonic Characterization and Comparative Studies of Silver and ...
Synthesis, Ultrasonic Characterization and Comparative Studies of Silver and ...
 
Misconceptions in Photocatalysis
Misconceptions in PhotocatalysisMisconceptions in Photocatalysis
Misconceptions in Photocatalysis
 
Celik2007
Celik2007Celik2007
Celik2007
 
Electrodeposited nanostructured a-Fe2O3 thin films for solar water splitting:...
Electrodeposited nanostructured a-Fe2O3 thin films for solar water splitting:...Electrodeposited nanostructured a-Fe2O3 thin films for solar water splitting:...
Electrodeposited nanostructured a-Fe2O3 thin films for solar water splitting:...
 
1 s2.0-s2666386421001661-main
1 s2.0-s2666386421001661-main1 s2.0-s2666386421001661-main
1 s2.0-s2666386421001661-main
 
The heating pattern of the microwave dehydrator for treating petroleum crude ...
The heating pattern of the microwave dehydrator for treating petroleum crude ...The heating pattern of the microwave dehydrator for treating petroleum crude ...
The heating pattern of the microwave dehydrator for treating petroleum crude ...
 
The heating pattern of the microwave dehydrator for treating petroleum crude ...
The heating pattern of the microwave dehydrator for treating petroleum crude ...The heating pattern of the microwave dehydrator for treating petroleum crude ...
The heating pattern of the microwave dehydrator for treating petroleum crude ...
 
Poster_Jun 2014
Poster_Jun 2014Poster_Jun 2014
Poster_Jun 2014
 
my first SCI paper
my first SCI papermy first SCI paper
my first SCI paper
 
Iy3515411552
Iy3515411552Iy3515411552
Iy3515411552
 

Similar to Performance of a two Chambers Reactor for the Treatment of an Oily Effluent by Electro flocculation

Rabu 1 reactor
Rabu 1 reactorRabu 1 reactor
Rabu 1 reactorputripus
 
Nanostructured composite materials for CO2 activation
Nanostructured composite materials for CO2 activationNanostructured composite materials for CO2 activation
Nanostructured composite materials for CO2 activationPawan Kumar
 
Total Ionization Cross Sections due to Electron Impact of Ammonia from Thresh...
Total Ionization Cross Sections due to Electron Impact of Ammonia from Thresh...Total Ionization Cross Sections due to Electron Impact of Ammonia from Thresh...
Total Ionization Cross Sections due to Electron Impact of Ammonia from Thresh...Dr. Amarjeet Singh
 
10 aaqr 10-08-oa-0068-90-98
10 aaqr 10-08-oa-0068-90-9810 aaqr 10-08-oa-0068-90-98
10 aaqr 10-08-oa-0068-90-98ahkiaen
 
Treatment of solid waste leachate by
Treatment of solid waste leachate byTreatment of solid waste leachate by
Treatment of solid waste leachate byeSAT Publishing House
 
Preliminary Study on biogas production from POME by DBD plasma
Preliminary Study on biogas production from POME by DBD plasmaPreliminary Study on biogas production from POME by DBD plasma
Preliminary Study on biogas production from POME by DBD plasmaTELKOMNIKA JOURNAL
 
Electro-Disinfection of Municipal Wastewater: Laboratory Scale Comparison bet...
Electro-Disinfection of Municipal Wastewater: Laboratory Scale Comparison bet...Electro-Disinfection of Municipal Wastewater: Laboratory Scale Comparison bet...
Electro-Disinfection of Municipal Wastewater: Laboratory Scale Comparison bet...IJERA Editor
 
Sustainable Strategies for the Exploitation of End-of-Life Permanent Magnets
Sustainable Strategies for the Exploitation of End-of-Life Permanent MagnetsSustainable Strategies for the Exploitation of End-of-Life Permanent Magnets
Sustainable Strategies for the Exploitation of End-of-Life Permanent MagnetsNOMADPOWER
 
TREATING WASTE WATER USING ELECTROCOAGULATION APPROACH
TREATING WASTE WATER USING ELECTROCOAGULATION APPROACHTREATING WASTE WATER USING ELECTROCOAGULATION APPROACH
TREATING WASTE WATER USING ELECTROCOAGULATION APPROACHIAEME Publication
 
Mathematical modeling of a solid oxide fuel cell operating on biogas
Mathematical modeling of a solid oxide fuel cell operating on biogasMathematical modeling of a solid oxide fuel cell operating on biogas
Mathematical modeling of a solid oxide fuel cell operating on biogasjournalBEEI
 
IRJET- Effect of Nano Fluid in Multi-Cylinder Four Stroke Petrol Engine: ...
IRJET-  	  Effect of Nano Fluid in Multi-Cylinder Four Stroke Petrol Engine: ...IRJET-  	  Effect of Nano Fluid in Multi-Cylinder Four Stroke Petrol Engine: ...
IRJET- Effect of Nano Fluid in Multi-Cylinder Four Stroke Petrol Engine: ...IRJET Journal
 
IRJET- Application of Electrocoagulation in Wastewater Treatment: A General R...
IRJET- Application of Electrocoagulation in Wastewater Treatment: A General R...IRJET- Application of Electrocoagulation in Wastewater Treatment: A General R...
IRJET- Application of Electrocoagulation in Wastewater Treatment: A General R...IRJET Journal
 
Dielectrophoresis Effect of Dielectric Liquids with Suspended Cellulose Impur...
Dielectrophoresis Effect of Dielectric Liquids with Suspended Cellulose Impur...Dielectrophoresis Effect of Dielectric Liquids with Suspended Cellulose Impur...
Dielectrophoresis Effect of Dielectric Liquids with Suspended Cellulose Impur...IJECEIAES
 
Degradation of Paracetamol by Electro-Fenton and Photoelectro-Fenton Processe...
Degradation of Paracetamol by Electro-Fenton and Photoelectro-Fenton Processe...Degradation of Paracetamol by Electro-Fenton and Photoelectro-Fenton Processe...
Degradation of Paracetamol by Electro-Fenton and Photoelectro-Fenton Processe...Oswar Mungkasa
 
THERMAL CONDUCTIVITY OF NANOFLUIDS PREPARED FROM BIOBASED NANOMATERIALS DISPE...
THERMAL CONDUCTIVITY OF NANOFLUIDS PREPARED FROM BIOBASED NANOMATERIALS DISPE...THERMAL CONDUCTIVITY OF NANOFLUIDS PREPARED FROM BIOBASED NANOMATERIALS DISPE...
THERMAL CONDUCTIVITY OF NANOFLUIDS PREPARED FROM BIOBASED NANOMATERIALS DISPE...IAEME Publication
 
Hydrogen fuel cells for the automotive system
Hydrogen fuel cells for the automotive systemHydrogen fuel cells for the automotive system
Hydrogen fuel cells for the automotive systemOmar Qasim
 

Similar to Performance of a two Chambers Reactor for the Treatment of an Oily Effluent by Electro flocculation (20)

Ijmet 10 01_059
Ijmet 10 01_059Ijmet 10 01_059
Ijmet 10 01_059
 
Rabu 1 reactor
Rabu 1 reactorRabu 1 reactor
Rabu 1 reactor
 
Nanostructured composite materials for CO2 activation
Nanostructured composite materials for CO2 activationNanostructured composite materials for CO2 activation
Nanostructured composite materials for CO2 activation
 
Total Ionization Cross Sections due to Electron Impact of Ammonia from Thresh...
Total Ionization Cross Sections due to Electron Impact of Ammonia from Thresh...Total Ionization Cross Sections due to Electron Impact of Ammonia from Thresh...
Total Ionization Cross Sections due to Electron Impact of Ammonia from Thresh...
 
10 aaqr 10-08-oa-0068-90-98
10 aaqr 10-08-oa-0068-90-9810 aaqr 10-08-oa-0068-90-98
10 aaqr 10-08-oa-0068-90-98
 
13-Microbial_Fuel_Cells.pdf
13-Microbial_Fuel_Cells.pdf13-Microbial_Fuel_Cells.pdf
13-Microbial_Fuel_Cells.pdf
 
20320130406024
2032013040602420320130406024
20320130406024
 
Treatment of solid waste leachate by
Treatment of solid waste leachate byTreatment of solid waste leachate by
Treatment of solid waste leachate by
 
Preliminary Study on biogas production from POME by DBD plasma
Preliminary Study on biogas production from POME by DBD plasmaPreliminary Study on biogas production from POME by DBD plasma
Preliminary Study on biogas production from POME by DBD plasma
 
Electro-Disinfection of Municipal Wastewater: Laboratory Scale Comparison bet...
Electro-Disinfection of Municipal Wastewater: Laboratory Scale Comparison bet...Electro-Disinfection of Municipal Wastewater: Laboratory Scale Comparison bet...
Electro-Disinfection of Municipal Wastewater: Laboratory Scale Comparison bet...
 
Sustainable Strategies for the Exploitation of End-of-Life Permanent Magnets
Sustainable Strategies for the Exploitation of End-of-Life Permanent MagnetsSustainable Strategies for the Exploitation of End-of-Life Permanent Magnets
Sustainable Strategies for the Exploitation of End-of-Life Permanent Magnets
 
TREATING WASTE WATER USING ELECTROCOAGULATION APPROACH
TREATING WASTE WATER USING ELECTROCOAGULATION APPROACHTREATING WASTE WATER USING ELECTROCOAGULATION APPROACH
TREATING WASTE WATER USING ELECTROCOAGULATION APPROACH
 
Mathematical modeling of a solid oxide fuel cell operating on biogas
Mathematical modeling of a solid oxide fuel cell operating on biogasMathematical modeling of a solid oxide fuel cell operating on biogas
Mathematical modeling of a solid oxide fuel cell operating on biogas
 
IRJET- Effect of Nano Fluid in Multi-Cylinder Four Stroke Petrol Engine: ...
IRJET-  	  Effect of Nano Fluid in Multi-Cylinder Four Stroke Petrol Engine: ...IRJET-  	  Effect of Nano Fluid in Multi-Cylinder Four Stroke Petrol Engine: ...
IRJET- Effect of Nano Fluid in Multi-Cylinder Four Stroke Petrol Engine: ...
 
IRJET- Application of Electrocoagulation in Wastewater Treatment: A General R...
IRJET- Application of Electrocoagulation in Wastewater Treatment: A General R...IRJET- Application of Electrocoagulation in Wastewater Treatment: A General R...
IRJET- Application of Electrocoagulation in Wastewater Treatment: A General R...
 
Dielectrophoresis Effect of Dielectric Liquids with Suspended Cellulose Impur...
Dielectrophoresis Effect of Dielectric Liquids with Suspended Cellulose Impur...Dielectrophoresis Effect of Dielectric Liquids with Suspended Cellulose Impur...
Dielectrophoresis Effect of Dielectric Liquids with Suspended Cellulose Impur...
 
Degradation of Paracetamol by Electro-Fenton and Photoelectro-Fenton Processe...
Degradation of Paracetamol by Electro-Fenton and Photoelectro-Fenton Processe...Degradation of Paracetamol by Electro-Fenton and Photoelectro-Fenton Processe...
Degradation of Paracetamol by Electro-Fenton and Photoelectro-Fenton Processe...
 
THERMAL CONDUCTIVITY OF NANOFLUIDS PREPARED FROM BIOBASED NANOMATERIALS DISPE...
THERMAL CONDUCTIVITY OF NANOFLUIDS PREPARED FROM BIOBASED NANOMATERIALS DISPE...THERMAL CONDUCTIVITY OF NANOFLUIDS PREPARED FROM BIOBASED NANOMATERIALS DISPE...
THERMAL CONDUCTIVITY OF NANOFLUIDS PREPARED FROM BIOBASED NANOMATERIALS DISPE...
 
Hydrogen fuel cells for the automotive system
Hydrogen fuel cells for the automotive systemHydrogen fuel cells for the automotive system
Hydrogen fuel cells for the automotive system
 
20320140501001
2032014050100120320140501001
20320140501001
 

Recently uploaded

(ANVI) Koregaon Park Call Girls Just Call 7001035870 [ Cash on Delivery ] Pun...
(ANVI) Koregaon Park Call Girls Just Call 7001035870 [ Cash on Delivery ] Pun...(ANVI) Koregaon Park Call Girls Just Call 7001035870 [ Cash on Delivery ] Pun...
(ANVI) Koregaon Park Call Girls Just Call 7001035870 [ Cash on Delivery ] Pun...ranjana rawat
 
APPLICATIONS-AC/DC DRIVES-OPERATING CHARACTERISTICS
APPLICATIONS-AC/DC DRIVES-OPERATING CHARACTERISTICSAPPLICATIONS-AC/DC DRIVES-OPERATING CHARACTERISTICS
APPLICATIONS-AC/DC DRIVES-OPERATING CHARACTERISTICSKurinjimalarL3
 
Model Call Girl in Narela Delhi reach out to us at 🔝8264348440🔝
Model Call Girl in Narela Delhi reach out to us at 🔝8264348440🔝Model Call Girl in Narela Delhi reach out to us at 🔝8264348440🔝
Model Call Girl in Narela Delhi reach out to us at 🔝8264348440🔝soniya singh
 
chaitra-1.pptx fake news detection using machine learning
chaitra-1.pptx  fake news detection using machine learningchaitra-1.pptx  fake news detection using machine learning
chaitra-1.pptx fake news detection using machine learningmisbanausheenparvam
 
(MEERA) Dapodi Call Girls Just Call 7001035870 [ Cash on Delivery ] Pune Escorts
(MEERA) Dapodi Call Girls Just Call 7001035870 [ Cash on Delivery ] Pune Escorts(MEERA) Dapodi Call Girls Just Call 7001035870 [ Cash on Delivery ] Pune Escorts
(MEERA) Dapodi Call Girls Just Call 7001035870 [ Cash on Delivery ] Pune Escortsranjana rawat
 
Introduction to IEEE STANDARDS and its different types.pptx
Introduction to IEEE STANDARDS and its different types.pptxIntroduction to IEEE STANDARDS and its different types.pptx
Introduction to IEEE STANDARDS and its different types.pptxupamatechverse
 
HARMONY IN THE NATURE AND EXISTENCE - Unit-IV
HARMONY IN THE NATURE AND EXISTENCE - Unit-IVHARMONY IN THE NATURE AND EXISTENCE - Unit-IV
HARMONY IN THE NATURE AND EXISTENCE - Unit-IVRajaP95
 
Structural Analysis and Design of Foundations: A Comprehensive Handbook for S...
Structural Analysis and Design of Foundations: A Comprehensive Handbook for S...Structural Analysis and Design of Foundations: A Comprehensive Handbook for S...
Structural Analysis and Design of Foundations: A Comprehensive Handbook for S...Dr.Costas Sachpazis
 
GDSC ASEB Gen AI study jams presentation
GDSC ASEB Gen AI study jams presentationGDSC ASEB Gen AI study jams presentation
GDSC ASEB Gen AI study jams presentationGDSCAESB
 
HARDNESS, FRACTURE TOUGHNESS AND STRENGTH OF CERAMICS
HARDNESS, FRACTURE TOUGHNESS AND STRENGTH OF CERAMICSHARDNESS, FRACTURE TOUGHNESS AND STRENGTH OF CERAMICS
HARDNESS, FRACTURE TOUGHNESS AND STRENGTH OF CERAMICSRajkumarAkumalla
 
MANUFACTURING PROCESS-II UNIT-2 LATHE MACHINE
MANUFACTURING PROCESS-II UNIT-2 LATHE MACHINEMANUFACTURING PROCESS-II UNIT-2 LATHE MACHINE
MANUFACTURING PROCESS-II UNIT-2 LATHE MACHINESIVASHANKAR N
 
Introduction to Multiple Access Protocol.pptx
Introduction to Multiple Access Protocol.pptxIntroduction to Multiple Access Protocol.pptx
Introduction to Multiple Access Protocol.pptxupamatechverse
 
(SHREYA) Chakan Call Girls Just Call 7001035870 [ Cash on Delivery ] Pune Esc...
(SHREYA) Chakan Call Girls Just Call 7001035870 [ Cash on Delivery ] Pune Esc...(SHREYA) Chakan Call Girls Just Call 7001035870 [ Cash on Delivery ] Pune Esc...
(SHREYA) Chakan Call Girls Just Call 7001035870 [ Cash on Delivery ] Pune Esc...ranjana rawat
 
Extrusion Processes and Their Limitations
Extrusion Processes and Their LimitationsExtrusion Processes and Their Limitations
Extrusion Processes and Their Limitations120cr0395
 
Decoding Kotlin - Your guide to solving the mysterious in Kotlin.pptx
Decoding Kotlin - Your guide to solving the mysterious in Kotlin.pptxDecoding Kotlin - Your guide to solving the mysterious in Kotlin.pptx
Decoding Kotlin - Your guide to solving the mysterious in Kotlin.pptxJoão Esperancinha
 
(ANJALI) Dange Chowk Call Girls Just Call 7001035870 [ Cash on Delivery ] Pun...
(ANJALI) Dange Chowk Call Girls Just Call 7001035870 [ Cash on Delivery ] Pun...(ANJALI) Dange Chowk Call Girls Just Call 7001035870 [ Cash on Delivery ] Pun...
(ANJALI) Dange Chowk Call Girls Just Call 7001035870 [ Cash on Delivery ] Pun...ranjana rawat
 
Architect Hassan Khalil Portfolio for 2024
Architect Hassan Khalil Portfolio for 2024Architect Hassan Khalil Portfolio for 2024
Architect Hassan Khalil Portfolio for 2024hassan khalil
 
Processing & Properties of Floor and Wall Tiles.pptx
Processing & Properties of Floor and Wall Tiles.pptxProcessing & Properties of Floor and Wall Tiles.pptx
Processing & Properties of Floor and Wall Tiles.pptxpranjaldaimarysona
 
MANUFACTURING PROCESS-II UNIT-5 NC MACHINE TOOLS
MANUFACTURING PROCESS-II UNIT-5 NC MACHINE TOOLSMANUFACTURING PROCESS-II UNIT-5 NC MACHINE TOOLS
MANUFACTURING PROCESS-II UNIT-5 NC MACHINE TOOLSSIVASHANKAR N
 
(RIA) Call Girls Bhosari ( 7001035870 ) HI-Fi Pune Escorts Service
(RIA) Call Girls Bhosari ( 7001035870 ) HI-Fi Pune Escorts Service(RIA) Call Girls Bhosari ( 7001035870 ) HI-Fi Pune Escorts Service
(RIA) Call Girls Bhosari ( 7001035870 ) HI-Fi Pune Escorts Serviceranjana rawat
 

Recently uploaded (20)

(ANVI) Koregaon Park Call Girls Just Call 7001035870 [ Cash on Delivery ] Pun...
(ANVI) Koregaon Park Call Girls Just Call 7001035870 [ Cash on Delivery ] Pun...(ANVI) Koregaon Park Call Girls Just Call 7001035870 [ Cash on Delivery ] Pun...
(ANVI) Koregaon Park Call Girls Just Call 7001035870 [ Cash on Delivery ] Pun...
 
APPLICATIONS-AC/DC DRIVES-OPERATING CHARACTERISTICS
APPLICATIONS-AC/DC DRIVES-OPERATING CHARACTERISTICSAPPLICATIONS-AC/DC DRIVES-OPERATING CHARACTERISTICS
APPLICATIONS-AC/DC DRIVES-OPERATING CHARACTERISTICS
 
Model Call Girl in Narela Delhi reach out to us at 🔝8264348440🔝
Model Call Girl in Narela Delhi reach out to us at 🔝8264348440🔝Model Call Girl in Narela Delhi reach out to us at 🔝8264348440🔝
Model Call Girl in Narela Delhi reach out to us at 🔝8264348440🔝
 
chaitra-1.pptx fake news detection using machine learning
chaitra-1.pptx  fake news detection using machine learningchaitra-1.pptx  fake news detection using machine learning
chaitra-1.pptx fake news detection using machine learning
 
(MEERA) Dapodi Call Girls Just Call 7001035870 [ Cash on Delivery ] Pune Escorts
(MEERA) Dapodi Call Girls Just Call 7001035870 [ Cash on Delivery ] Pune Escorts(MEERA) Dapodi Call Girls Just Call 7001035870 [ Cash on Delivery ] Pune Escorts
(MEERA) Dapodi Call Girls Just Call 7001035870 [ Cash on Delivery ] Pune Escorts
 
Introduction to IEEE STANDARDS and its different types.pptx
Introduction to IEEE STANDARDS and its different types.pptxIntroduction to IEEE STANDARDS and its different types.pptx
Introduction to IEEE STANDARDS and its different types.pptx
 
HARMONY IN THE NATURE AND EXISTENCE - Unit-IV
HARMONY IN THE NATURE AND EXISTENCE - Unit-IVHARMONY IN THE NATURE AND EXISTENCE - Unit-IV
HARMONY IN THE NATURE AND EXISTENCE - Unit-IV
 
Structural Analysis and Design of Foundations: A Comprehensive Handbook for S...
Structural Analysis and Design of Foundations: A Comprehensive Handbook for S...Structural Analysis and Design of Foundations: A Comprehensive Handbook for S...
Structural Analysis and Design of Foundations: A Comprehensive Handbook for S...
 
GDSC ASEB Gen AI study jams presentation
GDSC ASEB Gen AI study jams presentationGDSC ASEB Gen AI study jams presentation
GDSC ASEB Gen AI study jams presentation
 
HARDNESS, FRACTURE TOUGHNESS AND STRENGTH OF CERAMICS
HARDNESS, FRACTURE TOUGHNESS AND STRENGTH OF CERAMICSHARDNESS, FRACTURE TOUGHNESS AND STRENGTH OF CERAMICS
HARDNESS, FRACTURE TOUGHNESS AND STRENGTH OF CERAMICS
 
MANUFACTURING PROCESS-II UNIT-2 LATHE MACHINE
MANUFACTURING PROCESS-II UNIT-2 LATHE MACHINEMANUFACTURING PROCESS-II UNIT-2 LATHE MACHINE
MANUFACTURING PROCESS-II UNIT-2 LATHE MACHINE
 
Introduction to Multiple Access Protocol.pptx
Introduction to Multiple Access Protocol.pptxIntroduction to Multiple Access Protocol.pptx
Introduction to Multiple Access Protocol.pptx
 
(SHREYA) Chakan Call Girls Just Call 7001035870 [ Cash on Delivery ] Pune Esc...
(SHREYA) Chakan Call Girls Just Call 7001035870 [ Cash on Delivery ] Pune Esc...(SHREYA) Chakan Call Girls Just Call 7001035870 [ Cash on Delivery ] Pune Esc...
(SHREYA) Chakan Call Girls Just Call 7001035870 [ Cash on Delivery ] Pune Esc...
 
Extrusion Processes and Their Limitations
Extrusion Processes and Their LimitationsExtrusion Processes and Their Limitations
Extrusion Processes and Their Limitations
 
Decoding Kotlin - Your guide to solving the mysterious in Kotlin.pptx
Decoding Kotlin - Your guide to solving the mysterious in Kotlin.pptxDecoding Kotlin - Your guide to solving the mysterious in Kotlin.pptx
Decoding Kotlin - Your guide to solving the mysterious in Kotlin.pptx
 
(ANJALI) Dange Chowk Call Girls Just Call 7001035870 [ Cash on Delivery ] Pun...
(ANJALI) Dange Chowk Call Girls Just Call 7001035870 [ Cash on Delivery ] Pun...(ANJALI) Dange Chowk Call Girls Just Call 7001035870 [ Cash on Delivery ] Pun...
(ANJALI) Dange Chowk Call Girls Just Call 7001035870 [ Cash on Delivery ] Pun...
 
Architect Hassan Khalil Portfolio for 2024
Architect Hassan Khalil Portfolio for 2024Architect Hassan Khalil Portfolio for 2024
Architect Hassan Khalil Portfolio for 2024
 
Processing & Properties of Floor and Wall Tiles.pptx
Processing & Properties of Floor and Wall Tiles.pptxProcessing & Properties of Floor and Wall Tiles.pptx
Processing & Properties of Floor and Wall Tiles.pptx
 
MANUFACTURING PROCESS-II UNIT-5 NC MACHINE TOOLS
MANUFACTURING PROCESS-II UNIT-5 NC MACHINE TOOLSMANUFACTURING PROCESS-II UNIT-5 NC MACHINE TOOLS
MANUFACTURING PROCESS-II UNIT-5 NC MACHINE TOOLS
 
(RIA) Call Girls Bhosari ( 7001035870 ) HI-Fi Pune Escorts Service
(RIA) Call Girls Bhosari ( 7001035870 ) HI-Fi Pune Escorts Service(RIA) Call Girls Bhosari ( 7001035870 ) HI-Fi Pune Escorts Service
(RIA) Call Girls Bhosari ( 7001035870 ) HI-Fi Pune Escorts Service
 

Performance of a two Chambers Reactor for the Treatment of an Oily Effluent by Electro flocculation

  • 1. International Journal of Advanced Engineering, Management and Science (IJAEMS) Peer-Reviewed Journal ISSN: 2454-1311 | Vol-7, Issue-7; Jul, 2021 Journal Home Page: https://ijaems.com/ Article DOI: https://dx.doi.org/10.22161/ijaems.77.7 This article can be downloaded from here: www.ijaems.com 32 ©2021 The Author(s). Published by Infogain Publication. This work is licensed under a Creative Commons Attribution 4.0 License. http://creativecommons.org/licenses/by/4.0/ Performance of a two Chambers Reactor for the Treatment of an Oily Effluent by Electro flocculation Thalys de Freitas Fernandes1 , Gerônimo Barbosa Alexandre2 , Matheus Albuquerque de Saturno3 , Ana Paula Trindade Rocha4 , José Nilton Silva5 , Gilmar Trindade de Araújo6 1,4,5,6 Federal University of Campina Grande - UFCG, CCT, Campina Grande Campus, Paraíba, Brazil. 2,3 Federal Institute of Pernambuco - IFPE, EBTT, Garanhuns Campus, Pernambuco, Brazil. Received: 09 Jul 2021; Received in revised form: 07 Jul 2021; Accepted: 14 Jul 2021; Available online: 25 Jul 2021 Abstract— This work had as objective the development and analysis of a continuum flow reactor and measure its efficiency in the treatment of residual water of the biodiesel purification process using electro flocculation. The reactor was designed with two interconnected chambers with an 0.2 cm opening between then and reaction volume was 0.883 L and an electrolytic area of 351 cm². The electrodes were all aluminum, which were arranged in parallel and with 0.5 cm spacing, whose power was supplied by a DC source. As design variables, the influence of electrical potential (U) and residence time (τ) on: current density, final pH, removal of oils and greases, COD (Chemical Oxygen Demand), turbidity and total solids, in addition to quantification of the sludge mass obtained and the energy cost of the reactor. The best performance was for a potential of 6.0 volts and a τ of 29.43 min, with 90% removal of oils and greases, 53% COD and 4.38 g of sludge, culminating in an energy consumption ranging from 0.708 kWhm-3 to 4.73 kWhm-3 . In addition, by visual analysis of the formation of bubbles and the removal of turbidity (94%), it was concluded that the division of the reactor in two chambers reduced the secondary contamination of the treated effluent. Keywords— electrochemical process, continuous system, effluent treatment, environment. I. INTRODUCTION The biodiesel production process, for the most part, is based on the use of homogeneous catalysts, usually Sodium Hydroxide (NaOH) or Potassium (KOH) (Lage et al., 2019; Gunaya et al., 2019). In this production route, water is generally used to purify the synthesized biodiesel, which at the end of the process generates a proportion of three liters of wastewater for each liter of synthesized biodiesel (Manique et al., 2012). Therefore, this effluent is alkaline and contains a high content of oils and greases (Chavalparit and Ongwandee, 2009; Meneses et al., 2012). However, this wastewater contains low concentrations of nitrogen and phosphorus, making an eventual biological treatment, in itself, ineffective (Asia, 2003; Oliveira et al., 2018; Menezes et al., 2017). Other treatment alternatives using only metal salts such as polymers and polyelectrolytes have been used, however, they are expensive, generate excess coagulant materials, and can even lead to secondary pollution (Jun Lu et al., 2015). Lately, an electrochemical technique has been studied, which although it is still little applied industrially, has aroused a lot of interest due to its simplicity of operation and application in different types of treatment, for example: in textile effluents (Manenti et al., 2014), in waters that show color (Bani-Melhem and Smith, 2012), waters containing pharmaceutical residues (Chou et al., 2011), effluents contaminated with heavy metals (Zhu J et al., 2011), oily effluents (Chavalparit and Ongwandee, 2009; Meneses et al., 2012; Fernandes et al., 2015; Ammar et al., 2019). This is electro flocculation (EF), whose technique is the sum of three sub-processes: coagulation, flotation and electrochemistry (Moussa et al., 2017). As shown in Fig.1, in an electrochemical reactor containing a set of sacrificial electrodes immersed in the effluent, an electric potential (U) is applied and as a consequence, an electric current is generated in the medium.
  • 2. Thalys de Freitas Fernandes et al. International Journal of Advanced Engineering, Management and Science, 7(7)-2021 This article can be downloaded from here: www.ijaems.com 33 ©2021 The Author(s). Published by Infogain Publication. This work is licensed under a Creative Commons Attribution 4.0 License. http://creativecommons.org/licenses/by/4.0/ Electronic mobility initially allows oxidation of the anode, releasing the metal (M) in ionic form (Mn+ ). These will then react with hydroxyls (OH- ) generated at the cathode, forming M (OH)n, which is the main coagulation agent in the medium, in addition to forming other compounds such as: M (OH)2+, M2(OH)24+, M(OH)2+, M(OH)4− , M6(OH)15 3+ (Holt et al., 2002; Yang Liu et al., 2018). Parallel to coagulation, there is the formation of hydrogen gas (H2) at the cathode and oxygen (O2) at the anode, which are responsible for the flotation phenomenon, that is, most of the coagulated material that is not decanted, adheres to the bubbles and is carried to the reactor surface (Tezcan Un et al., 2013). Fig.1: View of the components generated between two sacrificial metal electrodes (M), in the electro flocculation process. (Designed by the author). Lately, a lot of work has been done to improve the design of EF reactors, aiming to improve the efficiency of contaminant removal (Abdelwahab et al., 2009; Chaudhary and Sahu, 2013; Hamdan and El-Naas, 2014; Fernandes et al., 2015; Ammar et al., 2019). With EF experiments, it has been observed that the flotation of particulate material to the reactor surface can be considered a critical step in this process, since the coalescence between bubbles and contaminating particles needs to be effective for the set to reach the top of the reactor (Leite, 2009). According to II'In and Sedashova (1999), this contact is controlled by hydrodynamic interactions between bubbles and particles, which, in turn, requires intrinsic care with the electric field generated in the medium, with the rate of agitation and with the flow of reactor supply, otherwise the bubbles will burst and contaminate the effluent again (Fig.2). Fig.2: EF flotation process: a) pollutant and H2 and / or O2 gas bubble isolated; b) gas bubble and pollutant adhered and emerging to the surface; c) particles of the pollutant diffusing in the liquid medium after the bubble ruptures. (Designed by the author).
  • 3. Thalys de Freitas Fernandes et al. International Journal of Advanced Engineering, Management and Science, 7(7)-2021 This article can be downloaded from here: www.ijaems.com 34 ©2021 The Author(s). Published by Infogain Publication. This work is licensed under a Creative Commons Attribution 4.0 License. http://creativecommons.org/licenses/by/4.0/ However, what has been observed is that even with the strict attention given to the control of these parameters, gas bubbles tend to burst naturally, due to the pressure difference that they are subjected to when reaching the reactor's liquid surface. Therefore, in order to minimize the effect caused by the explosion of gas bubbles, this work aimed to develop an electrochemical reactor with continuous flow and consisting of two chambers, to analyze it for efficiency in the treatment of wastewater for the purification of biodiesel. II. MATERIALS AND METHODS 2.1. Electro flocculation reactor design Fig.3 shows the schematic drawing of the EF reactor with the electrodes connected to a direct current source (DC), as well as the numbering of each component, as detailed in the legend. The reactor has the following dimensions: 10 cm long, 23.5 cm high and 4.7 cm wide. The total volume is 1,034 dm³ and the reaction volume is 0.883 dm³. There are also two streams, one for feeding and another for the outlet of the treated effluent, in addition to a 25º inclined gutter at the top, for the drainage of wet sludge, coagulated and flotated material. Fig.3: Design of the EF reactor coupled to the DC source: 1-effluent inlet, 2- electrochemical cell chamber, 3-sludge removal channel, 4 - second reactor chamber, 5 - treated effluent outlet, 6 - DC source. (Designed by the author). The electrochemical cell is composed of four aluminum electrodes whose purity is 96.89%. Each electrode is 0.1 cm thick and has a total area of 128 cm². They were distributed alternately, respecting a fixed distance of 0.5 cm between anodes and cathodes, as studied by Meneses et al., (2012) and Fernandes et al., (2015). The effective reaction area was totaled 351 cm². The passage of the effluent from the first to the second chamber occurred through an opening of 0.2 cm located at half the height of the reactor (Fig.4). This idea was supported by the observations made by (Georg et al., 2008). Who affirms that a gas bubble suspended in a viscous medium is basically spherical and follows an upward and rectilinear trajectory, since the upward vertical tensions, drag Force (Fd) and Thrust Force (Ft), which act on the particle (bubble + pollutant), prevail over the gravitational Force (Fg) and horizontal frictional forces (Ff). Therefore, knowing that the biodiesel effluent has a viscous aspect, it was deduced that most of the particles must emerge in the first chamber of the reactor and that a minority follows a horizontal path towards the second chamber. Fig.4: Highlight for the access between the EF reactor chambers and the field of hydrodynamic forces that act on a coagulated particle (contaminant + bubble). (Designed by the author). 2.2. Analytical Techniques The pH was measured with a bench pH meter of the brand pH Meter, model Instrutherm pH - 1900, with automatic temperature compensation and reading range from 0.0 to 14 and accuracy of 0.01. The electrical conductivity was measured by direct reading with a TECNOPON conductivity meter, model mCA - 150, with a measurement range between 0.01 and 2000 µScm -1 and resolution of 0.1 µScm -1 . Turbidity was measured with a HACH turbidimeter, model 2100P, with a scale of 0.0 to 1000 NTU and precision of 0.01 NTU. The concentration of total solids (TS) was determined by the gravimetric method, using a SOLAB oven, model SL 102, with a capacity of 150 L and automatic programming, whose drying temperature of the samples was (103 ± 2) ºC. The concentrations of oils and greases (O&G) and the chemical oxygen demand (COD) were determined with an Agilent Technologies spectrophotometer; model Cary 60 UV-vis. For COD, samples were previously digested in a
  • 4. Thalys de Freitas Fernandes et al. International Journal of Advanced Engineering, Management and Science, 7(7)-2021 This article can be downloaded from here: www.ijaems.com 35 ©2021 The Author(s). Published by Infogain Publication. This work is licensed under a Creative Commons Attribution 4.0 License. http://creativecommons.org/licenses/by/4.0/ MARCONI DRY BLOCK MA4004 digesting block, at a temperature of 150ºC for a period of 2 hours. The oils and greases were previously separated by hexane extraction. All analyzes were adapted from the American Public Health Association (APHA, 2005) and Gobbi (2013). 2.3. Waste water from biodiesel purification The wastewater was obtained synthetically at an ambient temperature of 25ºC. Soybean oil (2.01 gL -1 ), biodiesel (4.01 gL -1 ) and glycerin (1.36 gL -1 ) were inserted in the reactor feed tank, with a capacity of 8.0 L, according to values determined by (Chavalparit and Ongwandee, 2009), for biodiesel wastewater. The mixture was subjected to mechanical stirring at 700 rpm, with a Stainless Steel 304 stirrer, model DLMYP2011-100, for a period of 30 min, until an apparently stable emulsion was obtained, with an alkaline pH ranging between (9 - 11). The brand soy oil (LISA), 100% vegetable, was purchased in local stores, while biodiesel and glycerin were synthesized by the transesterification process, via homogeneous catalysis, at the Chemistry and Biomass Laboratory (LQB or CBL) of the Science Center and Technology, UFCG, Brazil. 1M aqueous solutions of HCl and NaOH, previously prepared, were used to adjust the pH of the emulsion to 8.0, the pH of the experiment. According to (Mansoorian et al., 2014; Gatsios et al., 2015; Moussa et al., 2017), for pH values between 6 and 9 a good formation of coagulating agents in EF is achieved. Conductivity was measured right after adjusting the pH. 2.4. Reagents and solutions All chemical reagents were of analytical purity grade and were used without pretreatment. The effluent was prepared with local water supply, whose average conductivity was 217 µScm -1 and pH equal to 7. The solutions used in the physical-chemical analyzes and for pH control were prepared with pure material, using water distilled with an average conductivity of 1.0 µScm -1 . 2.5. Experimental planning The performance evaluation of the reactor was carried out with the control over two system factors: Residence Time (τ) and Electric Potential (U), varying between the levels, low (17.6 min and 3.6 volts) and high (29.43 min and 6.0 volts), as shown in Table 1. Table 1: Factors and experimental levels. Exp.* τ U (min) (volt) 1 17.66 3.6 2 17.66 6.0 3 29.43 3.6 4 29.43 6.0 *Experiments The levels were chosen based on studies by (Fernandes et al., 2015), which analyzed an electrochemical reactor with a tubular geometry and aluminum electrodes for treating oily water, yielding removals above 80% for oils and greases. In this study, the volumetric flow rates of the reactor inlet varied between 0.03 and 0.05 Lmin-1 . Therefore, for these two extremes, knowing that the proposed reactor useful volume was 0.883 L, the theoretical residence times were calculated (Table 1), using Eq. (1) (Gardiman Junior et al., 2019). V v  = (1) Using τ in (minutes), V the useful volume of the reactor in (L) and ν the volumetric flow of the reactor inlet in (Lmin- 1 ). As response variables were analyzed: the density of electric current (DC), the final pH, the concentrations of O&G, COD, TS, turbidity, in addition to the sludge mass and energy consumption (EC). All were analyzed for behavior over the treatment time, with O&G, COD, turbidity and TS being analyzed as removal efficiency (%), calculated from Eq. (2) (Fei Liua et al., 2019). 0 0 (%) 100% i C C C − =  (2) Adopting (C 0) the concentration measured at time t 0 = 0 min and (Ci) the concentration of the variable analyzed at time ti different from zero. The behavior of the electric current (I) generated in the reaction medium was also monitored in the DC source, whose values were applied to Eq. (3) to calculate the energy (E) spent with the EF reactor, which was used to calculate energy cost (EC) using Eq. (4). ( ) 3 / m t U I t E kWh m V   = (3) ( ) 3 $ / i EC R m E t =  (4) E is given in (R$m-3 ), ti the tariff defined by the energy concessionaire of each state or country given in R$(kWh)-1 , U the potential difference in (volts), Im the average electric current in (A), Vt the volume of effluent treated in (m³) and ∆t the time interval of experiment in (h). Thus, based on the levels and factors presented, four tests were performed in triplicate, totaling twelve experiments. These were performed at random, according to (Montgomery et al., 2004). 2.6. The continuous electro flocculation system The set of equipment connected to the electrochemical reactor formed the continuous EF system (Fig.5). The tank (T-01) with capacity for 8L and a coupled
  • 5. Thalys de Freitas Fernandes et al. International Journal of Advanced Engineering, Management and Science, 7(7)-2021 This article can be downloaded from here: www.ijaems.com 36 ©2021 The Author(s). Published by Infogain Publication. This work is licensed under a Creative Commons Attribution 4.0 License. http://creativecommons.org/licenses/by/4.0/ agitation system, contained the biodiesel wastewater, which fed the reactor by a peristaltic pump of the brand BPT tube, model KXF-DC-B08. This contained the valve (V-01), which allowed adjusting the flow at the entrance to the reactor (range from 0.003 to 0.08 Lmin-1 ). A DC source, which connected to the reactor, allowed adjusting the electrical potential and monitoring the variation of the electrical current throughout the process. At the top of the reactor, the sludge generated during the electrochemical process was removed, which was stored in the tank (T-02) with a capacity of 3 L. In the outlet current for the treated effluent, there was the valve (V-02) used to control the liquid level in the reactor, the value of which remained at 14 ± 1.0 cm throughout the treatment process. The treated effluent was collected in the tank (T-03) and sent to perform the physical-chemical analyzes. Fig.5: Schematic diagram of the experimental configuration (T-01: biodiesel wastewater tank; PP peristaltic pump; V-01: flow control valve; T-02: sludge tank; R-EF: electro flocculation reactor; F-DC: direct current source; V-02: valve for level control; T-03: tank for the treated effluent). (Designed by the author). 2.7 Experimental procedure The biodiesel wastewater was synthesized in the T- 01 tank, according to the procedure shown in sub-item 2.2. Agitation was reduced from 700 rpm to 100 rpm after preparation and maintained throughout the experiment, to ensure homogenization of the emulsion. A 0.2 L sample was collected to perform the physical-chemical analyzes at zero time. The peristaltic pump was switched on and the volume flow in the valve (V-01) was adjusted, according to the test τ. When the reactor reached the operating liquid level, the valve (V-02) was manipulated to keep it in the specified range. With the hydrodynamic variables controlled, the DC source was connected to the electrical potential of the experiment and a timer was started. Samples of the treated effluent were collected every 5 min to perform the physical- chemical analyzes, and so on, until completing 40 min of the experiment. At the end, the equipment was turned off and the electrodes were washed with soap and water, using steel anchors to ensure the complete scraping of contaminants adhered to the aluminum plates. III. RESULTS AND DISCUSSION The physical-chemical characterization of the wastewater purification of Biodiesel was performed and listed in Table 2. It was observed that the conductivity, a very important parameter of the process variables presented values because, based on the initial pH was added a greater or lesser volume of acid and/or alkaline solution to equalize the pH in 8, the pH of the experiments. The initial pH varied between (9 - 11), since the biodiesel and glycerin used in the preparation of the effluent were non-pure and came from a homogeneous catalytic process that used potassium hydroxide (KOH) as a catalyst and methyl alcohol as reagent. Therefore, in addition to the high alkalinity resulting from potassium hydroxide, methyl alcohol contributed to the wastewater to present a high quantity and dissolved organic material.
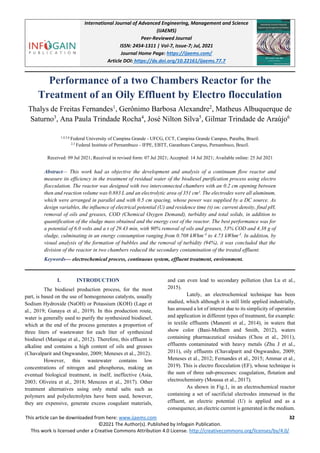
  • 6. Thalys de Freitas Fernandes et al. International Journal of Advanced Engineering, Management and Science, 7(7)-2021 This article can be downloaded from here: www.ijaems.com 37 ©2021 The Author(s). Published by Infogain Publication. This work is licensed under a Creative Commons Attribution 4.0 License. http://creativecommons.org/licenses/by/4.0/ Table 2: Results of physical-chemical analyzes for wastewater from biodiesel purification. Physical-chemical parameters Values Initial pH 9 – 11 Experiment pH * 8 Temperature (ºC) 23 - 25 Conductivity (μScm-1 ) 936.7-1198 Total Solids (gL-1 ) 1.6317 Chemical Oxygen Demand (mgL-1 ) 1276.03 Oils and Greases (mgL-1 ) 1598.1 Turbidity (NTU) 236.83 * Value adjusted with 1M HCl and NaOH solutions. 3.1 Influence of residence time and electrical potential The behavior of the electric current density was monitored for each experiment and recorded according to the profiles of (Fig.6). These values were obtained according to (Kobya et al., 2016; Yang Liu et al., 2018), calculating the ratio between the electric current registered in the DC source, over time, by the sum of the reaction area of all electrodes of the electrochemical cell, which is 351 cm². The initial conductivity for the experiments was 1063, 1198, 1192 and 936.7 μScm-1 , respectively. According to Moussa et al., (2017), conductivity is essential for the electrochemical processes of wastewater treatment, as it guarantees the conduction of current in the environment and reduces energy consumption. Exp. (1 and 3) developed on the same average current density, which was approximately 1.6 mAcm-2 . Therefore, for a voltage of 3.6 volts, τ did not influence the current density of the experiment. On the other hand, the increase in voltage from 3.6 volts to 6 volts contributed to the increase in the current density of the Exp. (2 and 4) in comparison with the previous ones. This effect derives from Ohm's first law: that the potential (U) is proportional to the electric current (I) in the environment (Walsh, 1993). In addition, according to Faraday's Law, in electrolysis, the electric current is proportional to the amount of metal ions (Al) that are sacrificed at the anode, as can be seen in Eq. (4), (Gamage and Chellam, 2011; Tanneru and Chellam, 2012; Ammar et al., 2019). 3 Al M I t m n F +   =  (4) Adopting mAl 3+ is the mass of aluminum ions given off at the anode, I the electric current, t the electrolysis time, n the number of electrons in the redox reaction and F the Faraday constant. Therefore, the greater the applied potential, the greater the current density and, consequently, the greater the number of ions present in the medium, which contribute to sustaining the current at higher values (Priya and Jeyanthi, 2019). A comparison between Exp. (2 and 4) shows that for a voltage of 6 volts, the current density has stabilized at 3.6 and 4 mAcm-2 , respectively. This shows that the increase in τ caused a sudden increase in current density, as the consequent reduction in flow decreased the interaction between aluminum cations (Al3+ ) and hydroxy anions (OH- ). This resulted in a medium more saturated in ions than in hydroxy aluminum compounds, contributing to a higher current density value. Fig.6: Current density behavior over the treatment time. 0 0.5 1 1.5 2 2.5 3 3.5 4 4.5 0 1 5 10 15 20 25 30 35 40 Current density (mAcm -2 ) Time (min) 17,66 min; 3,6 volts 17,66 min; 6,0 volts 29,43 min; 3,6 volts 29,43 min; 6,0 volts
  • 7. Thalys de Freitas Fernandes et al. International Journal of Advanced Engineering, Management and Science, 7(7)-2021 This article can be downloaded from here: www.ijaems.com 38 ©2021 The Author(s). Published by Infogain Publication. This work is licensed under a Creative Commons Attribution 4.0 License. http://creativecommons.org/licenses/by/4.0/ The changes in the pH behavior over the treatment time were monitored and recorded according to the profiles in (Fig.7), for an initial pH equal to 8. The graphic analysis shows that the pH decreased for all experiments, stabilizing in the range (6.53 and 7.35), as final pH. Behavior that was also observed by (Meneses et al., 2012; Ammar and Akbar, 2018). With the exception of Exp. (2), the pH hardly changed between the initial 10 min and showed a linear trend for all tests in the interval from 0.0 to 25 min of experiment, from which it became constant until the end of the experiment. Exp. (1 and 3) showed values approximately equal to 7.0 for the final pH, verifying that for a voltage of 3.6 volts, the τ variation did not influence the final result. However, when the voltage was increased to 6 volts in Exp. (2 and 4), there was a small influence of τ on the final pH. For an initial pH less than or equal to 8.0, the increase in voltage caused the reduction of OH- molecules, which gave rise to cationic hydroxide species, such as Al(OH)2+ , Al(OH)2 + , Al2(OH)2 4+ , Al(OH)3 (Saur et al., 1996; Ammar et al., 2019). However, the formation of these compounds can be more accentuated, if the time that the anionic species (OH- ) meet with the cationic species (Al3+ ) is reduced. This is the case of Exp. (2) when compared to Exp. (4), that is, the reduction in τ, which is due to the increase in the volumetric flow at the reactor inlet, favors greater agitation of the medium. Thus, more hydroxy - aluminum compounds are formed and, consequently, the reduction of free hydroxyls decreases the alkalinity of the medium. Fig.7: Influence of residence time and electrical potential on the final pH. In Fig. (8 and 9) the behaviors of the variables, efficiency of removal of O&G and COD, respectively, are presented. The joint analysis of the profiles shows that for a τ of 29.43 min and a potential of 6 volts it is possible to obtain the greatest removals of oils and greases (90%) and COD (53%), approximately. According to (Ammar et al., 2019), for a pH between 6 and 9, the greater the electrical potential the more insoluble compounds of Al(OH)3 are formed, and the greater the τ, the longer the interaction time between the coagulant with the particles oily, allowing greater removal by coagulation and, consequently, by flotation. In addition, a higher τ implies a lower volumetric flow at the reactor inlet, therefore, the less force the flow exerts on impurities that are coagulated, minimizing their fragmentation and, therefore, improving the removal of O&G and COD. The greater efficiency of O&G and COD removal contrasted with a higher generation of turbidity and TS. For, for the same experimental conditions, more Al(OH)3 is generated and, consequently, more insoluble material is formed and dispersed in the medium. The profiles of turbidity removal and TS are shown in Fig. (10 and 11), respectively. As noted, the best removals (94%) and (49%) were obtained for an electrical potential of 6 volts and an τ of 17.66 min. That is, for the same amount of Al(OH)3 produced and for the same flotation rate, a shorter interaction time between the impurities and Al(OH)3 results in a lower coagulation rate of oily contaminants. As a consequence, only the micro particles with a larger surface area are removed, mostly, by flotation, as well as Al(OH)3, which is also carried to the liquid surface, resulting in less turbidity and TS. 6 6.5 7 7.5 8 8.5 0 5 10 15 20 25 30 35 40 pH Time (min) 17,66 min; 3,6 volts 17,66 min; 6,0 volts 29,43 min; 3,6 volts 29,43 min; 6,0 volts
  • 8. Thalys de Freitas Fernandes et al. International Journal of Advanced Engineering, Management and Science, 7(7)-2021 This article can be downloaded from here: www.ijaems.com 39 ©2021 The Author(s). Published by Infogain Publication. This work is licensed under a Creative Commons Attribution 4.0 License. http://creativecommons.org/licenses/by/4.0/ Fig.8: Influence of residence time and electrical potential on the removal of oils and greases. Fig.9: Influence of residence time and electrical potential on COD removal. Fig.10: Influence of residence time and electrical potential on the removal of turbidity. 0.0 20.0 40.0 60.0 80.0 100.0 0 5 10 15 20 25 30 35 40 O&G removal (%) Time (min) 17,66 min; 3,6 volts 17,66 min; 6,0 volts 29,43 min; 3,6 volts 29,43 min; 6,0 volts 0.00 10.00 20.00 30.00 40.00 50.00 60.00 0 5 10 15 20 25 30 35 40 DQO removal (%) Time (min) 17,66 min; 3,6 volts 17,66 min; 6,0 volts 29,43 min; 3,6 volts 29,43 min; 6,0 volts 0 20 40 60 80 100 120 0 5 10 15 20 25 30 35 40 Turbidity removal (%) Time (min) 17,66 min; 3,6 volts 17,66 min; 6,0 volts 29,43 min; 3,6 volts 29,43 min; 6,0 volts
  • 9. Thalys de Freitas Fernandes et al. International Journal of Advanced Engineering, Management and Science, 7(7)-2021 This article can be downloaded from here: www.ijaems.com 40 ©2021 The Author(s). Published by Infogain Publication. This work is licensed under a Creative Commons Attribution 4.0 License. http://creativecommons.org/licenses/by/4.0/ Fig.11: Influence of residence time and electrical potential on the removal of total solids. The joint analysis on the efficiency of removing O&G, COD, turbidity and TS, allows us to infer that it is in the interval of 0.0 to 10 minutes that the highest rates of removal of impurities from biodiesel wastewater are obtained. In addition, it can be said that the removals become practically constant after the 25 minutes of the experiment. Characteristics that were also observed by (Chavalparit and Ongwandee, 2009; Priya and Jeyanthi, 2019; Ammar et al., 2019). 3.2 Global analysis of the physical-chemical parameters of the effluent Fig.12 contains the best results for the physical- chemical parameters of biodiesel wastewater after treatment. It is possible to compare the results of the final concentrations of O&G, COD, TS and turbidity, with the respective initial values for effluent, before treatment, in addition to also comparing them with the limits established by Brazilian legislation (CONAMA, 2011). As already seen, Exp. (4) presented the best results for O&G and COD, with removals above 90% and 53%, respectively. The low COD removal compared to oils and greases is due to the large volume of alcohol used in the synthesis of biodiesel, which cannot be removed by the electro flocculation process (Chavalparit and Ongwandee, 2009). The COD removal efficiency was close to the values obtained by (Siles et al., 2010) and (Chavalparit and Ongwandee, 2009), 45% and 55%, respectively. However, with lower O&G removal efficiency than that obtained by those and by Meneses et al., (2012), for wastewater for the purification of biodiesel. Exp. (2) had the best results for ST and turbidity, with removals above 49% and 94%, respectively. The analysis of Fig.12 also shows that the only parameter that meets the Brazilian legislation (CONAMA, 2011) is turbidity. Thus, even though the reactor has a good efficiency in removing O&G and turbidity, the effluent needs to undergo a post-treatment before being released into the environment, because the high COD values (589.3 mgL- 1 ) and TS (825 mgL-1 ) may favor eutrophication of the water environment (Menezes et al., 2017). A suggestion would be the insertion of the same system in series, or a biological system to reduce COD, or even decantation and/or post- reactor PE filtration units to reduce the TS concentration. 0 10 20 30 40 50 0 5 10 15 20 25 30 35 40 TS removal (%) Time (min) 17,66 min; 3,6 volts 17,66 min; 6,0 volts 29,43 min; 3,6 volts 29,43 min; 6,0 volts
  • 10. Thalys de Freitas Fernandes et al. International Journal of Advanced Engineering, Management and Science, 7(7)-2021 This article can be downloaded from here: www.ijaems.com 41 ©2021 The Author(s). Published by Infogain Publication. This work is licensed under a Creative Commons Attribution 4.0 License. http://creativecommons.org/licenses/by/4.0/ Fig.12: Comparison between the best results obtained for the physical-chemical parameters of wastewater from biodiesel purification. 3.3 Sludge removal Sludge removal is directly related to the flotation of contaminants previously coagulated and flocculated by Al(OH)3 (Kobya et al., 2016). The EF reactor with two chambers was developed with the prerogative that the flotation occurred practically in the region where the electrochemical cell was located. In (Fig.13) the upper image of the reactor is shown, with emphasis on the H2(g) and O2(g) bubbles, which emerged onto the liquid surface surrounding the coagulated material, called wet sludge. It is possible to notice that the bubbles ascended practically in the first chamber, thus minimizing the contamination of the effluent that flowed into the second chamber of the EF reactor. This statement was ratified by the high removal of turbidity (94%), since it represents all the insoluble organic and inorganic solids in the medium (APHA, 2005), which were largely removed in the first chamber. The wet sludge collected by the reactor channel was subsequently dried in the oven and quantified for all tests, the values of which were presented in Fig.14. According to the masses obtained, for a voltage of 3.6 volts and regardless of residence time, practically the same amount of sludge, Exp. (1 and 3), was obtained. On the other hand, with the increase in electrical potential to 6.0 volts, Exp. (2 and 4), the amount of sludge removed was practically doubled. However, this amount is slightly higher for Exp. (4), which operated with a τ equal to 29.43 min. Therefore, it can be inferred that a greater amount of sludge is obtained at the same time that significant removals of O&G and COD are achieved. Fig.13: Top view of the electro flocculation reactor used in the treatment of wastewater for the purification of biodiesel after an experiment. (Source: research’ image). 1598.1 1276.0 1631.7 236.8 144.7 589.3 825.5 12.3 50 400 500 40 0.0 300.0 600.0 900.0 1200.0 1500.0 1800.0 Oil & Grease COD Total Solids Turbidity Content (mgL -1 or NTU) Initial value Final value CONAMA
  • 11. Thalys de Freitas Fernandes et al. International Journal of Advanced Engineering, Management and Science, 7(7)-2021 This article can be downloaded from here: www.ijaems.com 42 ©2021 The Author(s). Published by Infogain Publication. This work is licensed under a Creative Commons Attribution 4.0 License. http://creativecommons.org/licenses/by/4.0/ Fig.14: Mass of dry sludge removed in the biodiesel wastewater PE process. 3.4 The energy consumed by the EF reactor The energy (E) spent in the EF reactor for each m³ of treated effluent was calculated using Eq.3 for all experiments, as shown in (Table 3). For this, it was necessary to determine the volume of treated effluent (Vt) and the current mean (Im), whose selected interval was between 10 and 40 minutes (Fig.6), a period in which the current density values became approximately constant. With the values of E, the energy cost (EC) per m³ of treated effluent was also calculated, multiplying E by the low voltage industrial tariff, which is R$ 0.49766 per kWh, according to (ENERGISA, 2020) to the state of Paraiba, Brazil. The analysis of Table 3 shows that the energy consumption varied between 0.708 and 4.73 kWhm-3 , which is equivalent to between R$ 0.35 and R$ 2.36 per m³ of treated effluent. The highest consumptions occurred in the experiments that obtained the greatest removal of contaminants, that is, Exp. (2 and 4), respectively. Electricity consumption was close to the values found by Chavalparit and Ongwandee (2009); Meneses et al., (2012) and Fernandes et al., (2015), who obtained respectively: 5.57 kWhm-3 , 0.65–2.33 kWhm-3 , 2.07 kWhm-3 , in the treatment of biodiesel wastewater. Energy costs can be minimized by optimizing this reactor, adding, for example, renewable energy generators, such as photovoltaic or wind systems (Rahmani et al., 2017). Table 3: Results of the energy spent and the cost obtained with the EF reactor for 40 min of experiment. Experiment τ U Vt Im E EC (minutes) (volts) (L) (A) (kWh.m-3 ) (R$.m-3 ) 1 17,66 3,6 2 0,59 0,708 0,35 2 17,66 6 2 1,27 2,54 1,26 3 29,43 3,6 1,2 0,57 1,14 0,57 4 29,43 6 1,2 1,42 4,73 2,36 IV. CONCLUSIONS The experimental results showed that: 1) the EF reactor reached its best removal efficiency when it was operated with a potential of 6.0 volts and with a τ of 29.43 min, in which removals above 90% for oils and greases and 53% for COD were achieved, in addition to greater sludge removal (4.38g). On the other hand, for the same applied potential, when the τ was reduced to 17.66 min, those removals were reduced and the reactor started to obtain better performance for the removal of turbidity (94%) and total solids (49%). 2) the electrical potential (U) and the residence time (τ) are parameters that are intrinsically linked with the greater or lesser formation of the coagulant agent - Al(OH)3 and, therefore, influenced in all the system responses variables. 3) the visualization of gas bubbles on the liquid surface of the first chamber of the reactor and their absence in the second chamber, showed that the section of the EF reactor 1.88 3.92 2.06 4.38 0 1 2 3 4 5 1 2 3 4 Sludge removal (g) Experiment
  • 12. Thalys de Freitas Fernandes et al. International Journal of Advanced Engineering, Management and Science, 7(7)-2021 This article can be downloaded from here: www.ijaems.com 43 ©2021 The Author(s). Published by Infogain Publication. This work is licensed under a Creative Commons Attribution 4.0 License. http://creativecommons.org/licenses/by/4.0/ in two compartments was important to minimize the contamination of the treated effluent, which left the reactor through the second chamber, the results of which were confirmed with the removal of more (94%) of turbidity. 4) the energy spent with the EF reactor proved to be consistent with other values in the literature, which varied between 0.708 and 4.73 kWhm-3 of treated effluent, the last value being obtained for its best performance. 5) wastewater from the purification of biodiesel, still needs to undergo a post-treatment before being released into the environment, because it is an effluent with a high COD, originating from glyceric organic matter and a large amount of residual methanol, which could not be removed by electro flocculation. 6) the EF reactor showed significant efficiency for the removal of insoluble solids - oils and greases and turbidity - when used in the treatment of wastewater for the purification of biodiesel. However, it would be interesting to combine it with another treatment system, for example, an activated sludge, chemical coagulation system, or even a physical separation system, such as filters and decanters, to ensure better COD and total solids removal efficiency. REFERENCES [1] Abdelwahab, O., Amin, N.K., El-Ashtoukhy, E.S.Z., 2009. Electrochemical removal of phenol from oil refinery wastewater. J. Hazard. Mater. 163 (2 - 3), 711 - 716. [2] Ammar, H.S., Akbar, S. A., 2018. Oil field produced water treatment in internal-loop airlift reactor using electrocoagulation/flotation technique. Chinese J. Chem. Eng. 26, 879–885. [3] Ammar, H.S., Ismail, A.D., Abbas, M. W., 2019. Electrocoagulation technique for refinery wastewater treatment in the internal loop split-plate airlift reactor. Journal of Environmental Chemical Engineering. v.7, n.6, 103489. [4] APHA. Standard Methods for Examination of Water and Wastewater., 2005. 21th ed. Washington: American Public Health Association. [5] Asia, U. N. E. a. S. C. f. W., 2003. Wastewater Treatment Technologies: a General Review. Economic and Social Commission for Western Asia, United Nations. [6] Bani-Melhem, K., Smith, E., 2012. Grey water treatment by a continuous process of an electrocoagulation unit and a submerged membrane bioreactor system. Chemical Engineering Journal. 198 and 199, 201 and 210. [7] Chavalparit, O., Ongwandee, M., 2009. Optimizing electrocoagulation process for the treatment of biodiesel wastewater using response surface methodology. Journal of Environmental Sciences. v.21, n. 11, p. 1491-1496. [8] Chaudhary, R., Sahu, O.P., 2013. Treatment of sugar wastewater by electrocoagulation. J. Atmos. Pollut. 1 (1), 5 – 7. [9] Chou, W.L., Wang, C.T., Huang, K.Y., Liu, T.C., 2011. Electrochemical removal of salicylic acid from aqueous solutions using aluminum electrodes. Desalination. 271, 55- 61. [10] CONAMA - National Council for the Environment. RESOLUTION n° 430, de 13 de March de 2011. Ministry of the Environment. Available in <http://www.mma.gov.br/port/conama>. Accessed in 20/05/2020. [11] ENERGISA. Power Distribution Company in the State of Paraiba. Website: www.energisa.com.br/. Accessed in 20/07/2020. [12] Fernandes, F. T., Alexandre, B. G., Silva, N. J., Araújo, T. G., 2015. Experimental plant for the treatment of effluent from the production of biodiesel. Scientific Congress of Engineering and Agronomy – CONTECC, v.2, p. 1-4. [13] Fei L., Zhaoxiang Z., Zenglin W., Xiaqing L., Xiaodong D., Liqiang W., Xuewu W., Zhenhe Y., Jie Z., Mengxin C., Shuo W., 2019. Experimental study on treatment of tertiary oil recovery wastewater by electrocoagulation. Chemical Engineering & Processing: Process Intensification. 144, 107640. [14] Gamage, N.P., Chellam, S., 2011. Aluminum electrocoagulation pretreatment reduces fouling during surface water microfiltration, J. Membr, v. 379 (1–2), p. 97– 105. [15] Gardiman Junior, B. S., Garcia, G. O., Reis, E. F., 2019. Definition of hydraulic retention time (trh) and efficiency in the treatment of coffee wastewater by an electrolytic system. Virtual Journal of Chemistry. 11 (1), 82 – 103. [16] Gatsios, E., Hahladakis, J.N., Gidarakos, E., 2015. Optimization of electrocoagulation (EC) process for the purification of a real industrial wastewater from toxic metals. J. Environ. Manag. 154, 117-127. [17] Georg, C.I., Rezende, P.V.R., Maliska, R.C., 2008. Numerical study of the upward flow of a gas bubble in a liquid medium. 1st Brazilian Meeting on Boiling, Condensing and Multiphase Liquid-Gas Flow. Federal University of Santa Catarina (UFSC). [18] Gobbi, L.R.A., 2013. Treatment of oily water by electroflocculation. Masters dissertation. North of Espirito Santo University Center. Federal University of Espirito Santo (UFES). [19] Hamdan, S.S., El-Naas, M.H., 2014. An electrocoagulation column (ECC) for groundwater purification. J. Water Process Eng. 4, 25 - 30. [20] Holt, P.K., Barton, G.W., Wark, M., Mitchell, C.A., 2002. A quantitative comparison between chemical dosing and electrocoagulation. Colloid Surf. A Physicochem. Eng. Asp 211, 233 - 248. [21] Kobya, M., Gengec, E., Demirbas, E., 2016. Operating parameters and costs assessments of a real dyehouse wastewater effluent treated by a continuous electrocoagulation process. Chem. Eng. Process. Process Intensif. 101, 87 - 100. [22] Jun Lu., Yan Li., Mengxuan Yin., Xiaoyun Ma., Shengling Lin. Removing heavy metal ions with continuous aluminum electrocoagulation: a study on back mixing and utilization
  • 13. Thalys de Freitas Fernandes et al. International Journal of Advanced Engineering, Management and Science, 7(7)-2021 This article can be downloaded from here: www.ijaems.com 44 ©2021 The Author(s). Published by Infogain Publication. This work is licensed under a Creative Commons Attribution 4.0 License. http://creativecommons.org/licenses/by/4.0/ rate of electro-generated al ions., 2015. Chemical engineering journal, v. 267, p. 86 – 92. [23] II’In,V.I., Sedashova, O.N., 1999. Industrial ecology – An electroflotation method and plant for removing oil products from effluents. Chemical and Petroleum Engineering. V.35, pp. 07 – 08. [24] Lage, A.H.A., Gonçalves, T.R, Oliveira, A de. U., Saliba, A.W., 2019. Analysis of transesterification and hydrohisterification processes in biodiesel production. Journal of Exact Sciences – JES. 21, 09-14. [25] Leite, J. C. A. Study of a reactor for electroflotation of wastewater from the oil industry with a view to its reuse., 2009. Doctoral Thesis. Science and Technology Center - Process Engineering. Federal University of Campina Grande. [26] Mansoorian, H.J., Mahvi, A.H., Jafari, A.J., 2014. Removal of lead and zinc from battery industry wastewater using electrocoagulation process: influence of direct and alternating current by using iron and stainless steel rod electrodes. Sep. Purif. Technol. 135, 165-175. [27] Yang Liu., Jie Yang., Wenming Jiang., Yimei Chen., Chaojiang Yang., Tianyu Wang., Yuxing Li., 2018. Experimental studies on the enhanced performance of lightweight oil recovery using a combined electrocoagulation and magnetic field processes. Chemosphere. 205, 601- 609. [28] Manenti, D.R., M_odenes, A.N., Soares, P.A., Espinoza- Quiñones, F.R., Boaventura, R.A.R., Bergamasco, R., Vilar, V.J.P., 2014. Assessment of a multistage system based on electrocoagulation, solar photo-Fenton and biological oxidation processes for real textile wastewater treatment. Chemical Engineering Journal. 252, 120-130. [29] Menezes, F.L.G., Silva, A.J.C., Martínez-Huitle, C.A., Zanta, C.L.P.S., Alves, J.J.F., Castro, S.S.L., 2017. Electrochemical treatment of shrimp farming effluent: role of electrocatalytic material. Environ. Sci. Pollut. Res. 24, 6061 e 6070. [30] Meneses, J.M.; Vasconcelos, R. F., Fernandes, T. F., Araújo, G. T., 2012. Treatment of biodiesel wastewater by electrocoagulation/flotation process: investigation of operational parameters. Química Nova. v. 35, n. 2, p. 235- 240. [31] Montgomery, D. C., Runger, G. C., Hubele, N. F., 2004. Statistics Applied to Engineering. Second edition. Rio de Janeiro. LCT Publisher. [32] Moussa, T. D., El-Naas, H. M., Nasser, M., Al-Marri, J.M., 2017. A comprehensive review of electrocoagulation for water treatment: Potentials and challenges. Journal of Environmental Management. 186, 24-41. [33] Oliveira, S.M.E., Silva, R.F., Morais, O.C.C., Oliveira, F.B.T., Martínez-Huitle, A.C., Motheo, J.A., Albuquerque, C.C., Castro, L.S.S., 2018. Performance of (in)active anodic for the electro-oxidation of phenolic wastewaters from cashew-nut processing industry. Chemosphere. 201, 740- 748. [34] Priya, M., Jeyanthi, J., 2019. Removal of COD, oil and grease from automobile wash water effluent using electrocoagulation technique. Microchemical Journal. 150, 104070. [35] Gunaya, E.M., Turkerb, L. E., Tapanc, A. N., 2019. Significant parameters and technological advancements in biodiesel production systems. Fuel. 250, 27 – 41. [36] Manique, M.C., Faccini, C.S., Onorevoli, B., Benvenutti, E.V., Caramão, E.B., 2012. Rice husk ash as an adsorbent for purifying biodiesel from waste frying oil. Fuel. 92, 56 – 61. [37] Rahmani, M., Zerrouki, D., Djafer, L., Ayral, A., 2017. Hydrogen recovery from the photovoltaic electroflocculation-flotation process for harvesting Chlorella pyrenoidosa microalgae. International Journal of hydrogen energy. 30, I-6. [38] Saur, F.I., Rubach, S., Forde, S. J., Kjaerheim, G., Syverser, U., 1996. Electroflocculation: Removal of oil, heavy metals and organic compounds from oil-in-water emulsions. Filtration & Separation. 295 – 301. [39] Siles, A. J., Martím, A. M., Chica, F.A., Martín, A., 2010. Aerobic co-digestion of glycerol and wastewater derived from biodiesel manufacturing. Bioresource Tecnology. 101, 6315 – 6321. [40] Tanneru, C.T., Chellam, S., 2012. Mechanisms of virus control during iron electrocoagulation - microfiltration of surface water. Water Res, v. 46 (7), p. 2111 – 2120. [41] Tezcan Un, U., Koparal, A. S., Ogutveren, U. B., 2013. Fluoride removal from water and wastewater with a bach cylindrical electrode using electrocoagulation. Chemical Engineering Journal. v. 223, p. 110 – 115. [42] Vepsalainen, M., 2012. Electrocoagulation in the Treatment of Industrial Waters and Wastewaters. Doctor of Science (Technology). Lappeenranta University of Technology. [43] Walsh, F.C., 1993. A first course in electrochemical engineering. Electrochemical Engineering Consultancy. England. 381p. [44] Xu, H.Y., 2016. Investigation of the Optimizing Control Strategy and Dissolution/passivation Mechanism during Electrocoagulation Process for Heavy Metals Wastewater Treatment. PhD thesis. Environment Science and Engineering. Hunan University. [45] Zhu J., Wu F., Pan X., Guo J., Wens D., 2011. Removal of antimony from antimony mineflotation wastewater by electrocoagulation with aluminum electrodes. Journal of Environmental Sciences, v. 23, n.7, p. 1066 – 1071.