ecopro 086520 Algorithm Investment Report
•
0 likes•7 views

ecopro 086520 Algorithm Investment Report
![[Price for scheduled purchasing]
Arbitrarily made
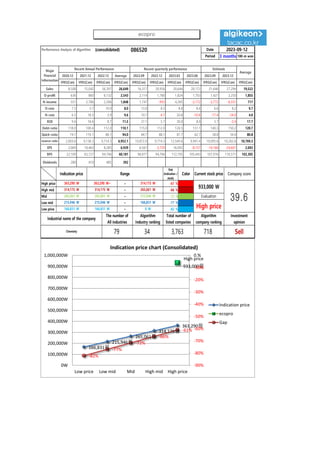
Algorithm stocks Trading Strategies (consolidated) 086520 Date
Period
Gap
(Indication /
stock)
Color
2023-09-12
3 months
Current stock price Evaluation
Stock price rise
probability score
Investment opinion Prospective purchase amount
933,000 W High price 38.7 Sell 1,666,000 W
Suggested Purchase
Amount 362,940 W
Number of stocks
purchased 0
Indication price Range Buying / Selling Buying / Selling [Stocks]
High price 363,290 W 363,290 W~ ~ 314,175 W -61 % 221,619 W 1
High mid 314,175 W 314,175 W ~ 265,061 W -66 % 240,725 W 1
Mid 265,061 W 265,061 W ~ 215,946 W -72 % 259,830 W 1
Low mid 215,946 W 215,946 W ~ 166,831 W -77 % 278,936 W 1
low price 166,831 W 166,831 W ~ 0 W -82 % 298,042 W 2
Stock price rise
probability score
A Sector 46.8 47.2 52.1 50.2 47.9 51.2
38.7
B Sector 23.8 32.9 30.8 50.2 34.6 31.3
Total average
2023.04.17 2023.05.17 2023.06.16 2023.07.14 2023.08.11 2023.09.11
35.3 40.1 41.5 35.4 41.2 41.2
14 % 0 %
2023.05.17 2023.06.16 2023.07.14 2023.08.11 2023.09.11
Total of
increase rate
Total score
A Sector 1 % 9 % -4 % -5 % 7 %
2 % 49.3
B Sector 28 % -7 % 39 % -45 % -11 %
Total average 12 % 3 % -17 %
47 47
52 50 48
51
24
33 31
50
35
31
35
40 41
35
41 41
0
10
20
30
40
50
60
2023.04.17 2023.05.17 2023.06.16 2023.07.14 2023.08.11 2023.09.11
Stock price rise probability score
A sector
B sector
Total average
1%
9%
-4% -5%
7%
28%
-7%
39%
-45%
-11%
12%
3%
-17%
14%
0%
-60%
-40%
-20%
0%
20%
40%
60%
2023.05.17 2023.06.16 2023.07.14 2023.08.11 2023.09.11
Increase rate of stock price rise
A sector
B sector
Total average
ecopro](data:image/gif;base64,R0lGODlhAQABAIAAAAAAAP///yH5BAEAAAAALAAAAAABAAEAAAIBRAA7)
Recommended
Recommended
More Related Content
Similar to ecopro 086520 Algorithm Investment Report
Similar to ecopro 086520 Algorithm Investment Report (20)
More from 알고리즘 기업분석 컨설팅-알기컨,algikeon
More from 알고리즘 기업분석 컨설팅-알기컨,algikeon (20)
Recently uploaded
Recently uploaded (20)
ecopro 086520 Algorithm Investment Report
- 1. Performance Analysis of Algorithm (consolidated) 086520 Date Period 3 months 100-m won 2020.12 2021.12 2022.12 Average 2022.09 2022.12 2023.03 2023.06 2023.09 2023.12 IFRS(Con) IFRS(Con) IFRS(Con) IFRS(Con) IFRS(Con) IFRS(Con) IFRS(Con) IFRS(Con) IFRS(Con) IFRS(Con) IFRS(Con) Sales 8,508 15,042 56,397 26,649 16,317 20,956 20,644 20,172 21,646 27,294 19,522 O-profit 636 860 6,132 2,543 2,114 1,780 1,824 1,703 1,427 2,250 1,855 N-income 551 2,786 2,206 1,848 1,747 -993 4,285 -2,172 -3,772 -6,551 717 O-rate 7.5 5.7 10.9 8.0 13.0 8.5 8.8 8.4 6.6 8.2 9.7 N-rate 6.5 18.5 3.9 9.6 10.7 -4.7 20.8 -10.8 -17.4 -24.0 4.0 ROE 9.4 16.4 8.7 11.5 27.1 5.7 30.0 8.0 3.7 -2.4 17.7 Debt-ratio 118.0 100.4 112.0 110.1 115.0 112.0 124.5 131.1 140.3 150.2 120.7 Quick-ratio 74.7 119.1 88.1 94.0 84.7 88.1 87.7 62.7 58.8 59.4 80.8 reserve-ratio 2,003.6 9,138.3 9,714.3 6,952.1 10,872.0 9,714.3 12,549.6 9,941.4 10,095.6 10,262.6 10,769.3 EPS 2,069 10,463 8,285 6,939 6,561 -3,729 16,092 -8,157 -14,166 -24,601 2,692 BPS 22,109 63,727 94,706 60,181 96,877 94,706 112,195 105,443 107,976 110,571 102,305 Dividends 280 410 485 392 2023-09-12 Major Financial Information Recent Annual Performance Recent quarterly performance Estimate Average Gap (Indication / stock) Color High price ~ -61 % High mid ~ -66 % Mid ~ -72 % Low mid ~ -77 % Low price ~ -82 % Indication price Range Current stock price Company score 314,175 W 314,175 W 265,061 W 265,061 W 265,061 W 215,946 W Evaluation 363,290 W 363,290 W~ 314,175 W 933,000 W 39.6 215,946 W 215,946 W 166,831 W High price Sell 166,831 W 166,831 W 0 W Industrial name of the company The number of All industries Algorithm Industry ranking Total number of listed companies Algorithm company ranking Investment opinion Chemistry 79 34 3,763 718 166,831원 215,946원 265,061원 314,175원 363,290원 High price 933,000원 -82% -77% -72% -66% -61% -90% -80% -70% -60% -50% -40% -30% -20% -10% 0.% 0W 100,000W 200,000W 300,000W 400,000W 500,000W 600,000W 700,000W 800,000W 900,000W 1,000,000W Low price Low mid Mid High mid High price Indication price chart (Consolidated) Indication price ecopro Gap ecopro
- 2. [Price for scheduled purchasing] Arbitrarily made Algorithm stocks Trading Strategies (consolidated) 086520 Date Period Gap (Indication / stock) Color 2023-09-12 3 months Current stock price Evaluation Stock price rise probability score Investment opinion Prospective purchase amount 933,000 W High price 38.7 Sell 1,666,000 W Suggested Purchase Amount 362,940 W Number of stocks purchased 0 Indication price Range Buying / Selling Buying / Selling [Stocks] High price 363,290 W 363,290 W~ ~ 314,175 W -61 % 221,619 W 1 High mid 314,175 W 314,175 W ~ 265,061 W -66 % 240,725 W 1 Mid 265,061 W 265,061 W ~ 215,946 W -72 % 259,830 W 1 Low mid 215,946 W 215,946 W ~ 166,831 W -77 % 278,936 W 1 low price 166,831 W 166,831 W ~ 0 W -82 % 298,042 W 2 Stock price rise probability score A Sector 46.8 47.2 52.1 50.2 47.9 51.2 38.7 B Sector 23.8 32.9 30.8 50.2 34.6 31.3 Total average 2023.04.17 2023.05.17 2023.06.16 2023.07.14 2023.08.11 2023.09.11 35.3 40.1 41.5 35.4 41.2 41.2 14 % 0 % 2023.05.17 2023.06.16 2023.07.14 2023.08.11 2023.09.11 Total of increase rate Total score A Sector 1 % 9 % -4 % -5 % 7 % 2 % 49.3 B Sector 28 % -7 % 39 % -45 % -11 % Total average 12 % 3 % -17 % 47 47 52 50 48 51 24 33 31 50 35 31 35 40 41 35 41 41 0 10 20 30 40 50 60 2023.04.17 2023.05.17 2023.06.16 2023.07.14 2023.08.11 2023.09.11 Stock price rise probability score A sector B sector Total average 1% 9% -4% -5% 7% 28% -7% 39% -45% -11% 12% 3% -17% 14% 0% -60% -40% -20% 0% 20% 40% 60% 2023.05.17 2023.06.16 2023.07.14 2023.08.11 2023.09.11 Increase rate of stock price rise A sector B sector Total average ecopro
- 3. 정보와 완전 정보 결 투자판단 있습니 위배 무단으 숙지하 Compliance notice ① The information provided by The Algorithm Company Analysis Consulting is obtained through reliable data and information and The Algorithm Company Analysis Program (TACAP), but its accuracy or completeness are not guaranteed. Furthermore, it may change over time.Therefore, we are not legally responsible for the results of the data provided by The Algorithm Company Analysis Consulting because of information errors or omissions. ② The Algorithm Company Analysis Consulting and all the information provided on it site are reference materials for investment decisions and the final responsibility of investment is up to users utilizing this information. ③ The Algorithm Company Analysis Consulting and its site do not do anything that violates the related laws such as discretionary transaction. ④ Users can not reallocate and recycle the information provided by The Algorithm Company Analysis Consulting firm let alone the information provided by its Site. ⑤ Be sure to know about application period of this algorithm analysis report in order to improve its accuracy. Tel : 070 - 4667 - 5009 Email : tacac@tacac.co.kr Homepage : tacac.co.kr Blog : tacac.blog.me SERVICES M&A, IPO, RECOVER, CORPORATE RESTRUCTURING, MANAGEMENT OF TECHNOLOGY, BUSINESS STRATEGY, FAMILY BUSINESS Request : http://tacac.co.kr/?page_id=1374 ① Consulting is o The Algorithm accuracy or com change over tim results of the d Consulting bec ② information pr investment dec up ③ do anything th transaction. ④ The Algorithm information pr ⑤ analysis report