Download to read offline
![[Price for scheduled purchasing]
Arbitrarily made
Algorithm stocks Trading Strategies (Separate) 043610 Date
Period
Gap
(Indication /
stock)
Color
low price 6,970 W 6,970 W ~ 0 W 7 % -320,388 W -46
Low mid 9,029 W 9,029 W ~ 6,970 W 38 % -1,784,774 W -198
Mid 11,087 W 11,087 W ~ 9,029 W 70 % -3,249,159 W -293
High mid 13,146 W 13,146 W ~ 11,087 W 102 % -4,713,544 W All selling
Suggested Purchase
Amount 4,638,115 W
Number of stocks
purchased 711
Indication price Range Buying / Selling Buying / Selling [Stocks]
High price 15,205 W 15,205 W~ ~ 13,146 W 133 % -6,177,930 W All selling
2021-11-22
3 months
Current stock price Evaluation
Stock price rise
probability score
Investment opinion Prospective purchase amount
6,520 W Low price 44.2 Buy 10,000,000 W
Stock price rise
probability score
A Sector 54.5 52.3 45.9 46.6 48.6 48.6
44.2
B Sector 15.0 25.4 46.6 46.6 29.2 15.0
Total average 34.7 38.8 36.9 15.4 38.9 31.8
2021.06.24 2021.07.22 2021.08.20 2021.09.17 2021.10.22 2021.11.19
2021.08.20 2021.09.17 2021.10.22 2021.11.19
Total of
increase rate
Total score
A Sector -4 % -14 % 2 % 4 % 0 %
-19 % 45.3
B Sector 41 % 9 % 40 % -60 % -94 %
Total average 11 % -5 % -139 % 60 % -22 %
2021.07.22
-4%
-14%
2% 4% 0%
41%
9%
40%
-60%
-94%
11%
-5%
-139%
60%
-22%
-150%
-100%
-50%
0%
50%
100%
2021.07.22 2021.08.20 2021.09.17 2021.10.22 2021.11.19
Increase rate of stock price rise
A sector
B sector
Total average
genie music
54 52
46 47 49 49
15
25 28
47
29
15
35
39 37
15
39
32
0
10
20
30
40
50
60
2021.06.24 2021.07.22 2021.08.20 2021.09.17 2021.10.22 2021.11.19
Stock price rise probability score
A sector
B sector
Total average](https://image.slidesharecdn.com/geniemusic043610algorithminvestmentreport-211122005409/75/genie-music-043610-Algorithm-Investment-Report-2-2048.jpg)

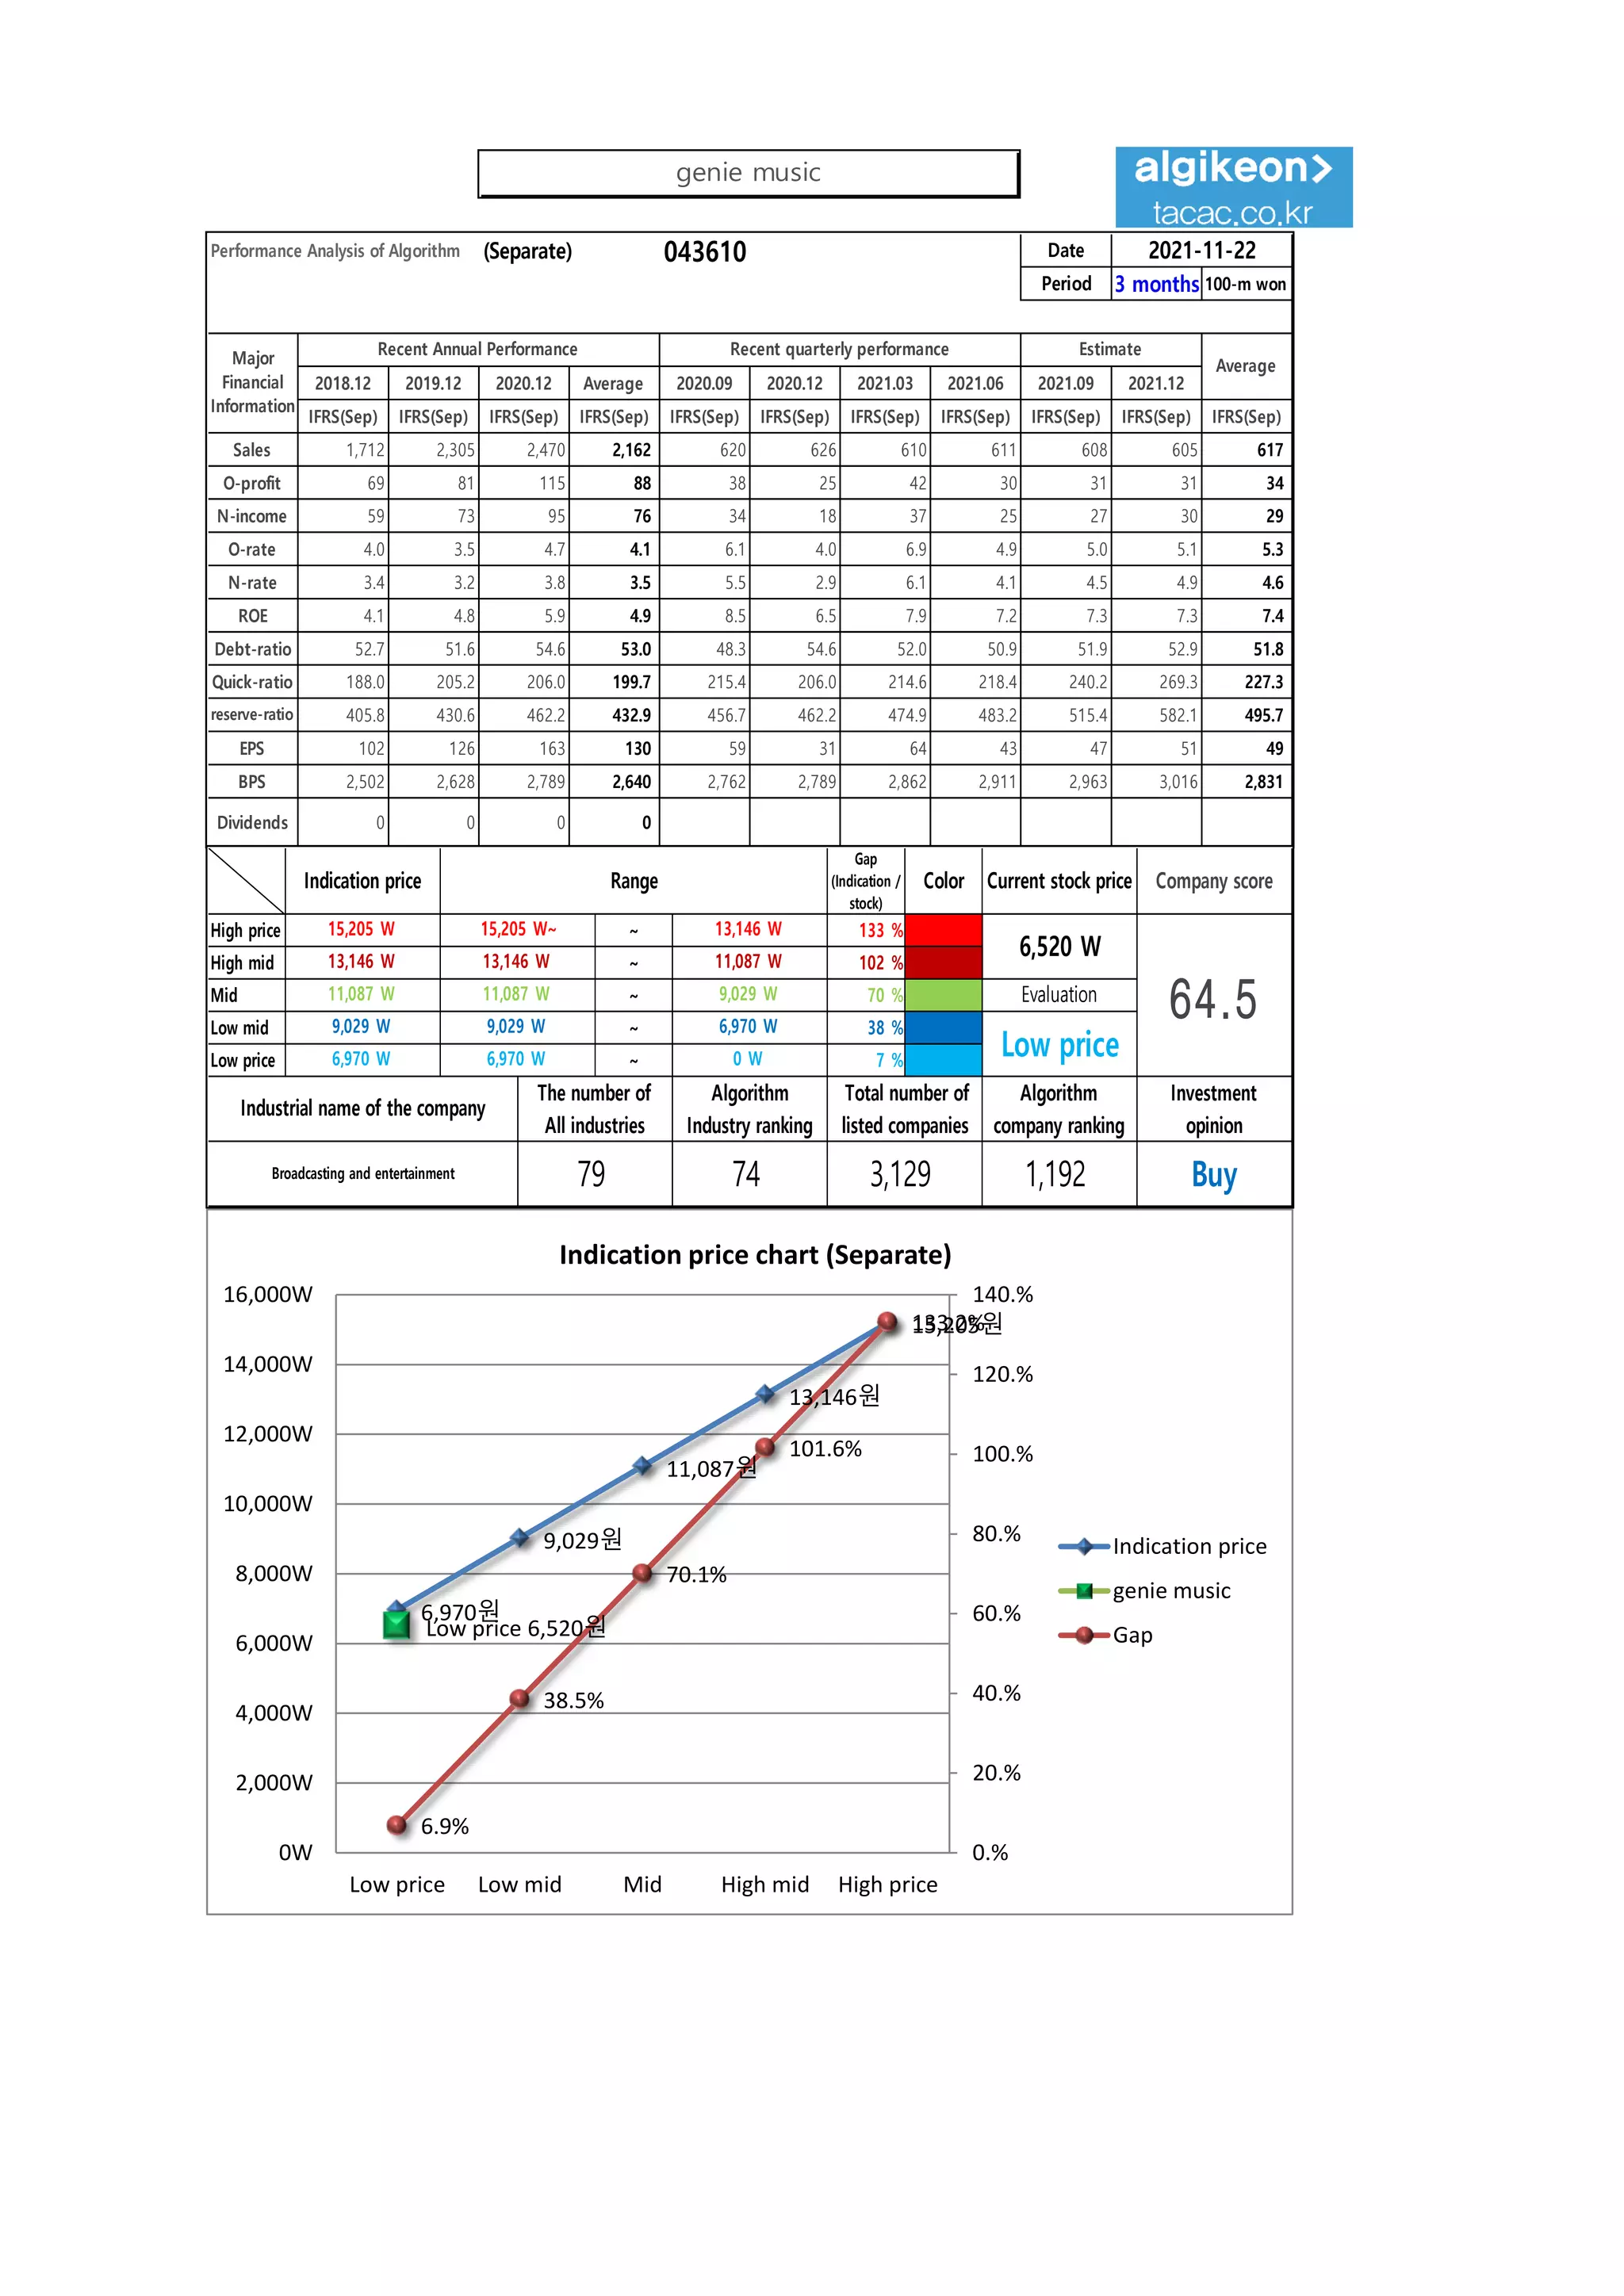
This document provides a performance analysis of an algorithm (separate) from December 2018 to November 2021. It includes quarterly and annual sales, operating profit, net income, profit margins, debt ratios, and other financial metrics. It also analyzes the company's stock price probability, trading strategies, and investment opinions. The analysis uses an algorithm program to evaluate the company and provide purchase recommendations.


![[웹케시]webcash 053580 Algorithm Investment Report](https://cdn.slidesharecdn.com/ss_thumbnails/webcash053580algorithminvestmentreport-250925003052-f31dd73c-thumbnail.jpg?width=640&height=640&fit=bounds)


![[쿠콘]coocon 294570 Algorithm Investment Report](https://cdn.slidesharecdn.com/ss_thumbnails/coocon294570algorithminvestmentreport-250926162409-bd6c1593-thumbnail.jpg?width=640&height=640&fit=bounds)

![[롯데웰푸드]lottewell food 280360 Algorithm Investment Report](https://cdn.slidesharecdn.com/ss_thumbnails/lottewellfood280360algorithminvestmentreport-251010014427-e0439c3a-thumbnail.jpg?width=640&height=640&fit=bounds)
![[더즌]dozn 462860 Algorithm Investment Report](https://cdn.slidesharecdn.com/ss_thumbnails/dozn462860algorithminvestmentreport-250920161038-b31c0a65-thumbnail.jpg?width=640&height=640&fit=bounds)
![[SFA반도체]SFA semicon 036540 Algorithm Investment Report](https://cdn.slidesharecdn.com/ss_thumbnails/sfasemicon036540algorithminvestmentreport-250219022804-aa8f2510-thumbnail.jpg?width=640&height=640&fit=bounds)

![[대상]Daesang 001680 Algorithm Investment Report](https://cdn.slidesharecdn.com/ss_thumbnails/daesang001680algorithminvestmentreport-250915063303-81c41298-thumbnail.jpg?width=640&height=640&fit=bounds)
![[헥토파이낸셜]hectofinancial 234340 Algorithm Investment Report](https://cdn.slidesharecdn.com/ss_thumbnails/hectofinancial234340algorithminvestmentreport-250917010057-0603ecf0-thumbnail.jpg?width=640&height=640&fit=bounds)
![[휴림로봇]hyulimrobot 090710 Algorithm Investment Report](https://cdn.slidesharecdn.com/ss_thumbnails/hyulimrobot090710algorithminvestmentreport-250923234005-7edfe548-thumbnail.jpg?width=640&height=640&fit=bounds)
![[동원산업]dongwon industries 006040 Algorithm Investment Report](https://cdn.slidesharecdn.com/ss_thumbnails/dongwonindustries006040algorithminvestmentreport-251003020532-5dd00f8a-thumbnail.jpg?width=640&height=640&fit=bounds)
![[삼성중공업] Samsung Heavy Industries 010140 Algorithm Investment Report](https://cdn.slidesharecdn.com/ss_thumbnails/samsungheavyindustries010140algorithminvestmentreport-250904015122-fe022f35-thumbnail.jpg?width=640&height=640&fit=bounds)
![[동서]dongsuh 026960 Algorithm Investment Report](https://cdn.slidesharecdn.com/ss_thumbnails/dongsuh026960algorithminvestmentreport-250226011658-61b0afaa-thumbnail.jpg?width=640&height=640&fit=bounds)
![[한국공항]Korea Airport Service 005430 Algorithm Investment Report](https://cdn.slidesharecdn.com/ss_thumbnails/koreaairportservice005430algorithminvestmentreport-250915064019-e6873549-thumbnail.jpg?width=640&height=640&fit=bounds)

![[동서]dongsuh 026960 Algorithm Investment Report](https://cdn.slidesharecdn.com/ss_thumbnails/dongsuh026960algorithminvestmentreport-251001020056-e986a251-thumbnail.jpg?width=640&height=640&fit=bounds)


![[삼성전자]samsung electronics 005930 Algorithm Investment Report](https://cdn.slidesharecdn.com/ss_thumbnails/samsungelectronics005930algorithminvestmentreport-250227014600-4fa86dc7-thumbnail.jpg?width=640&height=640&fit=bounds)
![동원fnb 049770 알고리즘 기업분석 보고서 [알고리즘 기업분석 컨설팅-알기컨]](https://cdn.slidesharecdn.com/ss_thumbnails/fnb049770-250224032312-db728faf-thumbnail.jpg?width=640&height=640&fit=bounds)
![대상 001680 알고리즘 기업분석 보고서 [알고리즘 기업분석 컨설팅-알기컨]](https://cdn.slidesharecdn.com/ss_thumbnails/001680-250303132112-443c504a-thumbnail.jpg?width=640&height=640&fit=bounds)