Contoh Protokol Validasi Metode Analisis Mikrobiologi untuk metode alternatif.
Untuk mendapat file nya silahkan kirimkan email beserta data (nama, perusahaan, alamat email, no telp) ke Guide Consulting | info@traininglaboratorium.com
2. 2
Scope
This NordVal protocol describes the technical procedures for validation of alternative methods
for microbiological analyses of food, water, animal faeces, feed, samples from equipment and
processing areas and environmental samples.
Definitions
General terms:
Alternative method
An alternative method is a method of analysis that demonstrates or estimates, for a given
category of products, the same analyte as is measured using the corresponding reference
method.
Analyte
The analyte is the component demonstrated or measured by the method of analysis. It may be
the microorganism, its components or products.
Collaborative study
Study of the performance of the alternative method using common samples in several
laboratories and controlled by the expert laboratory.
Expert laboratory
Laboratory having qualified staff and skills to perform the method comparison study and
organise the collaborative study. The availability of an experienced statistician is essential for
the analysis of the results.
Method comparison study
Study performed by the expert laboratory of the alternative method against the reference
method.
Negative deviation
The alternative method presents a negative deviation if it gives a negative result when the
reference method gives a positive result.
Positive deviation
The alternative method presents a positive deviation if it gives a positive result when the
reference method gives a negative result.
Qualitative method
A qualitative method is a method of analysis whose response is either the presence or absence
of the analyte in a certain amount of sample.
Quantitative method
A quantitative method is a method of analysis whose response is the amount of the analyte
measured either directly or indirectly in a certain amount of sample.
Relative accuracy
The relative accuracy is the degree of correspondence between the response obtained by the
alternative method and the reference method on artificially inoculated samples.
Relative detection level
Documentation must be provided that the detection level of the alternative method is equal to
that of the reference method.
3. 3
Selectivity
The selectivity is a measure of a) the inclusivity: detection of the target microorganism from a
wide range of strains, and b) the exclusivity: the lack of interference from a relevant range of
non-target microorganisms.
Relative sensitivity
The relative sensitivity is the ability of the alternative method to detect the analyte compared
to the reference method.
Relative specificity
The relative specificity is the ability of the alternative method not to detect the target
microorganism when it is not detected by the reference method.
Reference method
A reference method is a method which is internationally recognised and accepted (e.g. NMKL,
ISO, CEN and AOAC International methods, methods given in EU/national legislations and
certain national standards of equivalent standing).
Validation of an alternative method
The validation of an alternative method is the procedure to demonstrate if the alternative
method provides equivalent or better results compared to the reference methods.
Statistical terms:
Repeatability
The repeatability is the closeness of agreement between successive and independent results
obtained by the same method on identical test material under the same conditions (apparatus,
operator, laboratory and short intervals of time).
Repeatability limit (r)
The repeatability limit is the value less than or equal to which the absolute difference between
two tests results obtained under repeatability conditions is expected to be with a probability of
95%.
Note: If the difference between two results exceeds r, the results should be considered as
suspect.
Reproducibility
The reproducibility is the closeness of agreement between single test results on identical test
material using the same method and obtained by operators in different laboratories using
different equipment.
Reproducibility limit (R)
The reproducibility limit is the value less than or equal to which the absolute difference
between two test results obtained under reproducibility conditions is expected to be with a
probability of 95%.
Note: If the difference between two results from different laboratories exceeds R, the results
must be considered suspect.
4. 4
Phases of validation
The validation of qualitative and quantitative methods comprises two phases:
A: A method comparison study of the alternative method against a reference method
(performed by an expert laboratory).
B: A collaborative study of the alternative method
(organised by an expert laboratory).
Test characteristics
The test characteristics for alternative methods are shown in the following table:
Qualitative methods Quantitative methods
1. Selectivity (inclusivity/ exclusivity) 1. Selectivity (inclusivity/ exclusivity)
2. Relative accuracy 2. Lowest validated level with satisfactory
precision
3. Detection level 3. Repeatability
4. Relative sensitivity 4. Reproducibility
5. Relative specificity 5. Uncertainty of the method
6. The agreement between the methods, κ
5. 5
Part 1: Qualitative methods
A. Method comparison study
1) Selectivity
The relative selectivity is a measure of a) the inclusivity: detection of the target microorganism
from a wide range of strains, and b) the exclusivity: the lack of interference from a relevant
range of non-target microorganisms.
a) inclusivity
Select 50 pure cultures of target microorganisms relevant to the alternative method and the
food matrices.
From each test strain a growth medium is inoculated with a level of 10 to 100 times greater
than the detection level. The analyses are carried out according to the respective method
descriptions.
Results
Microorganism Alternative method +/- Reference method +/-
Strain 1
Strain 2
Strain 3
Etc.
TOTAL
b) exclusivity
Select 30 pure cultures of non-target microorganisms chosen from both the strains known to
cause interference with the target microorganism and from strains naturally present in the
food matrices.
From each test strain a growth medium is inoculated with a level similar to the greatest level
of contamination expected to occur in the food matrices.
Results
Microorganism Alternative method Reference method
Strain 1
Strain 2
Strain 3
Etc.
TOTAL
Note: Criteria for the selection of test strains for measurement of selectivity see Annex G in
ISO 16140 : 2003 - Protocol for the validation of alternative methods.
6. 6
2) Relative accuracy
The relative accuracy is the degree of correspondence between the response obtained by the
alternative method and the reference method on identical samples.
As far as possible naturally contaminated samples should be used. However, in the Nordic
countries such samples are seldom available in sufficient numbers for extensive validations.
Therefore, artificial contamination of samples is permitted. As a general rule three inoculation
levels are used: 0= negative control, 1-10 cells per 25 g sample and 10-100 cells per 25 g
sample usually 2 strains relevant for the matrix are selected.
In consideration of the physical status of the matrix presented for validation the use of strains
stressed by either heating, freezing or chilling at selected time/temperature combinations
might be required.
If validation is requested for all food matrices, at least 5 relevant food matrices are selected
from the NordVal matrix-lists. Samples from a food matrix should be representative by taking
samples from several of the sub-matrices indicated in NV-DOC: F. Matrices for feed of other
than plant origin, should include meat- and bonemeal and fishmeal. As regards Salmonella 2
relevant strains for these matrices should be used. Matrices for faeces should include faeces
from poultry, swine and cattle unless a specific matrix is chosen. For other categories of
matrices a relevant number of matrices are selected.
For each matrix at least 60 samples are analysed to give approximately 30 positive and 30
negative results by the reference method. Each sample is analysed once by the reference
method and once by the alternative method.
Identical samples should be used as far as possible. However, when different pre-enrichments
are used, duplication of samples is necessary.
Note: See guidance in Annex D in EN ISO 16140:2003 - Protocol for the validation of
alternative methods.
Tabulate the data from the accuracy measurement after screening.
Responses Reference method
positive (+/ )
Reference method
negative (-/ )
Alternative method
positive ( /+)
+/+ positive agreement
(PA)
-/+ positive deviation
(PD)
Alternative method
negative ( /-)
+/- negative deviation
(ND)
-/- negative agreement
(NA)
Relative accuracy, % =
NDPDNAPA
100)NAPA(
+++
⋅+
Tabulate the data from the accuracy measurement after confirmation.
Responses Reference method
positive (+/ )
Reference method
negative (-/ )
Alternative method
positive ( /+)
+/+ positive agreement
(PA)
-/+ true positives
(TP)
Alternative method
negative ( /-)
+/- false negatives
(FN)
-/- negative agreement
(NA) + false positives (FP)
7. 7
Relative accuracy, % =
FPFNTPNAPA
100)FPNAPA(
++++
⋅++
Positive deviation (PD)
The alternative method presents a positive deviation if it gives a positive result when the
reference method gives a negative result.
A positive deviation must be confirmed. A positive deviation (PD) becomes a false positive (FP)
result when the true result can be proven as being negative.
A positive deviation is considered as a true positive (TP) result when the true result can be
proven as being positive.
Negative deviation (ND)
The alternative method presents a negative deviation if it gives a negative result when the
reference method gives a positive result.
A negative deviation becomes as a false negative (FN) when the true result can be proven as
being positive.
It is generally assumed that the reference method gives the true result. However, experience
has shown that poor accuracy can be due to poor performance of either the alternative method
or the reference method.
3) Detection level
Documentation must be provided that the detection level of the alternative method can detect
levels as low as the reference method.
For the determination of limit of detection, it is recommended to use LOD50, the level at which
50% of the replicates are positive or negative, as an independent performance parameter for
qualitative methods. Calculation of LOD50 is based on the Spearman-Karber method.
LOD50 = em
where ∑
−
=
++
−++=
1
1 2
))1()((
))()1(()((
k
i
ixix
ipipipm )
k = number of levels
p(i) = the proportion of positives for the level i (i = 1, 2, 3) – the sensitivity for each level
x(i) = the log concentration i
Use the results of the comparison study to calculate the LOD.
8. 8
4) Relative sensitivity and specificity
How to calculate the relative sensitivity and specificity after a screening and a confirmation
respectively are given in the tables below.
After screening:
Matrices PA NA ND PD Sum
Relative
Accuracy
AC (%)
Relative
sensitivity
SE (%)
Relative
specificity
SP (%)
N
(PA+NA) x 100
N
PA x 100
PA+ND
NA x 100
PD+NA
Food
cat. 1
Food
cat. 2
Food
cat. 3
Food
cat. 4
Food
cat. 5
TOTAL
N = PA +NA + PD + ND
PA, positive agreement; ND, negative deviation; PD, positive deviation; NA, negative
agreement
After confirmation:
Matrices PA NA FN TP FP Sum
Relative
Accuracy
AC (%)
Relative
sensitivity
SE (%)
Relative
specificity
SP (%)
N
(PA+NA+FP)x 100
N
(PA+TP)x 100
PA+FN
NA x100
NA+FP
Food
cat. 1
Food
cat. 2
Food
cat. 3
Food
cat. 4
Food
cat. 5
TOTAL
N = PA +NA + FN + TP + FP
PA, positive agreement; ND, negative deviation; PD, positive deviation; NA, negative
agreement; FP, false positive; FN, false negative.
Interpretation: Generally, values above 95% are considered acceptable.
9. 9
B. Collaborative study
The aim of the collaborative study is to determine the variability of the results obtained by the
alternative method in different laboratories using identical samples.
The expert laboratory shall include the alternative method and the reference method in its
study.
Results from at least 8 laboratories with valid results must be available for the calculations.
(Therefore, it is advisable to select 10-12 labs). In case of very expensive instruments results
from 5 laboratories are considered acceptable.
One relevant food matrix is selected from the NordVal matrix list to prepare the test samples.
Artificial inoculation is used at 3 levels (O = negative control, 1-10 cells per 25 g and 10-100
cells per 25 g). Duplicates are prepared for each laboratory to be analysed by the alternative
method.
If the alternative method comprises more than one method procedure a relevant food matrix
for each procedure should be selected for the study.
The expert laboratory shall determine which data from the participating laboratories are
suitable for the calculation of the precision data.
Note: Guidelines for the expert laboratory conducting the collaborative study see: Annex H and
L in EN ISO 16140:2003 – Protocol for the validation of alternative methods.
Calculation.
Tabulate the data obtained with each method as follows:
Positive results by the expert laboratory
Laboratories Contamination level
L0 L1 L2
Reference method /2 /2 /2
Alternative method /2 /2 /2
L0 = negative control
L1 = 1-10 cells per 25 g
L2 = 10-100 cells per 25 g
Positive results by the alternative method from the collaborative study
Laboratories Contamination level
L0 L1 L2
Laboratory 1 /2 /2 /2
Laboratory 2 /2 /2 /2
Laboratory 3 /2 /2 /2
Etc. etc /2 /2 /2
Total FPa
TPb
TPc
a False positive by the alternative method
b True positive at level 1 by alternative method
c True positive at level 2 by the alternative method
For level L0 and each method, calculate the percentage specificity SP
10. 10
(1) SP = %100
N
FP
1 ⋅
⎟
⎟
⎠
⎞
⎜
⎜
⎝
⎛
⎟
⎟
⎠
⎞
⎜
⎜
⎝
⎛
−
−
Where:
N - is the total number of all L0 tests;
FP is the number of false positive.
For each positive contamination level L1 + L2 and for each method, calculate the percentage of
sensitivity SE
(2) SE = %100
N
TP
⋅
+
Where:
N+ is the total number of all L1 or L2 tests respectively;
TP is the number of true positive.
For each level of contamination and the totality of the results, compare the alternative method
and the reference method in order to calculate the relative accuracy in the study carried out by
the expert laboratory. Each pair of results from a sample measured by the alternative and the
reference method shall be reported in a cross table as follows:
Alternative method Reference method Total
+ -
+ PA TP n+
- FN NA+ FP n-
Total N+ N- N
Calculate the relative accuracy AC expressed in percentage
Where:
N is the number of tested samples (for the level L1 or all levels);
PA is the number of positive agreement;
NA + FP is the number of negative agreement.
Interpretation.
Compare AC, SE and SP with their relative counterparts obtained within the comparative
study.
AC =
N
(PA + NA + FP)
· 100%
11. 11
Checking the degree of agreement:
The degree of agreement might be quantified by kappa, κ. If all the observed values lie on the
diagonal of the cross table, there is perfect agreement between the two methods. On the other
hand, more values placed outside the table diagonal, indicate less agreement between the
methods. To get an estimate of the agreement between the methods, Cohen’s kappa may be
calculated as follows:
The observed proportion of agreement, the accuracy, AC:
p0 = AC =
N
FPNAPA ++
The expected frequency of agreement, the expected accuracy, or repeatability by chance is:
pe = 2
N
n-)·(n)-N·(N +++
To measure the agreement between the methods, Cohen’s κ (kappa) can be applied:
e
eo
p1
pp
−
−
=κ
In general, the following κ values are used in the interpretation of kappa:
• κ ≤ 0.20 → Poor agreement
• κ € {0.21 – 0.40} → Fair agreement
• κ € {0.41 – 0.60} → Moderate agreement
• κ € {0.61 – 0.80} → Good agreement
• κ >0.80 → Very good agreement
For method validation, considering the overall agreement (number of test results are relatively
high), “very good agreement” is often required, i.e. κ > 0.80.
12. 12
Part 2: Quantitative methods
A. Method comparison study
1) Selectivity
The selectivity is a measure of a) the inclusivity: detection of the target microorganism from a
wide range of strains, and b) the exclusivity: the lack of interference from a relevant range of
non-target microorganisms.
a) inclusivity
Select at least 30 pure cultures of target microorganisms relevant to the alternative method
and the food matrices. These strains shall be representative of the most relevant strains for
the matrix of interest.
From each test strain an appropriate growth medium is cultured overnight before the
alternative medium and the reference medium are inoculated. For both the alternative medium
and the reference medium the complete protocol is used
Results
Microorganism Alternative method +/- Reference method +/-
Strain 1
Strain 2
Strain 3
etc.
TOTAL
b) exclusivity
Select at least 20 pure cultures of non-target microorganisms chosen from both the strains
known to cause interference with the target microorganism and from strains naturally present
in the food matrices. These strains shall be representative of the most common strains in the
Nordic countries.
From each test strain an appropriate growth medium is cultured overnight before the
alternative medium and the reference medium are inoculated. For both the alternative
methods and the reference method the complete protocol is used.
Results
Microorganism Alternative method Reference method
Strain 1
Strain 2
Strain 3
etc.
TOTAL
Note: Criteria for the selection of test strains for measurement of selectivity see Annex G in
EN ISO 16140 : 2003 - Protocol for the validation of alternative methods.
13. 13
2) Reliability of the method
For examining the reliability of the method, a minimum of five different levels of analyte in
each food type is required. For horizontal methods, five food types are required. The levels
should cover the range of interest (low, intermediate and maximum levels). The number of
analysis pr level for the alternative and the reference method, respectively, are five.
For each level, food type and method calculate the mean (in log cfu/g) and the standard
deviation (in log cfu/g) as illustrated in the table below.
Food type I
Level A B C D E
Reference
method
Results xA1 xA2 xA3 xA4 xA5 xB1 xB2
xB3 xB4
xB5
xC1 xC2
xC3 xC4
xC5
xD1 xD2
xD3 xD4
xD5
xE1 xE2
xE3 xE4
xE5
Mean
5
xxxxx
x A5A4A3A2A1
fRe
++++
=
Standard
deviation,
s
4
)xx(
s
5
1i
i
fRe
∑=
−
=
Confidence
level: ± 2s
2 · sRef
Alternative
method
Results xA1 xA2 xA3 xA4 xA5 xB1 xB2
xB3 xB4
xB5
xC1 xC2
xC3 xC4
xC5
xD1 xD2
xD3 xD4
xD5
xE1 xE2
xE3 xE4
xE5
Mean
5
xxxxx
x A5A4A3A2A1
Alt
++++
=
Standard
deviation,
s
4
)xx(
s
5
1i
i
Alt
∑=
−
=
Calculate the mean and the standard deviation for each level, matrix and method.
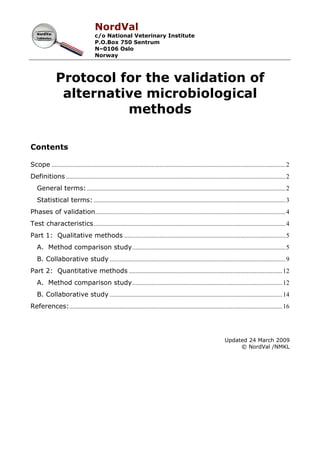
Draw a diagram for each matrix. Use Excel spread sheet. Plot the results obtained by the
reference and the alternative method; the levels makes the x-axis and the means are
illustrated on the y-axis. Include the confidence interval (±2s) of the reference method for
each level in the graph. If the mean results obtained by the alternative method fall within the
relevant confidence intervals, there are no significant difference between the methods. That is,
if the standard deviation of the reference method and the alternative method are satisfactory.
As a rule of thumb, a satisfactory standard deviation (according to NMKL Procedure No 8) is
0.4 log cfu/g or lower. The lowest validated level with satisfactory precision should also be
stated in the study report.
An example of such a graphical presentation is given below.
14. 14
Frozen Fish
0
1
2
3
4
5
6
0 1 2 3 4 5 6
levels
logcfui/g
ref method
alternative method
B. Collaborative study
A collaborative study establishes the following values:
1. Standard deviation of repeatability (sr)
2. Standard deviation of reproducibility (SR)
3. The uncertainty of the methods
The aim of the collaborative study is to determine the variability of the results obtained by the
alternative method in different laboratories using identical samples by calculating the
repeatability and the reproducibility.
One relevant food matrix is selected to prepare the test samples. Artificial inoculation is used
at 4 levels (from 0 to 104
per 1 g). For each laboratory duplicate samples are prepared and
analysed by the alternative method and by the reference method.
Results from at least 8 laboratories with valid results must be available for the calculations.
(Therefore, it is advisable to select 10-12 labs). In case of very expensive instruments results
from 5 laboratories are considered acceptable.
If the alternative method comprises more than one protocol a relevant food matrix for each
protocol should be selected for the study.
Note: Guidelines for the expert laboratory conducting the collaborative study see: Annex H in
EN ISO 16140:2003 - Protocol for the validation of alternative methods.
Calculation
Tabulate the data obtained with each method for statistical analyses for the calculation of
standard-deviation of repeatability (sr), repeatability limit (r), standard-deviation of
reproducibility(SR) and reproducibility limit (R).
15. 15
Standard deviation of repeatability, sr: is carried out as follows, for each food matrix (i)
and contamination level (j),
Food matrix (i)
Contamination
level (j)
Duplicates
(log10)
1 2 Mk SDk
Laboratory
(k) :
1
1ky 2ky ( )
2
21 kk yy +
2
21 kk yy −
2 ... ... ... ...
... ... ... ... ...
K ... ... ... ...
MEDIAN : MED {M
k
} MED {SDk}
yk1 (or yk2) is the result transformed in log, obtained by the laboratory k for the duplicate 1 (or
2) of the combination (food matrix i, contamination level j).
sr = k2 MED {SDk}
Where :
- k2 is a constant, k2 = 1.4836
- MED {SDk} is the median of the standard-deviations of duplicates for the K
laboratories.
The repeatability limit, r = 2 2 sr ≈ 2.8 sr
Standard deviation of reproducibility, sR:
Calculate the recursive median sd = 1.1926 x Sn
where Sn = MEDk {MEDj |Mk - Mj|}
For calculation of Sn, see Annex I.
Standard deviation of reproducibility is
2
2
2 r
dR
s
ss +=
The reproducibility limit, R = 2 2 sR ≈ 2,8 sR
Check if the obtained results of the alternative method fall within the confidence interval (±2s)
of the reference method. If so there is no significant deviation between the methods. Calculate
the combined uncertainty for the alternative and the reference method respectively, u,
∑
∑
−
−
=
)1(
)1( 2
i
ii
n
sRn
u
A combined uncertainty of less than 0.4 log cfu/g illustrates satisfactory precision of the
studies.
NordVal will evaluate information provided by the manufacturer based on results for the above
mentioned characteristics obtained by using international recognised protocols.
16. 16
References:
AFNOR – 2002: Requirements relating to preliminary and collaborative studies conducted by
an expert laboratory.
AOAC – 1999: Methods Committee Guidelines for Validation of Qualitative and Quantitative
Microbiological Methods.
ISO N 543 – 2003: Statistics of Analytical Data – Protocol for the Establishment of Precision
Characteristics of Microbiological Quantitative methods by Interlaboratory Studies.
ISO 16140 – 2003: Protocol for the Validation of Alternative Microbiological Methods.
NMKL Procedure No 23, 2008: Guide on quality assurance for microbiological laboratories.
NMKL Procedure No 8, Version 4, 2008: Measurement of uncertainty in quantitative
microbiological examination of foods.
NMKL Procedure No 20, 2007: Evaluation of results from qualitative methods.
17. Annex 1 – Robust estimator of dispersion based on the recursive median Sn from Rousseeuw
from Microbiology of food and animal feeding stuffs –Protocol for the establishment of precision characteristics of quantitative methods
by inter-laboratory studies, elaborated by the leadership of Bertrand Lombard.
A B C D E F G H I J K L M N O P Q R S T
1
2
3 A b e f g h I j k l m n o p q r
4 Transpose
5 DATA → 5,24 5,80 5,15 5,73 6,66 4,00 3,30 6,08 3,78 5,81 5,35 7,92 5,93 5,05 4,87 4,03
6 ↓ =|D$5-$B7| =|E$5-$B7| =|E$5-$B7| etc.
7 a 5,24 |D$5-$B7|= 0,56 0,09 0,49 1,42 1,24 1,94 0,84 1,46 0,57 0,11 2,68 0,69 0,20 0,38 1,21
8 b 5,80 |D$5-$B8|= 0,56 0,65 0,07 0,86 1,80 2,50 0,28 2,02 0,00 0,45 2,12 0,13 0,76 0,94 1,77
9 e 5,15 |D$5-$B9|= 0,09 0,65 0,58 1,51 1,15 1,85 0,93 1,37 0,65 0,20 2,77 0,78 0,11 0,29 1,12
10 f 5,73 etc. 0,49 0,07 0,58 0,93 1,73 2,43 0,35 1,95 0,07 0,38 2,19 0,20 0,69 0,87 1,70
11 g 6,66 1,42 0,86 1,51 0,93 2,66 3,36 0,58 2,88 0,85 1,31 1,27 0,73 1,61 1,79 2,63
12 h 4,00 1,24 1,80 1,15 1,73 2,66 0,70 2,08 0,22 1,81 1,35 3,92 1,93 1,05 0,87 0,03
13 i 3,30 1,94 2,50 1,85 2,43 3,36 0,70 2,78 0,48 2,51 2,05 4,62 2,63 1,75 1,57 0,73
14 j 6,08 0,84 0,28 0,93 0,35 0,58 2,08 2,78 2,30 0,27 0,73 1,85 0,15 1,03 1,21 2,05
15 k 3,78 1,46 2,02 1,37 1,95 2,88 0,22 0,48 2,30 2,03 1,57 4,14 2,15 1,27 1,09 0,25
16 l 5,81 0,57 0,00 0,65 0,07 0,85 1,81 2,51 0,27 2,03 0,46 2,12 0,13 0,76 0,94 1,78
17 m 5,35 0,11 0,45 0,20 0,38 1,31 1,35 2,05 0,73 1,57 0,46 2,57 0,58 0,31 0,48 1,32
18 n 7,92 2,68 2,12 2,77 2,19 1,27 3,92 4,62 1,85 4,14 2,12 2,57 1,99 2,88 3,06 3,89
19 o 5,93 0,69 0,13 0,78 0,20 0,73 1,93 2,63 0,15 2,15 0,13 0,58 1,99 0,89 1,07 1,90
20 p 5,05 0,20 0,76 0,11 0,69 1,61 1,05 1,75 1,03 1,27 0,76 0,31 2,88 0,89 0,18 1,02
21 q 4,87 0,38 0,94 0,29 0,87 1,79 0,87 1,57 1,21 1,09 0,94 0,48 3,06 1,07 0,18 0,84
22 r 4,03 1,21 1,77 1,12 1,70 2,63 0,03 0,73 2,05 0,25 1,78 1,32 3,89 1,90 1,02 0,84
23 n
=
16 MED = 0,69 0,76 0,78 0,69 1,42 1,35 2,05 0,93 1,57 0,76 0,58 2,68 0,78 0,89 0,94 1,32
24 ↓ = MEDIAN (D7 : D22) ... ... =MEDIAN (K7 : K22) etc. etc.
25 MED = 0,91 = MEDIAN (D23 : S23) = Sn
26 SD(Sn) = 1,08 = 1,1926*D25
27
28 Operations (Excel 7.0) :
29 1) Tranpose the original data column B7:B22 in D5:55
30 2) In the central square table, write the formula for the absolute deviation of the 1st
cell : =ABS(D$5-$B7)
31 3) Copy it in all the table
32 4) Delete the main diagonal
33 5) Under the 1st
column, write the median formula : =MEDIAN (D7 : D22), and copy it under all columns
34 6) Write the final recursive median Sn : =MEDIAN (D23 : S23), and its corresponding SD in multiplyingt Sn by 1,1926