Download to read offline

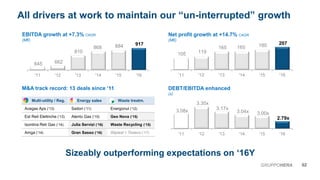
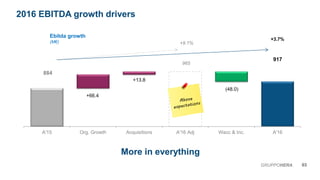
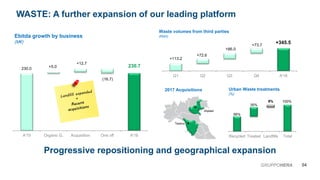
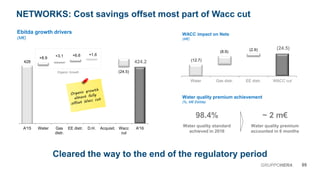
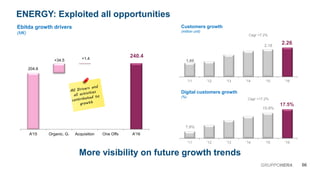
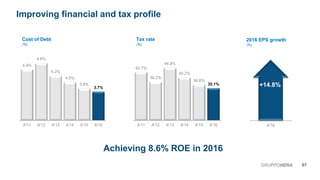
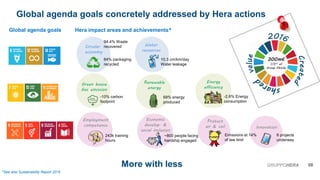
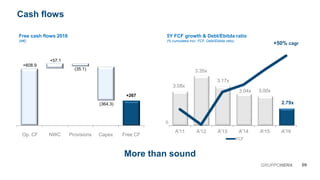
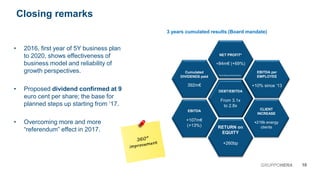

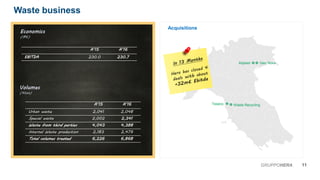

The document outlines the equity story of Gruppo Hera, an Italian multi-utility company. It discusses Hera's track record of industrial development through acquisitions, sustainability efforts, financial soundness, and growth drivers. Key highlights include a 13% increase in EBITDA from 2015 to 2016 through organic growth and acquisitions, improved debt to EBITDA and return on equity ratios, and continued growth in customers and volumes across its business segments in waste, water, gas, and electricity.


