Optimal gene circuit design
•Download as PPTX, PDF•
0 likes•512 views

Optimality theory Optimal expression level of a protein under constant conditions Cost of the LacZ Protein Mathematical description of cost function The Benefit of the LacZ Protein Fitness Function and the Optimal Expression Level Cells Reach Optimal LacZ Levels in a Few Hundred Generations in Laboratory Evolution Experiments Environmental selection of the feedforward loop network motif References

Recommended
More Related Content
What's hot
What's hot (20)
Similar to Optimal gene circuit design
Similar to Optimal gene circuit design (20)
More from Gaurav Aggarwal
More from Gaurav Aggarwal (12)
Recently uploaded
Recently uploaded (20)
Optimal gene circuit design
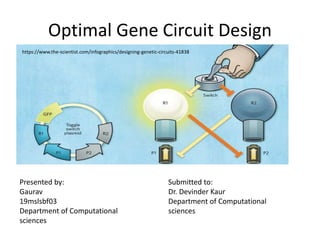
- 1. Optimal Gene Circuit Design Presented by: Gaurav 19mslsbf03 Department of Computational sciences Submitted to: Dr. Devinder Kaur Department of Computational sciences https://www.the-scientist.com/infographics/designing-genetic-circuits-41838
- 2. Content • Optimality theory • Optimal expression level of a protein under constant conditions • Cost of the LacZ Protein • Mathematical description of cost function • The Benefit of the LacZ Protein • Fitness Function and the Optimal Expression Level • Cells Reach Optimal LacZ Levels in a Few Hundred Generations in Laboratory Evolution Experiments • Environmental selection of the feedforward loop network motif • References
- 3. Optimality theory • Optimality theory aims to predict and understand which circuit and parameters will arise in each situation. • Optimality theory is based on the ability of natural selection to maximize fitness, and hence to converge on particular circuit designs and parameter values in a given environment.
- 4. Optimal expression level of a protein under constant conditions What sets the expression level of a protein? Why are some proteins produced at a few copies per cell, others at thousands and yet others at tens or hundreds of thousands? To address this question, we begin with a situation in which fitness can be precisely defined: Bacteria that grow in a constant environment that is continually replenished. In this case, the fitness F is the growth rate of the cells. The number of cells, N, grows exponentially with time at rate F until they get too dense:
- 5. Contd… • Optimality theory predicts that the protein expression level that is selected maximizes the fitness function. The fitness function in this case is growth rate F as a function of the number of copies of the protein expressed.
- 6. Contd… • In principle, F(Z) can have local maxima and minima. A journey on this fitness function can get stuck on the local maxima or blocked by impassable valleys. Random mutations can cause noise along this journey, as can sampling noise when population sizes are small, an effect called genetic drift.
- 7. Cost of the LacZ Protein • Experimental measurement of the cost function. • To measure the cost of the lac system, IPTG was used to induce the lac system to various levels in the absence of lactose. • The cells grew on another carbon source, glycerol. • Expression of LacZ reduced the growth rate of the cells. • The cost c(Z) is defined as the relative reduction in the growth rate when Z units of the protein are made. The cost rises linearly with Z at first, so that each unit of protein reduces growth by a fixed amount. At higher protein levels, the cost starts to accelerate. The reason is that production and maintenance of the lac proteins not only requires the use of the cells’ resources, but also reduces the resources available to other useful proteins.
- 8. Mathematical description of cost function • Assume that the growth rate of the cell depends on an internal resource R. The growth rate is typically a saturating function of resources such as R, following a Michaelis– Menten function. • Each unit of protein Z reduces the resource by a small amount, R → R − εZ. The cost begins to diverge as Z approaches a cutoff level M, in which so much Z is produced that R is depleted . • When only a few copies of the protein are made, the cost goes as c(Z) ∼ c0Z. The cost of a single protein is about 10−6, which makes sense because there are about 106 proteins in the bacterial cell. • They show that the relative reduction in growth rate due to the fully induced lac system is about 4.5%.
- 9. The Benefit of the LacZ Protein • Benefit: defined as the relative increase in growth rate due to the action of the protein. • In the case of LacZ, the benefit is proportional to the rate at which LacZ breaks down its substrate, lactose. • LacZ breaks down lactose at a rate that is proportional to the number of copies of the protein, Z, times a saturating function of the concentration of lactose, L. • K = Michaelis CONSTANT2 and b0 =maximal growth rate advantage per LacZ protein at saturating lactose. The relative increase in growth rate due to the fully induced level of LacZ with saturating amounts of lactose is about 17% under the conditions of the experiment
- 10. Fitness Function and the Optimal Expression Level • Fitness function, equal to the difference between benefit and cost. • The fitness function is the growth rate of cells that produce Z copies of LacZ in an environment with a lactose concentration of L. • The position of this maximum, namely the optimal protein level Zopt, depends on lactose level, L. • The optimal protein level Zopt can be found by the point at which the derivative of the fitness function with respect to Z equals zero
- 11. Contd… • Zopt rises with L because lactose increases the benefit per LacZ protein, and hence increases the selection pressure to produce more proteins. • The fully induced wild-type expression level, ZWT = 60,000/cell is predicted to be optimal when L ∼ 0.6 mM under these experimental conditions. • When there is no lactose in the environment, the optimal level is Zopt = 0, because the lac proteins confer only costs and no benefits. • In fact, zero expression is optimal as long as lactose L is lower than a threshold Lc, because costs exceed benefits. The threshold level of lactose needed for selection of the gene system is Lc ∼ 0.06 mM. If lactose environments with L < Lc persist for many generations, the organism will tend to lose the gene encoding LacZ.
- 12. Cells Reach Optimal LacZ Levels in a Few Hundred Generations in Laboratory Evolution Experiments • To test the predictions of this cost–benefit analysis, Erez Dekel performed a laboratory evolution experiment. The evolution experiment used the technique of serial dilution. • The concentration of the LacZ protein was monitored over time. • The LacZ protein level reached the predicted optimal level in each tube to a good approximation. • Cells growing with no lactose lost their lac expression altogether. • Analysis of the evolutionary dynamics indicated that the cells reached their optimal, adapted levels in each case by means of a mutation that changed the LacZ protein level.
- 13. Environmental selection of the feedforward loop network motif • Cost–benefit analysis for the FFL in a given dynamically fluctuating environment. • Term environment means the time-dependent profiles of the input signals. • In E. coli, about 40% of the genes regulated by two inputs are regulated by a FFL, whereas the remaining 60% are regulated by a simple two- input design which is not a FFL
- 14. Contd… • Suppose that the system is presented with a pulse of input SX of duration D. • The impact of this pulse on the cell’s growth is given by the integrated fitness over the pulse duration, φ()()DFtdtD=0. • This integrated fitness shows that brief pulses of input signals have a detrimental effect on growth. • They lead to a reduction in growth rate. • The reason for this reduction is that when the input pulses are shorter than a critical pulse duration, Dc, protein Z does not have time to build up to levels in which the accumulated benefit exceeds the costs.
- 15. Contd… • Fitness is reduced by brief input pulses, a circuit that can avoid responding to brief pulses, but still respond to persistent pulses, can be advantageous. • The coherent FFL can perform precisely this type of filtering task. • In the coherent type-1 FFL with an AND input function, Z is expressed only at a delay after the signals appear. • Therefore, only pulses of input signals longer than the delay time of the FFL will lead to Z expression. • The delay in the FFL, TON, results from the time it takes for transcription factor Y to accumulate and cross its activation threshold for gene Z.
- 16. Contd.. • The delay in the FFL filters out pulses that are shorter than TON. • This avoids the reduction in growth caused by short pulses. • The delay also has a disadvantage, because during long pulses, Z is produced only at a delay and misses some of the potential benefit of the pulse. • In some situations the FFL does more harm than good
- 17. Contd… • This diagram shows that the FFL is more fit than simple regulation when deleterious brief pulses are common and the benefit-to-cost ratio is not too high. • Simple regulation is superior when brief pulses are rare. • When costs exceed benefits, neither circuit is selected
- 18. References • Uri Alon - An Introduction to Systems Biology_ Design Principles of Biological Circuits-CRC Press (2020) • https://www.youtube.com/watch?v=PfPWpWj vRPU&list=PLLbr- B8cNbo6v4kc68JowzUeAYdh6gdQH&index=18
- 19. Thanks!