SlideShare a Scribd company logo
1 of 18
Download to read offline
Exploration and Mining Geology, Vol. 15, Nos. 1-2, pp. 27-41, 2006
© 2006 Canadian Institute of Mining, Metallurgy and Petroleum.
All rights reserved. Printed in Canada.
0964-1823/00 $17.00 + .00
27
3-D Integrated Geological Modeling in the Abitibi Subprovince (Québec, Canada): Techniques
and Applications
F. FALLARA1
, M. LEGAULT2
, AND O. RABEAU1
(Received September 28, 2004; accepted October 8, 2005)
Abstract — The development of robust 3-D geological models involves the integration of large
amounts of public geological data, as well as additional accessible proprietary lithological,
structural, geochemical, geophysical, and diamond drill hole data. 3-D models and maps have been
available, particularly in the petroleum industry, for more than 10 years. Here, we demonstrate how
robust 3-D maps can be used as interactive tools for mineral deposits exploration. In particular, we
show how the interrogation of 3-D data sets can constrain exploration targets at depth.
The main advantages of this technique for the mining industry are the homogeneity of data
treatment and the validation of geological interpretations, taking into account geophysical and
geochemical data. Data integration and cross-correlation of geology and geophysics can be
achieved in two dimensions in any good GIS package. However, the added strength of 3-D analysis
is the integration of separate data sets in three dimensions to build more complete, more realistic
models, and in delineating areas of high economic potential at depth. Furthermore, these models
can be modified and improved at any time by adding new data from ongoing drilling and
geoscientific surveys.
This paper presents two examples of 3-D models used for mineral exploration: the Joutel VMS
mining camp and the Duparquet gold camp, Quebec. In both examples, the creation of the model is
discussed and queries specific to the relevant exploration model are introduced. Eight potential
exploration targets are generated at Joutel and seven at Duparquet. Although the targets defined are
dependent on the details of the chosen queries, it is apparent that this technique has the potential to
generate promising exploration activity that can engender new targets. © 2006 Canadian Institute
of Mining, Metallurgy and Petroleum. All rights reserved.
Key Words: Three-dimensional geological model, Abitibi, Volcanogenic massive sulfide deposit,
gold, gOcad®
, 3-D querying, Exploration targets.
Sommaire — Le développement de modèles 3-D géo-intégrés fiables implique l’intégration de
grandes quantités de données géologiques publiques ainsi que des données lithologiques,
structurales, géochimiques, géophysiques et de forages en provenance du secteur privé. L’industrie
pétrolière dispose de modèles et de cartes 3-D depuis plus de 10 ans. Ce manuscrit présente un
exemple d’utilisation de modèles et de cartes tridimensionnels détaillés comme outils interactifs
dans l’exploration de dépôts métallifères. L’emphase est mise sur le processus d’interrogation des
données en 3-D pour la définition de cibles d’exploration en profondeur.
Les avantages principaux de cette technique sont l’uniformité du traitement des données et de la
validation des interprétations géologiques, tout en tenant compte des données géophysiques et
géochimiques. L’intégration de données et la corrélation de la géologie et de la géophysique
peuvent être accomplies en deux dimensions dans n’importe quel logiciel SIG. La plus grande force
de l’analyse 3-D demeure cependant la possibilité de construire des modèles complets et réalistes
permettant de cibler des secteurs à haut potentiel économique en profondeur. De plus, ces modèles
peuvent être modifiés et améliorés de manière interactive en ajoutant de nouvelles données
provenant de forages et de levés géoscientifiques en cours.
Ce manuscrit présente deux exemples de modèle 3-D géo-intégrés développés pour
l’exploration minérale : le camp de SMV de Joutel et le camp aurifère de Duparquet, Québec. Dans
les deux cas, la construction du modèle est décrite et les requêtes spécifiques à chaque type de
gisement sont présentées. L’exercice a permis de définir huit cibles d’exploration potentielles à
Joutel et sept à Duparquet. Bien que les cibles identifiées dépendent des contraintes utilisées pour
les requêtes choisies, cette technique permet de générer de nouvelles cibles qui pourraient relancer
l’activité d’exploration dans les camps miniers “ matures ” ou dans des secteurs moins explorés.
©2006 Canadian Institute of Mining, Metallurgy and Petroleum. All rights reserved.
1 URSTM-UQAT, Unité de recherche et de service en technologie minérale, Université du Québec en Abitibi-Témiscamingue; 400 boul.
Lamaque, bureau 1.02, Val-d’Or, Québec, J9P 3L4.
2
MRNF, Ministère des Ressources naturelles et de la faune, 82 boul. Québec, Rouyn-Noranda, Québec, J9X 6R1.
28 Exploration and Mining Geology, Vol. 15, Nos. 1-2, pp. 27-41, 2006
Introduction
Recent discoveries and ongoing exploration for mineral
deposits in mature mining camps within the Abitibi
subprovince (e.g., Perseverance in the Matagami camp, and
La Ronde 3 in the Doyon-Bouquet-La Ronde camp, Quebec;
Fig. 1) have emphasized the need for integrated three-
dimensional (3-D) modeling at a mining camp scale. Like
many major and mid-tier mining companies (e.g., Noranda,
Barrick Gold, Placer Dome, Falconbridge, Inco, Aur
Resources, Cambior), the Quebec Geological Survey
(MRNF) has favoured the gOcad®
software as being best
adapted for this type of project. In mature mining camps, the
integration and the optimization of geoscientific data within a
single 3-D map is likely to generate new mineral exploration
targets. The development of these models involves compiling
large amounts of public geoscientific data, available in
Quebec through the MRNF’s database (SIGEOM), as well as
additional lithological, structural, geochemical, geophysical,
and drill hole data made available through private companies
that are involved as project partners (Fallara et al., 2001,
2002a; Marquis et al., 2003).
Since 2000, the Unité de recherche et de service en
technologie minérale, Université du Québec en Abitibi-
Témiscamingue (URSTM-UQAT), in close collaboration
with the MRNF, has used 3-D integrated geological models
of two mining camps to define base metal (Joutel) and gold
(Duparquet) exploration targets. This was accomplished
through the identification of extensions of alteration zones,
structures, and the interpretation of subsurface geology.
These projects follow the current trend in mineral
exploration, which focuses on finding increasingly deep
deposits within mature mining camps.
Three-dimensional modeling requires a structured
quantitative approach, and it is therefore necessary to have
adequate, high-quality, multidisciplinary data with a
relatively uniform distribution over the entire study area.
Unfortunately, this kind of detail is rare in the majority of
regions. In order to demonstrate the method, we have selected
two areas within the Joutel volcanogenic massive sulfide
(VMS) and the Duparquet gold camps where sufficient data
exist to build detailed models within a regional 3-D model.
3-D Integrated Geological Models
A 3-D geological modeling environment provides a
single platform that uses a common 3-D coordinate system
for the integration of geoscientific data. Three-dimensional
modeling involves the addition of data sets to enable querying
and visualization of various types of spatial data. Therefore,
3-D geological models contain quantitative geological,
geophysical, and geochemical data and interpretations.
Consequently, the resulting model allows the examination
and querying of all the data using a single tool kit.
The borders of a 3-D integrated geological model are
bound by a “voxet”, which is a volume divided by a group of
three-dimensional cells containing various numerical data,
including: lithologies, alteration indices, diamond drill hole
densities, geochemical and geophysical surveys, and certain
point-source petrophysical data (rock density, magnetic
susceptibility, etc.). Figure 2 shows sections through a voxet
exposing different types of numerical data.
Hence, 3-D integrated geological models represent a
dynamic data integration method of great utility as an
exploration targeting tool that can be questioned according to
criteria reflecting the geological properties associated with
various mineral deposits. The main advantages of such a
technique for the mining industry is the homogeneity of data
treatment and the ability to refine and validate geological
interpretations taking into account geophysical and
geochemical data. Data integration and cross-correlation of
geology, geophysics, and geochemistry can be achieved in
two dimensions in any good GIS package. However, the
added strength of 3-D analysis is the integration of data sets
in three dimensions to build more complete, realistic models
that can be used to delineate areas of high economic potential
at depth. Furthermore, these models can be modified and
improved at any time by adding new data from ongoing
drilling and mapping surveys.
Methodology for 3-D Integrated Geological Model
Construction
The type of data integrated within a 3-D model depends
on data availability, density, and distribution, as well as
project objectives and working scale. The methodology
presented here is well suited for various working scales (from
ore-body scale through camp scale, and even up to regional
scale). It is particularly suited and most useful for camp-scale
or regional synthesis to constrain structural and stratigraphic
relationships of a studied area.
For exploration targeting, the following data are useful:
1. Surface data (2-D):
i. Topographic elements (digital elevation models,
hydrography);
ii. Mining and road infrastructure;
iii. Main lithological and stratigraphical contacts (key
horizons marker);
iv. Fault and fold surfaces, planar and linear structural
measurements;
v. Lithogeochemical analyses, alteration indices, and
economic assays.
2. Diamond drill hole (DDH) information available in 3-D:
i. Drilling data (collar, deviation, geology,
mineralized intersections, alteration indexes,
magnetic susceptibility, density, etc.).
3. Ground-based, downhole, and airborne geophysical
surveys:
i. Magnetic data;
ii. Gravimetric data;
iii. Electric methods (DC, IP);
iv. Borehole EM;
3-D Modeling in the Abitibi Subprovince (Quebec, Canada) • F. FALLARA ET AL. 29
Fig.1.SimplifiedgeologyoftheAbitibisubprovince,showingthelocationsoftheJoutelandDuparquetstudyareas.ModifiedfromDoucetetal.(2000).
30 Exploration and Mining Geology, Vol. 15, Nos. 1-2, pp. 27-41, 2006
Fig. 2. (a) General steps involved in constructing 3-D integrated geological models (after Fallara et al., 2002b). (b)
Generalized model: a unified platform that contains quantitative geological, geophysical, and geochemical data.
3-D Modeling in the Abitibi Subprovince (Quebec, Canada) • F. FALLARA ET AL. 31
v. Seismic data.
The UML (Unified Modeling Language) flowchart
illustrates the steps to accomplish a task; the Fowler (2000)
flowchart highlights stages requiring a decision, as opposed
to those needing parallel treatments in substages. Figure 2a
outlines the construction steps of 3-D integrated geological
models as defined by Fallara et al. (2002b):
1. Data handling steps:
a. Acquisition and compilation of the data (allowing
for rigorous quality control):
i. Compilation of geological information, such as
outcrop, contacts, structures, mine plans, DDH;
ii. Compilation of geophysical information, such
as airborne and ground magnetic, and
gravimetric surveys;
iii. Digitization of paper documents (i.e., sections)
and their integration and validation with
numerical data;
iv. Standardization of the lithological units;
v. Structuring of data files for importation into
gOcad®
.
b. Importation and integration steps:
i. Importation of digital elevation points to create
the topographic surface;
ii. Integration of regional infrastructure and
hydrographical network: the numerical data are
imported into gOcad® and are then draped on
the topographic surface;
iii. Integration of the 2-D geological data:
importation into gOcad®
of outcrop,
mineralized zones (data points), and geological
contacts in AutoCAD® (.dxf) format;
iv. Diamond drill hole (DDH) importation.
2. Construction steps:
a. Interpretation, construction, and integration of
regional sections used for the homogenization and
the simplification of the regional geological
contacts. The number of necessary sections depends
on the complexity of the units to be constructed.
b. Geological surfaces are built from both the contact
curves and dip vectors extracted from the surface
geological map and sections.
3. Interpretation and validation steps:
a. Validation of the 3-D geological surfaces: major
DDH markers are used as additional control
elements between the regional interpreted sections.
Surfaces are modified in order to account for these
additional constraints.
b. Creation of 3-D geological regions: these are
geological volumes bounded by the 3-D geological
surfaces.
c. Validation of the 3-D geological model using
unconstrained and constrained 3-D geophysical
inversions according to quantitative relationships
between geological data and geophysical data: the
differences between the two models are adjusted in
iterative and interactive processes.
4. Querying steps:
a. Selection of 3-D properties: lithology, alteration
indexes, assays, etc., are then allotted to each cell of
the voxet according to the region to which they
belong.
b. Elaboration of 3-D properties according to the
selected metallogenic environment (VMS, gold,
etc.) in order to define queries that may lead to new
exploration targets.
Three-dimensional integrated geological modeling
cannot be defined and followed like a cookbook recipe: each
project or study area requires a different approach based on
the objectives and the available databases. Therefore, while
these steps ensured the success of the 3-D integrated
geological models at our specific study sites, they should not
be thought of as a standard, but rather as guides that other
users can follow or modify.
Joutel Study Area
Geological Setting
The Joutel volcanic complex (JVC) contains VMS
deposits that produced Zn, Cu, Ag, and Au from massive
sulfide deposits from 1966 to 1975, and semi-massive sulfide
deposits from 1974 to 1993. The JVC (2728–2721 Ma;
Mortensen, 1993; Legault et al., 2002) is an integral part of
the first volcanic cycle (2730–2720 Ma) of the Northern
Volcanic Zone (NVZ) of the Abitibi subprovince (Fig. 1),
which represents an extensive, subaqueous, primitive basalt
plain with dispersed mafic/felsic and felsic complexes
collectively defining a diffuse and incipient arc (Chown et al.,
1992).
The 5- to 7-km-thick JVC, traceable for 25 km along
strike (Legault et al., 2002), comprises the Joutel-Raymond
and Harricana groups (Legault et al., 2000; Fig. 3). The
Joutel-Raymond Group consists of a basal mafic volcanic
sequence (Valrennes Formation) overlain by mafic to felsic
volcanic and volcaniclastic rocks (Joutel Formation), whereas
the Harricana Group is a minor but significant volcaniclastic
sedimentary unit (Legault et al., 2002). The Joutel Formation
is further subdivided into the Poirier (primarily lobe-
hyaloclastite felsic flows), Kistabiche, and Eagle
(predominantly mafic to felsic tuffs) members. VMS deposits
are only found within the Poirier member, whereas gold
deposits are located within the Harricana Group.
Three major intrusions are present in the JVC area
(Legault et al., 2002): the Valrennes intrusion, Mistaouac
pluton, and Joutel tonalite. The Valrennes intrusion is a syn-
volcanic (2728 Ma; Legault et al., 2002), 4-km-thick,
shallow-level, mafic-ultramafic sill that has been mapped
over a 20-km strike length (Dubé, 1993; Legault et al., 2000).
It is mostly composed of diorite, quartz diorite, gabbro,
quartz gabbro, and hornblendite, with local magmatic
layering at its base. It is interpreted to have been the heat
32 Exploration and Mining Geology, Vol. 15, Nos. 1-2, pp. 27-41, 2006
source for hydrothermal convection cells responsible for the
VMS deposits (Legault et al., 2002). The roughly circular
Mistaouac pluton (2726 ± 2 Ma; Davis et al., 1993) covers
about 2,500 km2
, is mostly of tonalitic composition, and is
interpreted as a deep-level intrusion (~10 km depth; Chown et
al., 2002). The Joutel tonalite represents a younger
assemblage of dikes and sills (2721 Ma; Legault et al., 2002)
that crosscut the Valrennes intrusion and the Poirier member
(Legault et al., 2002).
Joutel Mining Camp
The Joutel mining camp (Fig. 3) contains Zn-Cu-Ag
deposits (Poirier, Joutel copper, and Explo-Zinc) and Au-Ag
deposits (Eagle and Telbel). Three-dimensional geological
modeling was focused on the VMS deposits. Lacroix (1998)
estimated combined production and reserve inventories of
more than 215,000 tonnes of Zn and 148,000 tonnes of Cu
within the camp.
The Joutel copper deposit lies in the lower portion of the
Poirier member in the hinge area of the McClure-Plamondon
anticline (Fig. 3; Dubé, 1993). Chloritic stringer zones
underlie massive sulfide beds on both fold limbs (Legault et
al., 2002). The orebody is composed of several folded and
moderately dipping sulfide lenses, hosted by intensely
chloritized and locally talcose rhyolite breccias with
spherulitic and cherty rhyolite (Legault et al., 2002). The
Joutel tonalite crosscuts the Joutel copper deposit at depth at a
30° to 40° angle (Jébrak, 2000).
The sulfide lenses at the Poirier deposit are also found in
the lower portion of the Poirier member (Legault et al., 2002)
and are hosted by strongly chloritized volcaniclastic rocks
with a sericitic halo (Piché, 2000). The orebody has been
interpreted as a V-shaped fold with distinct copper-rich zones
along the northern limb near the contact with the Joutel
tonalite, and zinc-rich zones to the south (Boniwell and
Dujardin, 1964). This metal zonation substantiates geological
observations that suggest stratigraphy tops to the south
(Legault et al., 2002).
Detailed mineralogical studies indicate that the Te-Co-
Ag-Pb-rich composition and chlorite alteration (pipe zonation
and coexistence of Mg-rich and Fe-rich chlorites; Legault et
al., 2002) of the Zn-Cu-Ag VMS deposits of the JVC are
similar to those of the Matagami mining camp (Noranda-
type), which is believed to have formed in a deep-water
environment (Franklin, 1996). However, Legault et al. (2002)
observed that characteristics such as the presence of intense
iron carbonate alteration and stromatolite fragments suggest
Fig. 3. Simplified geological map of the Joutel mining camp. MPA = McClure-Plamondon Anticline. Modified from Legault et al. (2002).
3-D Modeling in the Abitibi Subprovince (Quebec, Canada) • F. FALLARA ET AL. 33
similarities with shallow-water Mattabi-type deposits
(Morton and Franklin, 1987). The carbonate alteration is
restricted to upper portions of the Poirier member, as well as
Kistabiche and Eagle members, and the stromatolite
fragments are found within Kistabiche tuffs only (Legault et
al., 2002).
The studies of Legault et al. (2002) can be consulted for
complete information regarding the deformation and
metamorphic history of the region or the camp, and how this
may have modified the position and signature of the syn-
volcanic VMS mineralization.
Duparquet Study Area
Geological Setting
The Duparquet area, situated along the Destor-Porcupine
fault (DPF), was a gold producer from 1933 to 1956 (Beattie,
Donchester, Central Duparquet, and Duquesne mines) and
from 1983 to 1990 (Duquesne and Yvan Vezina-Davangus
mines). The geology of the DPF area consists of an Archean
volcano-sedimentary assemblage divided into three volcanic
and two sedimentary groups (Fig. 4; Goutier and Lacroix,
1992). The base of the sequence consists of felsic to
ultramafic volcanic rocks of the Kinojévis group (2722–2718
Ma; Barrie, 1999; Zhang et al., 1993), Hébécourt Formation
(2706–2701 Ma; Corfu and Noble, 1992), and Blake River
group (2698 Ma; Mortensen, 1993). Rocks of the Kewagama
group (2686–2684 Ma; Davis, 2002) are younger than the
volcanic rocks, and are interpreted as turbiditic sediments
deposited in deep basins. The Timiskaming group (<2682
Ma; Mueller et al., 1996) is the youngest stratigraphic unit in
the area, and consists of coarse, polygenic, unsorted
sedimentary rocks deposited in an alluvial-fluvial
environment. At several locations, the Timiskaming is in
angular unconformity with deformed volcanic rocks.
Numerous felsic to ultramafic intrusions crosscut the region.
The eastern part of the study area distinguishes itself
from the western sector by an increase in geological
complexity and a shallower structural level of exposure (Fig.
4b; Goutier and Lacroix, 1992). This factor has favoured the
preservation of felsic porphyritic intrusions of calc-alkaline
(2689 ± 3 Ma; Mueller et al., 1996) to alkaline affinities
(2682 ± 1 Ma; Mueller et al., 1996), as well as an important
accumulation of Timiskaming sedimentary rocks (Duparquet
Formation; Rocheleau, 1980; Mueller et al., 1991). Many E–
W faults are present in the eastern sector where they crosscut
most of the lithologies. These faults are not necessarily
subsidiaries to the DPF, because it can be demonstrated that
certain faults are clearly prior to or contemporaneous with the
formation of the Duparquet basin (Goutier and Lacroix,
1992). An intense ENE–WSW to E–W schistosity is
associated with the DPF and the E–W faults, but is only
locally developed elsewhere in the area.
Duparquet Mining Camp
Several gold showings and deposits straddle the DPF
(Fig. 4c), although little gold has been extracted from the
Quebec portion of the DPF (~78 t Au production and
resources) compared to the Ontario side (>2,400 t Au
production and resources; Legault et al., 2004). An ongoing
regional metallogenic study by the Quebec Geological
Survey (MRNF) has identified seven main types of gold
mineralization along the DPF, each showing a distinct style,
alteration, control, metal content, and timing (Legault et al.,
2003, 2004). They are: sulfides associated with VMS,
epithermal veins, quartz-carbonate veins, silver-rich quartz
veins, disseminated sulfides associated with leaching, and
disseminated sulfides associated with intrusions. The latter
type has been subdivided into two subtypes based on the
composition of the intrusions: alkalic and calc-alkalic. Most
of the gold-bearing mineralization shows a close genetic
relationship with pyrite and sericite alteration, whereas the
correlation between gold and carbonates is not as
straightforward (Legault et al., 2003).
Compilation of the gold deposits and showings has
shown that gold was deposited at different depths and also at
different stages in the geological evolution of the area. Of the
seven types of gold mineralization identified to date, only
quartz-carbonate veins and disseminated sulfides associated
with alkalic intrusions appear to have the potential to host
economic deposits. The other mineralization types are either
too small, or the gold concentrations are too low or erratic.
The studies of Legault et al. (2003, 2004) can be
consulted for complete information regarding mineralization
history of the region.
3-D Geological Modeling Applied to Exploration
Targeting
General Issues
When 3-D integrated geological models are completed,
the chosen properties are interpolated (i.e., interpolation is an
estimation of a value within two known values in a sequence
of values) for every cell of the voxet. These cells can contain
information concerning the various lithologies, the alteration
indices, drill hole density and spatial distribution, and
geochemical and geophysical properties.
The completed 3-D integrated geological model is a
dynamic exploration tool that can be questioned according to
criteria reflecting the geological properties associated with
various mineral deposits. These interrogations or “queries”
allow the user to define the relationship between chosen
properties within a specific model, and to define 3-D zones of
high economic potential. These queries can include different
criteria depending on the metallogenic environment (i.e.,
distance to key marker horizons or faults, geochemical and
geophysical thresholds, rheological constraints, etc.).
Results from both the Joutel and Duparquet 3-D models
are presented below. They illustrate the importance of
carefully defining the parameters used in order to maximize
34 Exploration and Mining Geology, Vol. 15, Nos. 1-2, pp. 27-41, 2006
Fig.4.(a)SimplifiedgeologicalmapalongtheDestor-PorcupinefaultfromLegaultetal.(2003).(b)SimplifiedgeologicalmapoftheDuparquetminingcamp.ModifiedfromLegault
etal.(2003).(c)GoldshowingsanddepositsdistributionalongtheQuebec-OntarioDPF(forsymbollegendseefigure1).
3-D Modeling in the Abitibi Subprovince (Quebec, Canada) • F. FALLARA ET AL. 35
the chances of defining targets corresponding to new
mineralized zones. Each parameter definition, within a query,
is the result of iterative and interactive (i.e., trial and error)
processes.
Joutel VMS Mining Camp Example
Construction Steps
The 3-D integrated geological model was built first at a
1:20,000 regional scale (18 × 13.5 km, and 2 km vertical
depth). The regional-scale 3-D model of Joutel contains a
total of 27 lithological surfaces and two faulted surfaces for a
total of 34 closed geological bodies (regions) formed by 50 ×
50 × 25-m cells, creating a voxet with a total of 7.8 million
cells.
For the Joutel VMS camp-scale 3-D model, a smaller
voxet was built to focus on an area with a higher abundance
of data, and also to characterize in detail the VMS deposits
that were defined regionally to have typical alteration patterns
associated with Noranda-type deposits (i.e., chlorite alteration
centered on the deposit with a halo of sericite alteration;
Piché, 2000). The smaller and more detailed VMS model
(Fig. 3; 9 × 4 km, 1 km vertical depth, 25 × 15 × 15 m cells)
included: (a) data from 1,500 diamond drill holes; (b) 12,697
metallic assays; (c) 1,691 lithogeochemical analysis; and (d)
calculated Normat®
alteration indexes (Piché, 1999; Piché
and Jébrak, 2004).
Exploration Criteria (JVC)
When the Joutel VMS model was completed,
interpolations and queries were done using the geochemical
data, based on metallogenic criteria proposed by Piché (2000)
to define VMS targets. The choices of constraints used within
our VMS queries computed in gOcad®
are presented on a
UML flowchart (Fig. 5):
a. Initially, areas of high heat flow had to be identified
because they are responsible for the hydrothermal activ-
ity that produces VMS deposits. In fact, statistical stud-
ies within the Abitibi subprovince have shown that VMS
deposits tend to be located at certain distances from syn-
volcanic plutons: <1.5 km, or 4 to 5 km (S. Faure, pers.
commun., 2001). Thus, regions within the VMS voxet
with these specific distances to the Valrennes intrusion
were extracted.
b. Typical VMS deposits are underwater layers within vol-
canic centers produced by hydrothermal activity during
long periods of volcanic hiatus. Therefore, the identifica-
tion of zones with economic potential necessitated the
extraction of particular volcanic geological contacts
(e.g., basalt–rhyolite). Hence, regions within the VMS
voxet that contained both the felsic Poirier and the inter-
mediate Kistabiche members were selected from the
model.
c. A distance of between 250 and 750 m to existing dia-
mond drill holes was used as an additional constraint to
avoid creating mathematical artefacts such as border
effects along the edges of the voxet, and finding known
economic zones.
d. A distance of up to 1,500 m to identified synvolcanic
faults was the next constraint to refine new economic
zones.
e. Altered zones were then identified and subdivided into:
(a) zones of hydrothermal fluid recharge; that is, where
fluids that circulated in the identified regions leached out
metallic elements (Cu, Zn, Pb, Ag, Au), sulfur, Fe, and
Mg, leaving a rock rich in Si-Al (i.e., quartz-epidote);
and (b) discharge zones for hydrothermal fluids where
VMS deposits usually form. These latter zones are dis-
cordant, leached of alkalis, and enriched in chlorite-
sericite, Fe, Mg, and K, as well as metallic elements
These constraints allowed identification of the hydro-
thermal fluid activity signatures potentially responsible
for the formation of VMS type deposits. Normative alter-
ation indices (Piché, 2000; Piché and Jébrak, 2004), pre-
sented in Table 1, were used to infer the location of these
Fig. 5. Queries computed in gOcad®
represented on UML flowchart
for the Joutel VMS mining camp.
36 Exploration and Mining Geology, Vol. 15, Nos. 1-2, pp. 27-41, 2006
discharge zones. Table 2 illustrates the minimum and
maximum values within the Joutel VMS mining camp,
as well as the thresholds (defined by the 75th
percentile)
used within the VMS 3-D queries. These values are com-
pared to percentile values for the Abitibi, compiled by
Descarreaux (2000) from ~55,000 greenstone belt sam-
ples (Table 2).
In summary, a combination of high heat flow,
hydrothermal plumbing and conduits, stratigraphic controls,
and direct evidence of hydrothermal activity was used to
obtain typical VMS constraints used in for 3-D VMS
targeting (Fig. 6).
Duparquet Gold Mining Camp Example
Construction Steps
A 3-D model for the Duparquet camp was built at a
regional scale (11.4 × 4.0 × 1.0 km) integrating all of the
geoscientific data. It contains 74 lithological surfaces and 77
faulted surfaces for a total of 126 closed geological bodies
(regions) formed by 20 m3
cells, creating a voxet with a total
of 5.7 million cells. The data set imported into the 3-D model
included 1,746 diamond drill holes, which contained 50,348
Au assays and 3,638 lithogeochemical analyses. The model
was used to define 3-D gold distribution from available
diamond drill hole data and to establish queries in order to
propose new exploration targets. A smaller voxet named
Shaft (4.32 × 1.57 km; Fig. 4), with 10 m3
cells, was built to
focus on an area with a higher concentration of data and to
characterize in detail the gold isosurfaces that were defined
regionally.
Exploration Criteria (DP)
For gold exploration, the integration methodology of the
data remains the same as the VMS model, except that the
constraints used for queries (deformation zones, ankerite
alteration, lithological contacts, etc.) differ from 3-D VMS
targeting. Because gold targets are usually much smaller than
VMS targets, a higher density of data is needed in order to
explore efficiently at the same scale.
When the DP model was completed, interpolations and
queries were done using the style of mineralization at the
Holloway and Holt-McDermott deposits (approximately 17
km west of the Ontario-Quebec border along the DPF; Fig.
1). These mines strongly influenced the exploration approach
of Legault et al. (2004) within the DP model area, because it
is likely to have similar characteristics to these two
producers. The choices of constraints used within our gold-
bearing queries computed in gOcad®
are presented on a UML
flowchart (Fig. 7):
a. Proximal to the DPF, most of producing Au deposits are
within 200 m of E–W faults. Thus, our first query
extracts the regions close to E–W faults. The F39 fault
(Fig. 4B) is a reference surface that establishes a link
between the regional- and camp-scale models.
b. Most Au deposits along the DPF are hosted within units
with a FeO to MgO ratio greater than 3 (i.e., units with
high Fe concentration are usually favourable for gold
precipitation). Thus, our second query extracts those spe-
cific host rocks having a high Fe/Mg ratio.
c. The Holloway and Holt-McDermott deposits show
intense albitization spatially associated with significant
gold concentrations and located in the center of wall-
rock alteration halos of sericite and carbonate. Such
alteration, however, is rarely observed in the DP model
region (Legault et al., 2004). At the Holloway deposit,
albitization and economic gold values begin at a depth of
approximately 300 m (Ropchan et al., 2002). At shal-
lower depths, only sericitization and carbonatization are
present, suggesting that the highly sericitized structures
should be explored at greater depths. This third query
keeps regions with high levels of sericite-paragonite
(>40 vol.%) alteration or normative carbonate (>10
vol.%; Fig. 8; calculated using the procedure of Piché,
1999, and Piché and Jébrak 2004).
d. The exploration targets are defined in areas located at
more than 250 meters from a diamond drill hole (to
avoid finding known deposits).
e. Remaining regions with extrapolated gold values higher
than 50 ppb.
Borders of the Duparquet basin are the locus of known
gold deposits along the DPF, containing about 87% of
identified gold. Within the DP model area, exploration was
focused on the DPF (Fig. 4) and some of the subsidiary
structures (e.g., the Duquesne fault; Fig. 4). Little exploration
has been done on subsidiary faults bordering the basin, such
as the Ottman and Lepine faults (Fig. 4), despite the presence
of significant alteration zones of carbonate and sericite.
With the exception of a few sectors (Beattie, Shaft,
Duquesne; Legault et al., 2004), little exploration has been
undertaken at depths greater than 500 m. The environment of
the eastern part of the DPF differs from that of the western
part (Timmins sector, Ontario) by exhibiting a shallower
structural level. Legault et al. (2004) suggested that the lack
of gold on the Quebec side is possibly associated with its
epizonal position as illustrated by the presence of epithermal
mineralization. Economic mineralization may occur at greater
depth in the DPF, a possibility that has been little tested to
date.
Limitations of 3-D Integrated Geological Models
Even though 3-D models are robust and can be used as
interactive exploration tools for mineral exploration, it is
important to be aware of their limitations. Primary limitations
are caused by uncertainties that are propagated throughout the
model. The main sources of uncertainties that influence 3-D
models are:
a. Data distribution:
Irregular or sparse data distribution can result in less
meaningful regional interpolated values. In fact, the
3-D Modeling in the Abitibi Subprovince (Quebec, Canada) • F. FALLARA ET AL. 37
wider apart the known values are, the more difficult and
less precise it becomes to estimate what lies between
them.
b. Interpolation method:
The resulting value varies, depending on the chosen
interpolation method (e.g., less subjective for alteration
zonation and trend definition).
c. Geophysical inversion methods (unconstrained and
constrained):
Geophysical data sets can be used to construct 3-D
models and these can help a great deal in validating the
geological model; that is, applied geophysical inversions
can help constrain the depth extent and dip of specific
structures and lithologies. 3-D constrained data inversion
can be used as a tool to complement the 3-D initial
construction steps. Inversion methods provide a more
robust and quantitative solution (Perron et al., 2005).
d. Chosen criteria or constraints:
A wide variance of results can be obtained by
choosing different queries because the user’s subjectivity
is involved. For example, if there were twice as many
syn-volcanic faults interpreted there would be twice as
many 3-D VMS targets. If a user chooses a different
distance to syn-volcanic plutons in the JVC, or
introduces a query related to proximity to Timiskaming
sediments in the DP model, then the targets would be
quite different. This illustrates the point that the user’s
interests and perception of the metallogenic model
greatly influence the results obtained.
It is important to note that data density is one of the most
crucial factors in generating targets. Bringing these
limitations into the discussion does not detract from the
effectiveness of the tool, but actually creates more
opportunities to try different geological parameters.
Conclusions
The goal of this paper is to promote the use of 3-D
modeling in search of various types of ore deposits: this
approach could be applied anywhere in the world.
The integration of geoscientific data within a single 3-D
model, and the ability to display and query these data, are
significant advances for mineral exploration. The
multidisciplinary approach used in 3-D integrated geological
Table 1. Normative Alteration Indices Defined Specifically for VMS Deposits
Notes
Proposed by Piché (2000).
Table 2. Minimum and Maximum Values Within the Jotel VMS Mining Camp and Their Thresholds*
Used Within the VMS 3-D Queries
Notes
*Defined with the 75th
percentile.
Normative
Alteration Index
Description
MIN.FRAIS Albite + Actinolite + Epidote + Orthoclase + Tremolite + Titanite
MIN.ALT Hydrothermal (Paragonite + Pyrophyllite + Sericite+ Chlorite + Diaspore)
IFRAIS MIN. FRAIS * 100 / (MIN.FRAIS + MIN.ALT)
IPARA Hydrothermal Paragonite * 100/ (MIN. FRAIS + MIN. ALT)
ISER Hydrothermal Sericite * 100 / (MIN. FRAIS + MIN. ALT)
ICHLO Hydrothermal Chlorite * 100 / (MIN. FRAIS + MIN. ALT)
IPYRO Hydrothermal Pyrophyllite * 100 / (MIN. FRAIS + MIN. ALT)
ISERPAR Hydrothermal Paragonite + Sericite * 100 / (MIN. FRAIS + MIN. ALT)
ICHLOPYR Hydrothermal Chlorite + Pyrophyllite * 100 / (MIN. FRAIS + MIN. ALT)
Alteration
Index
Joutel VMS
Mining Camp
Min. Values
Joutel VMS
Mining Camp
Max. Values
Joutel VMS
Mining Camp
75th
Percentile
Abitibi** 75th
Percentile
Abitibi** 90th
Percentile
IFRAIS 0 100.00 75.74 73.66 35.58
IPARA 0 76.19 18.50 14.96 25.49
ISER 0 82.19 25.27 5.39 22.96
ICHLO 0 93.87 32.00 0.0003 0.0004
IPYRO 0 28.63 0.75 0.0003 0.0004
ISERPAR 0 94.11 41.61 24.29 48.6
ICHLOPYR 0 97.46 33.13 N/A N/A
ISHIKAWA 9.39 99.86 61.87 N/A N/A
Cu (%) 0 29.40 0.68 N/A N/A
Pb (%) 0 12.75 1.44 N/A N/A
Zn (%) 0 44.30 0.28 N/A N/A
magsus_hs 1.635 × 10⁻⁵ 0.06 0.005 N/A N/A
38 Exploration and Mining Geology, Vol. 15, Nos. 1-2, pp. 27-41, 2006
3-D Modeling in the Abitibi Subprovince (Quebec, Canada) • F. FALLARA ET AL. 39
Fig. 7. Queries computed in gOcad®
represented on UML flowchart for the Duparquet gold mining camp (orthose = orthoclase).
Fig. 6 (previous page). 3-D integrated geological model of the Joutel VMS mining camp applied to exploration targeting: (a) The final 3-
D model of Joutel contains a total of 27 lithological surfaces and two faulted surfaces (F1 and F2) for a total of 34 closed geological
bodies (regions) formed by 50 × 50 × 25 m cells, creating a voxet with a total of 7.8 million cells. (b) Extraction of regions within a
defined distance to synvolcanic plutons. (c) Extraction of regions within the Poirier and the Kistabiche members. (d) Extraction of regions
within a defined distance to diamond drill holes. (e) Extraction of regions within a defined distance to synvolcanic fractures or faults. (f)
Identification of altered zones within the above extracted regions. (g) Identification of zones favorable for metal precipitation within the
above extracted regions. Final targets resulting from the intersection of the altered zones and the zones rich in metals (B∩A; Figure 5).
40 Exploration and Mining Geology, Vol. 15, Nos. 1-2, pp. 27-41, 2006
Fig. 8. 3-D integrated geological model of the Duparquet gold mining camp applied to exploration targeting: (a) The final 3-D model of
Duparquet contains a total of 74 lithological surfaces and 77 faulted surfaces for a total of 126 closed geological bodies (regions) formed by 20
m3
cells, creating a voxet with a total of 5.7 million cells. (b) The query is refined by choosing areas near first- and second-order E–W faults. (c)
Extraction of regions with high Fe/Mg ratio. (d) Extraction of regions having either high levels of sericite-paragonite or normative carbonate
alteration. (e) Regions are then extracted within areas located
modeling demonstrates that this method can be used as a
regional interactive exploration tool, allowing the use of
various criteria to constrain and refine queries, and lead to the
definition of exploration targets.
The generation of 3-D integrated geological models of
mature mining camps in the Abitibi subprovince produces
refined geological syntheses and new exploration targets for
deep exploration programs. Many exploration projects with a
solid basis in quantitative geology are being elaborated in
Quebec’s principal mining region (Abitibi), and strong
partnerships between the URSTM-UQAT, the MRNF, and
major exploration companies are also being developed. The
models benefit from continuous validation and upgrading of
the underlying database, as well as the production of regional
syntheses, integrating geological, geophysical, and
geochemical models in a single platform.
For geological working teams, the main advantages of
using 3-D integrated geological models are to:
1. Share the information:
a. Conveys the data and their interpretation in a format
that is accessible to all.
b. Avoids loss of knowledge and interpretations that
may be:
• Distributed across various places within the
company;
• Filed in disorganized ways;
• Never filed and existing only in employee’s
memory.
2. Catalyze the development of knowledge:
a. Easily integrates data under a common format;
b. Preserves data in a unique archiving platform where
it can easily be shared, seen, and analyzed.
3. Resolve problems with the entire team:
3-D Modeling in the Abitibi Subprovince (Quebec, Canada) • F. FALLARA ET AL. 41
a. Adaptable to team-driven problem resolution;
b. Easy access to information for all team members,
collaborators, and stakeholders; allows a shared
comprehension of the data.
3. Accelerate the process of data integration and
interpretation:
a. Defines new targets with reduced uncertainty;
b. Focuses the work on data interpretation: optimizes
data subsets with the help of an integrating tool.
3. Direct access to data and data manipulation within the
gOcad®
software:
a. Queries the 3-D integrated geological model.
b. Saves time: rapidly validates the data and resolves
uncertainties.
The natural outgrowth of these 3-D geological models
would be their extrapolation away from mining camps with
large amounts of data to more remote areas with less data.
The development of a more rigorous geostatistical approach
for data interpolation throughout the model and its
application to the query definition would better identify
possible 3-D targets.
Acknowledgments
The authors would like to acknowledge J. Jobidon for
the graphical design of our gOcad®
images; R. McLeod and
G. Morin for their computer and technical support throughout
the project; G. Boudrias, P. Lévesque, J. Pettigrew, and M.
Sarault for the compilation of data; C. Dion, Y. Lei, M. Piché,
R. Marquis, and J. Stock for their geological consulting work;
and G. Perron, V. Laflèche, J. McGaughey, and C. Williston
for 3-D consultation. J. Moorhead, P. Rhéaume, L. Martin,
and E. de Kemp are thanked for their critical reading of an
early draft of the manuscript, and K.F. Cassidy and T.
Setterfield are thanked for their formal reviews. This paper is
MRNF contribution number 2004-5130-04.
References
Barrie, C.T., 1999, The Kidd-Munro extension project: Year
3 report: Soumis à l’Ontario Geological Survey, internal
report, 263 p.
Boniwell, B., and Dujardin, A., 1964, Discovery and
exploration of the Poirier ore deposit: Canadian Mining
and Metallurgical Bulletin, v. 57, p. 945–952.
Chown, E.H., Daigneault, R., Mueller, W., and Mortensen,
J.K., 1992, Tectonic evolution of the northern volcanic
zone, Abitibi belt, Quebec: Canadian Journal of Earth
Sciences, v. 29, p. 2211–2225.
Chown, E.H., Harrap, R., and Moukhsil, A., 2002, The role of
granitic intrusions in the evolution of the Abitibi belt,
Canada: Precambrian Research, v. 115, p. 291–310.
Corfu, F., and Noble, S., 1992, Genesis of the southern
Abitibi greenstone belt, Superior province, Canada:
Evidence from Zircon Hf isotope analyses using a single
filament technique: Geochimica et Cosmochimica Acta,
v. 56, p. 2081–2097.
Davis, D., 2002, U-Pb geochronology of Archean
metasedimentary rocks in the Pontiac and Abitibi
subprovinces, Quebec, contraints on timing, provenance
and regional tectonics: Precambrian Research, v. 115, p.
97–117.
Davis, W.J., Machado, N., and Gariépy, C., 1993, U-Pb
geochronology of plutonic rocks along LITHOPROBE
Line 28, northern Abitibi subprovince: LITHOPROBE
Abitibi-Grenville Project, report 33, p. 145–147.
Descarreaux, J., 2000, Banque de données
lithogéochimiques: internal report, 1 p.
Doucet, P., Goutier, J., Melançon, M., and Ste-Croix, L.,
2000, L’Abitibi: Un centenaire d’exploration et de
succès minier: Ministère des Ressources naturelles,
faune et parcs, Québec, DV 2000-03, p. 44.
Dubé, L.M., 1993, Géologie de la région de Joutel (Abitibi):
Ministère de l’Énergie et des Ressources, Québec, ET
90-12, 61 p.
Fallara, F., Perron, G., and Williston, C., 2001, Modélisation
régionale 3-D géo-intégré: Phase 1, Camp minier de
Joutel, Abitibi (Québec): Ministère des Ressources
naturelles, faune et parcs, Québec, PRO-2001-11, CD.
Fallara, F., Perron, G., and Williston, C., 2002a, 3-D
Regional common-earth modeling: Pahe 1, Joutel
Mining Camp, Abitibi (Québec): Ministère des
Ressources naturelles, faune et parcs, Québec, PRO-
2002-01, CD.
Fallara, F., Bois, D., Perron, G., and Marquis, R., 2002b,
Modélisation 3-D géo-intégrée gOcad®
: Détermination
des paramètres de faisabilité pour la modélisation
régionale, Rapport de faisabilité interne, 66 p.
Fowler, M., 2000, UML Distilled, 2nd ed.: Addison-Wesley
Longman Inc., Boston, 185 p.
Franklin, J.M., 1996, Gîtes de sulfures massifs à métaux
communs associés à des roches volcaniques, in
Eckstrand, O.R., Sinclair, W.D., and Thorpe, R.I., eds.,
Géologie des types de gîtes minéraux du Canada, v. 8, p.
174–202.
Goutier, J., and Lacroix, S., 1992, Géologie du secteur de la
Faille de Porcupine-Destor dans les cantons de Destor et
Duparquet: Ministère de l’Énergie et des Ressources,
Québec, MB 92-06, 66 p., 2 maps, scale 1:20,000.
Jébrak, M., 2000, Le pluton de Joutel: Études pétrologique et
métallogénique de la région de Joutel, Sous-province de
l’Abitibi: Ministère des Ressources naturelles du
Québec, MB 2000-11, p. 4–17.
Lacroix, S., 1998, Compilation et répartition des gisements
polymétalliques à tonnage évalué dans la Sous-province
de l’Abitibi: Ministère des Ressources naturelles du
Québec, MB 98-06, 29 p.
Legault, M., Daigneault, R., Mueller, W., Gauthier, M.,
Jébrak, M., and Piché, M., 2000, Contexte géologique du
camp minier de Joutel: Ministère des Ressources
naturelles, faune et parc, Québec, MB 2000-10, 45 p.
42 Exploration and Mining Geology, Vol. 15, Nos. 1-2, pp. 27-41, 2006
Legault, M., Gauthier, M., Jébrak, M., Davis, D.W., and
Baillargeon, F., 2002, Evolution of the subaqueous to
near-emergent Joutel volcanic complex, northern
volcanic zone, Abitibi subprovince, Quebec, Canada:
Precambrian Research, v. 115, p. 187–221.
Legault, M., Fallara, F., Cheng, L.Z., Beaudoin, G., Goutier,
J., Perron, G., Rabeau, O., and Aucoin, M., 2003, A new
look at an old mining camp: The Destor-Porcupine fault,
Abitibi subprovince (phase 2): Ministère des Ressources
Naturelles, faune et parc, Québec, DV 2003-08, p. 116.
Legault, M., Fallara, F., Cheng, L.Z., Beaudoin, G., Goutier,
J., Perron, G., Rabeau, O., and Aucoin, M., 2004,
Synthèse métallogénique et modélisation 3-D de la Faille
de Porcupine-Destor dans le secteur de Duparquet, sous-
province de l’Abitibi (phase 2/3): Ministère des
Ressources Naturelles, faune et parc, Québec, RP 2004-
07, 15 p.
Marquis, R., McGaughey, J., and Bois, D., 2003, Quantitative
geology using 3-D common-earth modeling, in PDAC
Open Session: New opportunities in familiar places:
PDAC, Toronto, Ontario, 5 p.
Mortensen, J.K., 1993, U-Pb geochronology of the eastern
Abitibi subprovince, Part 1: Noranda-Kirkland Lake
area: Canadian Journal of Earth Sciences, v. 30, p. 29–
41.
Morton, R.L., and Franklin, J.M., 1987, Two-fold
classification of Archean volcanic-associated massive
sulfide deposits: Economic Geology, v. 82, p. 1057–
1063.
Mueller, W., Donaldson, J.A., Dufresne, D., and Rocheleau,
M., 1991, The Duparquet Formation: Sedimentation in a
late Archean successor basin, Abitibi greenstone belt,
Quebec, Canada: Canadian Journal of Earth Sciences, v.
28, p.1394–1406.
Mueller, W.U., Daigneault, R., Mortensen, J., and Chown, E.,
1996, Archean terrane docking: Upper crust collision
tectonics, Abitibi greenstone belt, Quebec, Canada:
Tectonophysics, v. 265, p. 127–150.
Perron, G., McGaughey, J., Fullagar, P., and Pears., G., 2005,
3-D gravity and magnetic inversion in Gocad: Nancy
School of Geology, 25th Gocad meeting, Nancy, France,
2005, 1 p.
Piché, M., 1999, Les altérations hydrothermales: cours de
l’APGGQ à Rouyn-Noranda, 4 p.
Piché, M., 2000, Quantification de l'altération hydrothermale
des roches du camp minier de Joutel à partir d'analyses
d’éléments majeurs: Ministère des Ressources
Naturelles, Québec: MB 2000-06, 28 p.
Piché, M., and Jébrak, M., 2004, Normative minerals and
alteration indices developed for mineral exploration:
Journal of Geochemical Exploration, v. 82, p. 59–77.
Rocheleau, M., 1980, Stratigraphie et sédimentologie de
l’Archéen dans la region de Rouyn, Abitibi, Québec,
MRNF TH 0146, 284 p.
Ropchan, J.R., Luinstra, B., Fowler, A.D., and Benn, K.,
2002, Host-rock and structural controls on the nature and
timing of gold mineralization at the Holloway mine,
Abitibi subprovince, Ontario: Economic Geology, v. 97,
no. 2, p. 291–309.
Zhang, P., Machado, N., Ludden, J., and Moore, D., 1993,
Geotectonics constraints from U-Pb ages for the Blake
River Group, the Kinojévis Group, and the Normétal
mine area, Abitibi, Québec: Association géologique du
Canada-Association minéralogique du Canada, v. 18, p.
A114.
3-D Modeling in the Abitibi Subprovince (Quebec, Canada) • F. FALLARA ET AL. 43
44 Exploration and Mining Geology, Vol. 15, Nos. 1-2, pp. 27-41, 2006

More Related Content

What's hot

Modelling of 3D gelogical structures
Modelling of 3D gelogical structuresModelling of 3D gelogical structures
Modelling of 3D gelogical structuresZawar Khan
 
GCURSP Poster Final
GCURSP Poster FinalGCURSP Poster Final
GCURSP Poster FinalAlexa Fornes
 
2. Technical introduction to the GSOC Map
2. Technical introduction to the GSOC Map2. Technical introduction to the GSOC Map
2. Technical introduction to the GSOC MapFAO
 
Exploration in the House 2015: NSW Seamless Geology Project: Progress to date...
Exploration in the House 2015: NSW Seamless Geology Project: Progress to date...Exploration in the House 2015: NSW Seamless Geology Project: Progress to date...
Exploration in the House 2015: NSW Seamless Geology Project: Progress to date...NSW Environment and Planning
 
Soil Organic Carbon Map of Mexico
Soil Organic Carbon Map of MexicoSoil Organic Carbon Map of Mexico
Soil Organic Carbon Map of MexicoExternalEvents
 
A Survey on Landslide Susceptibility Mapping Using Soft Computing Techniques
A Survey on Landslide Susceptibility Mapping Using Soft Computing TechniquesA Survey on Landslide Susceptibility Mapping Using Soft Computing Techniques
A Survey on Landslide Susceptibility Mapping Using Soft Computing Techniquesiosrjce
 
A brief story of success of the lineament analysis RV final
A brief story of success of the lineament analysis RV finalA brief story of success of the lineament analysis RV final
A brief story of success of the lineament analysis RV finalRicardo Valls P. Geo., M. Sc.
 
GSOC17 Introduction, Product specifications, Existing SOC maps and methodologies
GSOC17 Introduction, Product specifications, Existing SOC maps and methodologiesGSOC17 Introduction, Product specifications, Existing SOC maps and methodologies
GSOC17 Introduction, Product specifications, Existing SOC maps and methodologiesFAO
 
Final Project Update
Final Project UpdateFinal Project Update
Final Project Updatemolivos
 
THE IMPORTANCE OF SAMPLING FOR THE EFFICIENCY OF ARTIFICIAL NEURAL NETWORKS I...
THE IMPORTANCE OF SAMPLING FOR THE EFFICIENCY OF ARTIFICIAL NEURAL NETWORKS I...THE IMPORTANCE OF SAMPLING FOR THE EFFICIENCY OF ARTIFICIAL NEURAL NETWORKS I...
THE IMPORTANCE OF SAMPLING FOR THE EFFICIENCY OF ARTIFICIAL NEURAL NETWORKS I...Ricardo Brasil
 
A knowledge-based model for identifying and mapping tropical wetlands and pea...
A knowledge-based model for identifying and mapping tropical wetlands and pea...A knowledge-based model for identifying and mapping tropical wetlands and pea...
A knowledge-based model for identifying and mapping tropical wetlands and pea...ExternalEvents
 
2. virat arora, s. s. rao, e. amminedu and p. jagadeeswara rao
2. virat arora, s. s. rao, e. amminedu and p. jagadeeswara rao2. virat arora, s. s. rao, e. amminedu and p. jagadeeswara rao
2. virat arora, s. s. rao, e. amminedu and p. jagadeeswara raoJournal of Global Resources
 
3 d geological modelling and resource w
3 d geological modelling and resource w3 d geological modelling and resource w
3 d geological modelling and resource wVicky Herlangga
 
Design of a Dynamic Land-Use Change Probability - Yongjin Joo, Chulmin Jun, S...
Design of a Dynamic Land-Use Change Probability - Yongjin Joo, Chulmin Jun, S...Design of a Dynamic Land-Use Change Probability - Yongjin Joo, Chulmin Jun, S...
Design of a Dynamic Land-Use Change Probability - Yongjin Joo, Chulmin Jun, S...Beniamino Murgante
 
Belmont Res.Kibby Basin,NV. Property Gravity Survey Basin Model
Belmont Res.Kibby Basin,NV. Property Gravity Survey Basin ModelBelmont Res.Kibby Basin,NV. Property Gravity Survey Basin Model
Belmont Res.Kibby Basin,NV. Property Gravity Survey Basin ModelFollow me on Twitter @Stockshaman
 
Porosity prediction from seismic using geostatistic
Porosity prediction from seismic using geostatisticPorosity prediction from seismic using geostatistic
Porosity prediction from seismic using geostatisticMelani Khairunisa
 
Harmonization of seismic hazard assessment: the SHARE example
Harmonization of seismic hazard assessment: the SHARE exampleHarmonization of seismic hazard assessment: the SHARE example
Harmonization of seismic hazard assessment: the SHARE exampleGlobal Risk Forum GRFDavos
 

What's hot (20)

Modelling of 3D gelogical structures
Modelling of 3D gelogical structuresModelling of 3D gelogical structures
Modelling of 3D gelogical structures
 
GCURSP Poster Final
GCURSP Poster FinalGCURSP Poster Final
GCURSP Poster Final
 
2. Technical introduction to the GSOC Map
2. Technical introduction to the GSOC Map2. Technical introduction to the GSOC Map
2. Technical introduction to the GSOC Map
 
Exploration in the House 2015: NSW Seamless Geology Project: Progress to date...
Exploration in the House 2015: NSW Seamless Geology Project: Progress to date...Exploration in the House 2015: NSW Seamless Geology Project: Progress to date...
Exploration in the House 2015: NSW Seamless Geology Project: Progress to date...
 
M.Diviu
M.DiviuM.Diviu
M.Diviu
 
TT_Introduction6
TT_Introduction6TT_Introduction6
TT_Introduction6
 
Soil Organic Carbon Map of Mexico
Soil Organic Carbon Map of MexicoSoil Organic Carbon Map of Mexico
Soil Organic Carbon Map of Mexico
 
A Survey on Landslide Susceptibility Mapping Using Soft Computing Techniques
A Survey on Landslide Susceptibility Mapping Using Soft Computing TechniquesA Survey on Landslide Susceptibility Mapping Using Soft Computing Techniques
A Survey on Landslide Susceptibility Mapping Using Soft Computing Techniques
 
A brief story of success of the lineament analysis RV final
A brief story of success of the lineament analysis RV finalA brief story of success of the lineament analysis RV final
A brief story of success of the lineament analysis RV final
 
GSOC17 Introduction, Product specifications, Existing SOC maps and methodologies
GSOC17 Introduction, Product specifications, Existing SOC maps and methodologiesGSOC17 Introduction, Product specifications, Existing SOC maps and methodologies
GSOC17 Introduction, Product specifications, Existing SOC maps and methodologies
 
Final Project Update
Final Project UpdateFinal Project Update
Final Project Update
 
THE IMPORTANCE OF SAMPLING FOR THE EFFICIENCY OF ARTIFICIAL NEURAL NETWORKS I...
THE IMPORTANCE OF SAMPLING FOR THE EFFICIENCY OF ARTIFICIAL NEURAL NETWORKS I...THE IMPORTANCE OF SAMPLING FOR THE EFFICIENCY OF ARTIFICIAL NEURAL NETWORKS I...
THE IMPORTANCE OF SAMPLING FOR THE EFFICIENCY OF ARTIFICIAL NEURAL NETWORKS I...
 
D05721720
D05721720D05721720
D05721720
 
A knowledge-based model for identifying and mapping tropical wetlands and pea...
A knowledge-based model for identifying and mapping tropical wetlands and pea...A knowledge-based model for identifying and mapping tropical wetlands and pea...
A knowledge-based model for identifying and mapping tropical wetlands and pea...
 
2. virat arora, s. s. rao, e. amminedu and p. jagadeeswara rao
2. virat arora, s. s. rao, e. amminedu and p. jagadeeswara rao2. virat arora, s. s. rao, e. amminedu and p. jagadeeswara rao
2. virat arora, s. s. rao, e. amminedu and p. jagadeeswara rao
 
3 d geological modelling and resource w
3 d geological modelling and resource w3 d geological modelling and resource w
3 d geological modelling and resource w
 
Design of a Dynamic Land-Use Change Probability - Yongjin Joo, Chulmin Jun, S...
Design of a Dynamic Land-Use Change Probability - Yongjin Joo, Chulmin Jun, S...Design of a Dynamic Land-Use Change Probability - Yongjin Joo, Chulmin Jun, S...
Design of a Dynamic Land-Use Change Probability - Yongjin Joo, Chulmin Jun, S...
 
Belmont Res.Kibby Basin,NV. Property Gravity Survey Basin Model
Belmont Res.Kibby Basin,NV. Property Gravity Survey Basin ModelBelmont Res.Kibby Basin,NV. Property Gravity Survey Basin Model
Belmont Res.Kibby Basin,NV. Property Gravity Survey Basin Model
 
Porosity prediction from seismic using geostatistic
Porosity prediction from seismic using geostatisticPorosity prediction from seismic using geostatistic
Porosity prediction from seismic using geostatistic
 
Harmonization of seismic hazard assessment: the SHARE example
Harmonization of seismic hazard assessment: the SHARE exampleHarmonization of seismic hazard assessment: the SHARE example
Harmonization of seismic hazard assessment: the SHARE example
 

Similar to 3-D integrated geological modeling in the Abitibi Subprovince (Québec, Canada): techniques and applications

Geologic Data Models
Geologic Data ModelsGeologic Data Models
Geologic Data ModelsAndrew Zolnai
 
Gis Applications Presentation
Gis Applications PresentationGis Applications Presentation
Gis Applications PresentationIdua Olunwa
 
Evaluation of optical and synthetic aperture radar image fusion methods: a ca...
Evaluation of optical and synthetic aperture radar image fusion methods: a ca...Evaluation of optical and synthetic aperture radar image fusion methods: a ca...
Evaluation of optical and synthetic aperture radar image fusion methods: a ca...IJECEIAES
 
The conductivity structure of the Gediz Graben geothermal area extracted from...
The conductivity structure of the Gediz Graben geothermal area extracted from...The conductivity structure of the Gediz Graben geothermal area extracted from...
The conductivity structure of the Gediz Graben geothermal area extracted from...Erhan Erdogan
 
Using Virtual Reality Technology in Oil and Gas Industry
Using Virtual Reality Technology in Oil and Gas IndustryUsing Virtual Reality Technology in Oil and Gas Industry
Using Virtual Reality Technology in Oil and Gas IndustryDr. Amarjeet Singh
 
Implementation of a Finite Element Model to Generate Synthetic data for Open ...
Implementation of a Finite Element Model to Generate Synthetic data for Open ...Implementation of a Finite Element Model to Generate Synthetic data for Open ...
Implementation of a Finite Element Model to Generate Synthetic data for Open ...IRJET Journal
 
Seismic applications throughout_life_reservoir_or_2002
Seismic applications throughout_life_reservoir_or_2002Seismic applications throughout_life_reservoir_or_2002
Seismic applications throughout_life_reservoir_or_2002Fands-llc
 
DSD-INT 2017 New features in iMOD for the dissemination of geological models ...
DSD-INT 2017 New features in iMOD for the dissemination of geological models ...DSD-INT 2017 New features in iMOD for the dissemination of geological models ...
DSD-INT 2017 New features in iMOD for the dissemination of geological models ...Deltares
 
Introduction to GSOC map
Introduction to GSOC mapIntroduction to GSOC map
Introduction to GSOC mapFAO
 
GMEX Introduction
GMEX IntroductionGMEX Introduction
GMEX Introductiongmex
 
ASEG-PESA-AIG_2016_Abstract_North West Shelf 3D Velocity Modeling_ESTIMAGES
ASEG-PESA-AIG_2016_Abstract_North West Shelf 3D Velocity Modeling_ESTIMAGESASEG-PESA-AIG_2016_Abstract_North West Shelf 3D Velocity Modeling_ESTIMAGES
ASEG-PESA-AIG_2016_Abstract_North West Shelf 3D Velocity Modeling_ESTIMAGESLaureline Monteignies
 
Study on stochastic flow in low permeability sandstone oil reservoir
Study on stochastic flow in low permeability sandstone oil reservoirStudy on stochastic flow in low permeability sandstone oil reservoir
Study on stochastic flow in low permeability sandstone oil reservoireSAT Journals
 
Evaluation of the Back Propagation Neural Network for Gravity Mapping
Evaluation of the Back Propagation Neural Network for Gravity Mapping Evaluation of the Back Propagation Neural Network for Gravity Mapping
Evaluation of the Back Propagation Neural Network for Gravity Mapping IRJET Journal
 

Similar to 3-D integrated geological modeling in the Abitibi Subprovince (Québec, Canada): techniques and applications (20)

Geologic Data Models
Geologic Data ModelsGeologic Data Models
Geologic Data Models
 
John McGaughey - Towards integrated interpretation
John McGaughey - Towards integrated interpretationJohn McGaughey - Towards integrated interpretation
John McGaughey - Towards integrated interpretation
 
D05731416
D05731416D05731416
D05731416
 
Hedrick_Poster
Hedrick_PosterHedrick_Poster
Hedrick_Poster
 
Gis Applications Presentation
Gis Applications PresentationGis Applications Presentation
Gis Applications Presentation
 
Evaluation of optical and synthetic aperture radar image fusion methods: a ca...
Evaluation of optical and synthetic aperture radar image fusion methods: a ca...Evaluation of optical and synthetic aperture radar image fusion methods: a ca...
Evaluation of optical and synthetic aperture radar image fusion methods: a ca...
 
The conductivity structure of the Gediz Graben geothermal area extracted from...
The conductivity structure of the Gediz Graben geothermal area extracted from...The conductivity structure of the Gediz Graben geothermal area extracted from...
The conductivity structure of the Gediz Graben geothermal area extracted from...
 
Using Virtual Reality Technology in Oil and Gas Industry
Using Virtual Reality Technology in Oil and Gas IndustryUsing Virtual Reality Technology in Oil and Gas Industry
Using Virtual Reality Technology in Oil and Gas Industry
 
Evolution
EvolutionEvolution
Evolution
 
Implementation of a Finite Element Model to Generate Synthetic data for Open ...
Implementation of a Finite Element Model to Generate Synthetic data for Open ...Implementation of a Finite Element Model to Generate Synthetic data for Open ...
Implementation of a Finite Element Model to Generate Synthetic data for Open ...
 
Seismic applications throughout_life_reservoir_or_2002
Seismic applications throughout_life_reservoir_or_2002Seismic applications throughout_life_reservoir_or_2002
Seismic applications throughout_life_reservoir_or_2002
 
DSD-INT 2017 New features in iMOD for the dissemination of geological models ...
DSD-INT 2017 New features in iMOD for the dissemination of geological models ...DSD-INT 2017 New features in iMOD for the dissemination of geological models ...
DSD-INT 2017 New features in iMOD for the dissemination of geological models ...
 
09.pdf
09.pdf09.pdf
09.pdf
 
09
0909
09
 
437FINALREPORTmnras
437FINALREPORTmnras437FINALREPORTmnras
437FINALREPORTmnras
 
Introduction to GSOC map
Introduction to GSOC mapIntroduction to GSOC map
Introduction to GSOC map
 
GMEX Introduction
GMEX IntroductionGMEX Introduction
GMEX Introduction
 
ASEG-PESA-AIG_2016_Abstract_North West Shelf 3D Velocity Modeling_ESTIMAGES
ASEG-PESA-AIG_2016_Abstract_North West Shelf 3D Velocity Modeling_ESTIMAGESASEG-PESA-AIG_2016_Abstract_North West Shelf 3D Velocity Modeling_ESTIMAGES
ASEG-PESA-AIG_2016_Abstract_North West Shelf 3D Velocity Modeling_ESTIMAGES
 
Study on stochastic flow in low permeability sandstone oil reservoir
Study on stochastic flow in low permeability sandstone oil reservoirStudy on stochastic flow in low permeability sandstone oil reservoir
Study on stochastic flow in low permeability sandstone oil reservoir
 
Evaluation of the Back Propagation Neural Network for Gravity Mapping
Evaluation of the Back Propagation Neural Network for Gravity Mapping Evaluation of the Back Propagation Neural Network for Gravity Mapping
Evaluation of the Back Propagation Neural Network for Gravity Mapping
 

Recently uploaded

Dashanga agada a formulation of Agada tantra dealt in 3 Rd year bams agada tanta
Dashanga agada a formulation of Agada tantra dealt in 3 Rd year bams agada tantaDashanga agada a formulation of Agada tantra dealt in 3 Rd year bams agada tanta
Dashanga agada a formulation of Agada tantra dealt in 3 Rd year bams agada tantaPraksha3
 
Behavioral Disorder: Schizophrenia & it's Case Study.pdf
Behavioral Disorder: Schizophrenia & it's Case Study.pdfBehavioral Disorder: Schizophrenia & it's Case Study.pdf
Behavioral Disorder: Schizophrenia & it's Case Study.pdfSELF-EXPLANATORY
 
Call Girls in Mayapuri Delhi 💯Call Us 🔝9953322196🔝 💯Escort.
Call Girls in Mayapuri Delhi 💯Call Us 🔝9953322196🔝 💯Escort.Call Girls in Mayapuri Delhi 💯Call Us 🔝9953322196🔝 💯Escort.
Call Girls in Mayapuri Delhi 💯Call Us 🔝9953322196🔝 💯Escort.aasikanpl
 
Traditional Agroforestry System in India- Shifting Cultivation, Taungya, Home...
Traditional Agroforestry System in India- Shifting Cultivation, Taungya, Home...Traditional Agroforestry System in India- Shifting Cultivation, Taungya, Home...
Traditional Agroforestry System in India- Shifting Cultivation, Taungya, Home...jana861314
 
BIOETHICS IN RECOMBINANT DNA TECHNOLOGY.
BIOETHICS IN RECOMBINANT DNA TECHNOLOGY.BIOETHICS IN RECOMBINANT DNA TECHNOLOGY.
BIOETHICS IN RECOMBINANT DNA TECHNOLOGY.PraveenaKalaiselvan1
 
Isotopic evidence of long-lived volcanism on Io
Isotopic evidence of long-lived volcanism on IoIsotopic evidence of long-lived volcanism on Io
Isotopic evidence of long-lived volcanism on IoSérgio Sacani
 
Is RISC-V ready for HPC workload? Maybe?
Is RISC-V ready for HPC workload? Maybe?Is RISC-V ready for HPC workload? Maybe?
Is RISC-V ready for HPC workload? Maybe?Patrick Diehl
 
Unlocking the Potential: Deep dive into ocean of Ceramic Magnets.pptx
Unlocking  the Potential: Deep dive into ocean of Ceramic Magnets.pptxUnlocking  the Potential: Deep dive into ocean of Ceramic Magnets.pptx
Unlocking the Potential: Deep dive into ocean of Ceramic Magnets.pptxanandsmhk
 
TOPIC 8 Temperature and Heat.pdf physics
TOPIC 8 Temperature and Heat.pdf physicsTOPIC 8 Temperature and Heat.pdf physics
TOPIC 8 Temperature and Heat.pdf physicsssuserddc89b
 
Neurodevelopmental disorders according to the dsm 5 tr
Neurodevelopmental disorders according to the dsm 5 trNeurodevelopmental disorders according to the dsm 5 tr
Neurodevelopmental disorders according to the dsm 5 trssuser06f238
 
A relative description on Sonoporation.pdf
A relative description on Sonoporation.pdfA relative description on Sonoporation.pdf
A relative description on Sonoporation.pdfnehabiju2046
 
PossibleEoarcheanRecordsoftheGeomagneticFieldPreservedintheIsuaSupracrustalBe...
PossibleEoarcheanRecordsoftheGeomagneticFieldPreservedintheIsuaSupracrustalBe...PossibleEoarcheanRecordsoftheGeomagneticFieldPreservedintheIsuaSupracrustalBe...
PossibleEoarcheanRecordsoftheGeomagneticFieldPreservedintheIsuaSupracrustalBe...Sérgio Sacani
 
SOLUBLE PATTERN RECOGNITION RECEPTORS.pptx
SOLUBLE PATTERN RECOGNITION RECEPTORS.pptxSOLUBLE PATTERN RECOGNITION RECEPTORS.pptx
SOLUBLE PATTERN RECOGNITION RECEPTORS.pptxkessiyaTpeter
 
CALL ON ➥8923113531 🔝Call Girls Kesar Bagh Lucknow best Night Fun service 🪡
CALL ON ➥8923113531 🔝Call Girls Kesar Bagh Lucknow best Night Fun service  🪡CALL ON ➥8923113531 🔝Call Girls Kesar Bagh Lucknow best Night Fun service  🪡
CALL ON ➥8923113531 🔝Call Girls Kesar Bagh Lucknow best Night Fun service 🪡anilsa9823
 
Boyles law module in the grade 10 science
Boyles law module in the grade 10 scienceBoyles law module in the grade 10 science
Boyles law module in the grade 10 sciencefloriejanemacaya1
 
Grafana in space: Monitoring Japan's SLIM moon lander in real time
Grafana in space: Monitoring Japan's SLIM moon lander  in real timeGrafana in space: Monitoring Japan's SLIM moon lander  in real time
Grafana in space: Monitoring Japan's SLIM moon lander in real timeSatoshi NAKAHIRA
 
Biopesticide (2).pptx .This slides helps to know the different types of biop...
Biopesticide (2).pptx  .This slides helps to know the different types of biop...Biopesticide (2).pptx  .This slides helps to know the different types of biop...
Biopesticide (2).pptx .This slides helps to know the different types of biop...RohitNehra6
 
Nanoparticles synthesis and characterization​ ​
Nanoparticles synthesis and characterization​  ​Nanoparticles synthesis and characterization​  ​
Nanoparticles synthesis and characterization​ ​kaibalyasahoo82800
 
Hubble Asteroid Hunter III. Physical properties of newly found asteroids
Hubble Asteroid Hunter III. Physical properties of newly found asteroidsHubble Asteroid Hunter III. Physical properties of newly found asteroids
Hubble Asteroid Hunter III. Physical properties of newly found asteroidsSérgio Sacani
 

Recently uploaded (20)

Dashanga agada a formulation of Agada tantra dealt in 3 Rd year bams agada tanta
Dashanga agada a formulation of Agada tantra dealt in 3 Rd year bams agada tantaDashanga agada a formulation of Agada tantra dealt in 3 Rd year bams agada tanta
Dashanga agada a formulation of Agada tantra dealt in 3 Rd year bams agada tanta
 
Behavioral Disorder: Schizophrenia & it's Case Study.pdf
Behavioral Disorder: Schizophrenia & it's Case Study.pdfBehavioral Disorder: Schizophrenia & it's Case Study.pdf
Behavioral Disorder: Schizophrenia & it's Case Study.pdf
 
Call Girls in Mayapuri Delhi 💯Call Us 🔝9953322196🔝 💯Escort.
Call Girls in Mayapuri Delhi 💯Call Us 🔝9953322196🔝 💯Escort.Call Girls in Mayapuri Delhi 💯Call Us 🔝9953322196🔝 💯Escort.
Call Girls in Mayapuri Delhi 💯Call Us 🔝9953322196🔝 💯Escort.
 
Traditional Agroforestry System in India- Shifting Cultivation, Taungya, Home...
Traditional Agroforestry System in India- Shifting Cultivation, Taungya, Home...Traditional Agroforestry System in India- Shifting Cultivation, Taungya, Home...
Traditional Agroforestry System in India- Shifting Cultivation, Taungya, Home...
 
BIOETHICS IN RECOMBINANT DNA TECHNOLOGY.
BIOETHICS IN RECOMBINANT DNA TECHNOLOGY.BIOETHICS IN RECOMBINANT DNA TECHNOLOGY.
BIOETHICS IN RECOMBINANT DNA TECHNOLOGY.
 
Isotopic evidence of long-lived volcanism on Io
Isotopic evidence of long-lived volcanism on IoIsotopic evidence of long-lived volcanism on Io
Isotopic evidence of long-lived volcanism on Io
 
Is RISC-V ready for HPC workload? Maybe?
Is RISC-V ready for HPC workload? Maybe?Is RISC-V ready for HPC workload? Maybe?
Is RISC-V ready for HPC workload? Maybe?
 
Unlocking the Potential: Deep dive into ocean of Ceramic Magnets.pptx
Unlocking  the Potential: Deep dive into ocean of Ceramic Magnets.pptxUnlocking  the Potential: Deep dive into ocean of Ceramic Magnets.pptx
Unlocking the Potential: Deep dive into ocean of Ceramic Magnets.pptx
 
TOPIC 8 Temperature and Heat.pdf physics
TOPIC 8 Temperature and Heat.pdf physicsTOPIC 8 Temperature and Heat.pdf physics
TOPIC 8 Temperature and Heat.pdf physics
 
Neurodevelopmental disorders according to the dsm 5 tr
Neurodevelopmental disorders according to the dsm 5 trNeurodevelopmental disorders according to the dsm 5 tr
Neurodevelopmental disorders according to the dsm 5 tr
 
A relative description on Sonoporation.pdf
A relative description on Sonoporation.pdfA relative description on Sonoporation.pdf
A relative description on Sonoporation.pdf
 
PossibleEoarcheanRecordsoftheGeomagneticFieldPreservedintheIsuaSupracrustalBe...
PossibleEoarcheanRecordsoftheGeomagneticFieldPreservedintheIsuaSupracrustalBe...PossibleEoarcheanRecordsoftheGeomagneticFieldPreservedintheIsuaSupracrustalBe...
PossibleEoarcheanRecordsoftheGeomagneticFieldPreservedintheIsuaSupracrustalBe...
 
The Philosophy of Science
The Philosophy of ScienceThe Philosophy of Science
The Philosophy of Science
 
SOLUBLE PATTERN RECOGNITION RECEPTORS.pptx
SOLUBLE PATTERN RECOGNITION RECEPTORS.pptxSOLUBLE PATTERN RECOGNITION RECEPTORS.pptx
SOLUBLE PATTERN RECOGNITION RECEPTORS.pptx
 
CALL ON ➥8923113531 🔝Call Girls Kesar Bagh Lucknow best Night Fun service 🪡
CALL ON ➥8923113531 🔝Call Girls Kesar Bagh Lucknow best Night Fun service  🪡CALL ON ➥8923113531 🔝Call Girls Kesar Bagh Lucknow best Night Fun service  🪡
CALL ON ➥8923113531 🔝Call Girls Kesar Bagh Lucknow best Night Fun service 🪡
 
Boyles law module in the grade 10 science
Boyles law module in the grade 10 scienceBoyles law module in the grade 10 science
Boyles law module in the grade 10 science
 
Grafana in space: Monitoring Japan's SLIM moon lander in real time
Grafana in space: Monitoring Japan's SLIM moon lander  in real timeGrafana in space: Monitoring Japan's SLIM moon lander  in real time
Grafana in space: Monitoring Japan's SLIM moon lander in real time
 
Biopesticide (2).pptx .This slides helps to know the different types of biop...
Biopesticide (2).pptx  .This slides helps to know the different types of biop...Biopesticide (2).pptx  .This slides helps to know the different types of biop...
Biopesticide (2).pptx .This slides helps to know the different types of biop...
 
Nanoparticles synthesis and characterization​ ​
Nanoparticles synthesis and characterization​  ​Nanoparticles synthesis and characterization​  ​
Nanoparticles synthesis and characterization​ ​
 
Hubble Asteroid Hunter III. Physical properties of newly found asteroids
Hubble Asteroid Hunter III. Physical properties of newly found asteroidsHubble Asteroid Hunter III. Physical properties of newly found asteroids
Hubble Asteroid Hunter III. Physical properties of newly found asteroids
 

3-D integrated geological modeling in the Abitibi Subprovince (Québec, Canada): techniques and applications

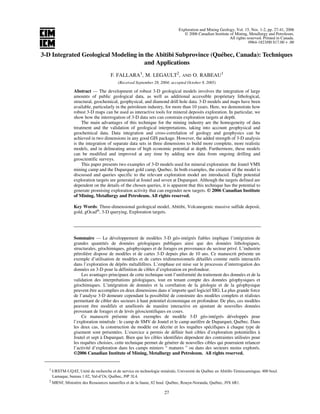
  • 1. Exploration and Mining Geology, Vol. 15, Nos. 1-2, pp. 27-41, 2006 © 2006 Canadian Institute of Mining, Metallurgy and Petroleum. All rights reserved. Printed in Canada. 0964-1823/00 $17.00 + .00 27 3-D Integrated Geological Modeling in the Abitibi Subprovince (Québec, Canada): Techniques and Applications F. FALLARA1 , M. LEGAULT2 , AND O. RABEAU1 (Received September 28, 2004; accepted October 8, 2005) Abstract — The development of robust 3-D geological models involves the integration of large amounts of public geological data, as well as additional accessible proprietary lithological, structural, geochemical, geophysical, and diamond drill hole data. 3-D models and maps have been available, particularly in the petroleum industry, for more than 10 years. Here, we demonstrate how robust 3-D maps can be used as interactive tools for mineral deposits exploration. In particular, we show how the interrogation of 3-D data sets can constrain exploration targets at depth. The main advantages of this technique for the mining industry are the homogeneity of data treatment and the validation of geological interpretations, taking into account geophysical and geochemical data. Data integration and cross-correlation of geology and geophysics can be achieved in two dimensions in any good GIS package. However, the added strength of 3-D analysis is the integration of separate data sets in three dimensions to build more complete, more realistic models, and in delineating areas of high economic potential at depth. Furthermore, these models can be modified and improved at any time by adding new data from ongoing drilling and geoscientific surveys. This paper presents two examples of 3-D models used for mineral exploration: the Joutel VMS mining camp and the Duparquet gold camp, Quebec. In both examples, the creation of the model is discussed and queries specific to the relevant exploration model are introduced. Eight potential exploration targets are generated at Joutel and seven at Duparquet. Although the targets defined are dependent on the details of the chosen queries, it is apparent that this technique has the potential to generate promising exploration activity that can engender new targets. © 2006 Canadian Institute of Mining, Metallurgy and Petroleum. All rights reserved. Key Words: Three-dimensional geological model, Abitibi, Volcanogenic massive sulfide deposit, gold, gOcad® , 3-D querying, Exploration targets. Sommaire — Le développement de modèles 3-D géo-intégrés fiables implique l’intégration de grandes quantités de données géologiques publiques ainsi que des données lithologiques, structurales, géochimiques, géophysiques et de forages en provenance du secteur privé. L’industrie pétrolière dispose de modèles et de cartes 3-D depuis plus de 10 ans. Ce manuscrit présente un exemple d’utilisation de modèles et de cartes tridimensionnels détaillés comme outils interactifs dans l’exploration de dépôts métallifères. L’emphase est mise sur le processus d’interrogation des données en 3-D pour la définition de cibles d’exploration en profondeur. Les avantages principaux de cette technique sont l’uniformité du traitement des données et de la validation des interprétations géologiques, tout en tenant compte des données géophysiques et géochimiques. L’intégration de données et la corrélation de la géologie et de la géophysique peuvent être accomplies en deux dimensions dans n’importe quel logiciel SIG. La plus grande force de l’analyse 3-D demeure cependant la possibilité de construire des modèles complets et réalistes permettant de cibler des secteurs à haut potentiel économique en profondeur. De plus, ces modèles peuvent être modifiés et améliorés de manière interactive en ajoutant de nouvelles données provenant de forages et de levés géoscientifiques en cours. Ce manuscrit présente deux exemples de modèle 3-D géo-intégrés développés pour l’exploration minérale : le camp de SMV de Joutel et le camp aurifère de Duparquet, Québec. Dans les deux cas, la construction du modèle est décrite et les requêtes spécifiques à chaque type de gisement sont présentées. L’exercice a permis de définir huit cibles d’exploration potentielles à Joutel et sept à Duparquet. Bien que les cibles identifiées dépendent des contraintes utilisées pour les requêtes choisies, cette technique permet de générer de nouvelles cibles qui pourraient relancer l’activité d’exploration dans les camps miniers “ matures ” ou dans des secteurs moins explorés. ©2006 Canadian Institute of Mining, Metallurgy and Petroleum. All rights reserved. 1 URSTM-UQAT, Unité de recherche et de service en technologie minérale, Université du Québec en Abitibi-Témiscamingue; 400 boul. Lamaque, bureau 1.02, Val-d’Or, Québec, J9P 3L4. 2 MRNF, Ministère des Ressources naturelles et de la faune, 82 boul. Québec, Rouyn-Noranda, Québec, J9X 6R1.
  • 2. 28 Exploration and Mining Geology, Vol. 15, Nos. 1-2, pp. 27-41, 2006 Introduction Recent discoveries and ongoing exploration for mineral deposits in mature mining camps within the Abitibi subprovince (e.g., Perseverance in the Matagami camp, and La Ronde 3 in the Doyon-Bouquet-La Ronde camp, Quebec; Fig. 1) have emphasized the need for integrated three- dimensional (3-D) modeling at a mining camp scale. Like many major and mid-tier mining companies (e.g., Noranda, Barrick Gold, Placer Dome, Falconbridge, Inco, Aur Resources, Cambior), the Quebec Geological Survey (MRNF) has favoured the gOcad® software as being best adapted for this type of project. In mature mining camps, the integration and the optimization of geoscientific data within a single 3-D map is likely to generate new mineral exploration targets. The development of these models involves compiling large amounts of public geoscientific data, available in Quebec through the MRNF’s database (SIGEOM), as well as additional lithological, structural, geochemical, geophysical, and drill hole data made available through private companies that are involved as project partners (Fallara et al., 2001, 2002a; Marquis et al., 2003). Since 2000, the Unité de recherche et de service en technologie minérale, Université du Québec en Abitibi- Témiscamingue (URSTM-UQAT), in close collaboration with the MRNF, has used 3-D integrated geological models of two mining camps to define base metal (Joutel) and gold (Duparquet) exploration targets. This was accomplished through the identification of extensions of alteration zones, structures, and the interpretation of subsurface geology. These projects follow the current trend in mineral exploration, which focuses on finding increasingly deep deposits within mature mining camps. Three-dimensional modeling requires a structured quantitative approach, and it is therefore necessary to have adequate, high-quality, multidisciplinary data with a relatively uniform distribution over the entire study area. Unfortunately, this kind of detail is rare in the majority of regions. In order to demonstrate the method, we have selected two areas within the Joutel volcanogenic massive sulfide (VMS) and the Duparquet gold camps where sufficient data exist to build detailed models within a regional 3-D model. 3-D Integrated Geological Models A 3-D geological modeling environment provides a single platform that uses a common 3-D coordinate system for the integration of geoscientific data. Three-dimensional modeling involves the addition of data sets to enable querying and visualization of various types of spatial data. Therefore, 3-D geological models contain quantitative geological, geophysical, and geochemical data and interpretations. Consequently, the resulting model allows the examination and querying of all the data using a single tool kit. The borders of a 3-D integrated geological model are bound by a “voxet”, which is a volume divided by a group of three-dimensional cells containing various numerical data, including: lithologies, alteration indices, diamond drill hole densities, geochemical and geophysical surveys, and certain point-source petrophysical data (rock density, magnetic susceptibility, etc.). Figure 2 shows sections through a voxet exposing different types of numerical data. Hence, 3-D integrated geological models represent a dynamic data integration method of great utility as an exploration targeting tool that can be questioned according to criteria reflecting the geological properties associated with various mineral deposits. The main advantages of such a technique for the mining industry is the homogeneity of data treatment and the ability to refine and validate geological interpretations taking into account geophysical and geochemical data. Data integration and cross-correlation of geology, geophysics, and geochemistry can be achieved in two dimensions in any good GIS package. However, the added strength of 3-D analysis is the integration of data sets in three dimensions to build more complete, realistic models that can be used to delineate areas of high economic potential at depth. Furthermore, these models can be modified and improved at any time by adding new data from ongoing drilling and mapping surveys. Methodology for 3-D Integrated Geological Model Construction The type of data integrated within a 3-D model depends on data availability, density, and distribution, as well as project objectives and working scale. The methodology presented here is well suited for various working scales (from ore-body scale through camp scale, and even up to regional scale). It is particularly suited and most useful for camp-scale or regional synthesis to constrain structural and stratigraphic relationships of a studied area. For exploration targeting, the following data are useful: 1. Surface data (2-D): i. Topographic elements (digital elevation models, hydrography); ii. Mining and road infrastructure; iii. Main lithological and stratigraphical contacts (key horizons marker); iv. Fault and fold surfaces, planar and linear structural measurements; v. Lithogeochemical analyses, alteration indices, and economic assays. 2. Diamond drill hole (DDH) information available in 3-D: i. Drilling data (collar, deviation, geology, mineralized intersections, alteration indexes, magnetic susceptibility, density, etc.). 3. Ground-based, downhole, and airborne geophysical surveys: i. Magnetic data; ii. Gravimetric data; iii. Electric methods (DC, IP); iv. Borehole EM;
  • 3. 3-D Modeling in the Abitibi Subprovince (Quebec, Canada) • F. FALLARA ET AL. 29 Fig.1.SimplifiedgeologyoftheAbitibisubprovince,showingthelocationsoftheJoutelandDuparquetstudyareas.ModifiedfromDoucetetal.(2000).
  • 4. 30 Exploration and Mining Geology, Vol. 15, Nos. 1-2, pp. 27-41, 2006 Fig. 2. (a) General steps involved in constructing 3-D integrated geological models (after Fallara et al., 2002b). (b) Generalized model: a unified platform that contains quantitative geological, geophysical, and geochemical data.
  • 5. 3-D Modeling in the Abitibi Subprovince (Quebec, Canada) • F. FALLARA ET AL. 31 v. Seismic data. The UML (Unified Modeling Language) flowchart illustrates the steps to accomplish a task; the Fowler (2000) flowchart highlights stages requiring a decision, as opposed to those needing parallel treatments in substages. Figure 2a outlines the construction steps of 3-D integrated geological models as defined by Fallara et al. (2002b): 1. Data handling steps: a. Acquisition and compilation of the data (allowing for rigorous quality control): i. Compilation of geological information, such as outcrop, contacts, structures, mine plans, DDH; ii. Compilation of geophysical information, such as airborne and ground magnetic, and gravimetric surveys; iii. Digitization of paper documents (i.e., sections) and their integration and validation with numerical data; iv. Standardization of the lithological units; v. Structuring of data files for importation into gOcad® . b. Importation and integration steps: i. Importation of digital elevation points to create the topographic surface; ii. Integration of regional infrastructure and hydrographical network: the numerical data are imported into gOcad® and are then draped on the topographic surface; iii. Integration of the 2-D geological data: importation into gOcad® of outcrop, mineralized zones (data points), and geological contacts in AutoCAD® (.dxf) format; iv. Diamond drill hole (DDH) importation. 2. Construction steps: a. Interpretation, construction, and integration of regional sections used for the homogenization and the simplification of the regional geological contacts. The number of necessary sections depends on the complexity of the units to be constructed. b. Geological surfaces are built from both the contact curves and dip vectors extracted from the surface geological map and sections. 3. Interpretation and validation steps: a. Validation of the 3-D geological surfaces: major DDH markers are used as additional control elements between the regional interpreted sections. Surfaces are modified in order to account for these additional constraints. b. Creation of 3-D geological regions: these are geological volumes bounded by the 3-D geological surfaces. c. Validation of the 3-D geological model using unconstrained and constrained 3-D geophysical inversions according to quantitative relationships between geological data and geophysical data: the differences between the two models are adjusted in iterative and interactive processes. 4. Querying steps: a. Selection of 3-D properties: lithology, alteration indexes, assays, etc., are then allotted to each cell of the voxet according to the region to which they belong. b. Elaboration of 3-D properties according to the selected metallogenic environment (VMS, gold, etc.) in order to define queries that may lead to new exploration targets. Three-dimensional integrated geological modeling cannot be defined and followed like a cookbook recipe: each project or study area requires a different approach based on the objectives and the available databases. Therefore, while these steps ensured the success of the 3-D integrated geological models at our specific study sites, they should not be thought of as a standard, but rather as guides that other users can follow or modify. Joutel Study Area Geological Setting The Joutel volcanic complex (JVC) contains VMS deposits that produced Zn, Cu, Ag, and Au from massive sulfide deposits from 1966 to 1975, and semi-massive sulfide deposits from 1974 to 1993. The JVC (2728–2721 Ma; Mortensen, 1993; Legault et al., 2002) is an integral part of the first volcanic cycle (2730–2720 Ma) of the Northern Volcanic Zone (NVZ) of the Abitibi subprovince (Fig. 1), which represents an extensive, subaqueous, primitive basalt plain with dispersed mafic/felsic and felsic complexes collectively defining a diffuse and incipient arc (Chown et al., 1992). The 5- to 7-km-thick JVC, traceable for 25 km along strike (Legault et al., 2002), comprises the Joutel-Raymond and Harricana groups (Legault et al., 2000; Fig. 3). The Joutel-Raymond Group consists of a basal mafic volcanic sequence (Valrennes Formation) overlain by mafic to felsic volcanic and volcaniclastic rocks (Joutel Formation), whereas the Harricana Group is a minor but significant volcaniclastic sedimentary unit (Legault et al., 2002). The Joutel Formation is further subdivided into the Poirier (primarily lobe- hyaloclastite felsic flows), Kistabiche, and Eagle (predominantly mafic to felsic tuffs) members. VMS deposits are only found within the Poirier member, whereas gold deposits are located within the Harricana Group. Three major intrusions are present in the JVC area (Legault et al., 2002): the Valrennes intrusion, Mistaouac pluton, and Joutel tonalite. The Valrennes intrusion is a syn- volcanic (2728 Ma; Legault et al., 2002), 4-km-thick, shallow-level, mafic-ultramafic sill that has been mapped over a 20-km strike length (Dubé, 1993; Legault et al., 2000). It is mostly composed of diorite, quartz diorite, gabbro, quartz gabbro, and hornblendite, with local magmatic layering at its base. It is interpreted to have been the heat
  • 6. 32 Exploration and Mining Geology, Vol. 15, Nos. 1-2, pp. 27-41, 2006 source for hydrothermal convection cells responsible for the VMS deposits (Legault et al., 2002). The roughly circular Mistaouac pluton (2726 ± 2 Ma; Davis et al., 1993) covers about 2,500 km2 , is mostly of tonalitic composition, and is interpreted as a deep-level intrusion (~10 km depth; Chown et al., 2002). The Joutel tonalite represents a younger assemblage of dikes and sills (2721 Ma; Legault et al., 2002) that crosscut the Valrennes intrusion and the Poirier member (Legault et al., 2002). Joutel Mining Camp The Joutel mining camp (Fig. 3) contains Zn-Cu-Ag deposits (Poirier, Joutel copper, and Explo-Zinc) and Au-Ag deposits (Eagle and Telbel). Three-dimensional geological modeling was focused on the VMS deposits. Lacroix (1998) estimated combined production and reserve inventories of more than 215,000 tonnes of Zn and 148,000 tonnes of Cu within the camp. The Joutel copper deposit lies in the lower portion of the Poirier member in the hinge area of the McClure-Plamondon anticline (Fig. 3; Dubé, 1993). Chloritic stringer zones underlie massive sulfide beds on both fold limbs (Legault et al., 2002). The orebody is composed of several folded and moderately dipping sulfide lenses, hosted by intensely chloritized and locally talcose rhyolite breccias with spherulitic and cherty rhyolite (Legault et al., 2002). The Joutel tonalite crosscuts the Joutel copper deposit at depth at a 30° to 40° angle (Jébrak, 2000). The sulfide lenses at the Poirier deposit are also found in the lower portion of the Poirier member (Legault et al., 2002) and are hosted by strongly chloritized volcaniclastic rocks with a sericitic halo (Piché, 2000). The orebody has been interpreted as a V-shaped fold with distinct copper-rich zones along the northern limb near the contact with the Joutel tonalite, and zinc-rich zones to the south (Boniwell and Dujardin, 1964). This metal zonation substantiates geological observations that suggest stratigraphy tops to the south (Legault et al., 2002). Detailed mineralogical studies indicate that the Te-Co- Ag-Pb-rich composition and chlorite alteration (pipe zonation and coexistence of Mg-rich and Fe-rich chlorites; Legault et al., 2002) of the Zn-Cu-Ag VMS deposits of the JVC are similar to those of the Matagami mining camp (Noranda- type), which is believed to have formed in a deep-water environment (Franklin, 1996). However, Legault et al. (2002) observed that characteristics such as the presence of intense iron carbonate alteration and stromatolite fragments suggest Fig. 3. Simplified geological map of the Joutel mining camp. MPA = McClure-Plamondon Anticline. Modified from Legault et al. (2002).
  • 7. 3-D Modeling in the Abitibi Subprovince (Quebec, Canada) • F. FALLARA ET AL. 33 similarities with shallow-water Mattabi-type deposits (Morton and Franklin, 1987). The carbonate alteration is restricted to upper portions of the Poirier member, as well as Kistabiche and Eagle members, and the stromatolite fragments are found within Kistabiche tuffs only (Legault et al., 2002). The studies of Legault et al. (2002) can be consulted for complete information regarding the deformation and metamorphic history of the region or the camp, and how this may have modified the position and signature of the syn- volcanic VMS mineralization. Duparquet Study Area Geological Setting The Duparquet area, situated along the Destor-Porcupine fault (DPF), was a gold producer from 1933 to 1956 (Beattie, Donchester, Central Duparquet, and Duquesne mines) and from 1983 to 1990 (Duquesne and Yvan Vezina-Davangus mines). The geology of the DPF area consists of an Archean volcano-sedimentary assemblage divided into three volcanic and two sedimentary groups (Fig. 4; Goutier and Lacroix, 1992). The base of the sequence consists of felsic to ultramafic volcanic rocks of the Kinojévis group (2722–2718 Ma; Barrie, 1999; Zhang et al., 1993), Hébécourt Formation (2706–2701 Ma; Corfu and Noble, 1992), and Blake River group (2698 Ma; Mortensen, 1993). Rocks of the Kewagama group (2686–2684 Ma; Davis, 2002) are younger than the volcanic rocks, and are interpreted as turbiditic sediments deposited in deep basins. The Timiskaming group (<2682 Ma; Mueller et al., 1996) is the youngest stratigraphic unit in the area, and consists of coarse, polygenic, unsorted sedimentary rocks deposited in an alluvial-fluvial environment. At several locations, the Timiskaming is in angular unconformity with deformed volcanic rocks. Numerous felsic to ultramafic intrusions crosscut the region. The eastern part of the study area distinguishes itself from the western sector by an increase in geological complexity and a shallower structural level of exposure (Fig. 4b; Goutier and Lacroix, 1992). This factor has favoured the preservation of felsic porphyritic intrusions of calc-alkaline (2689 ± 3 Ma; Mueller et al., 1996) to alkaline affinities (2682 ± 1 Ma; Mueller et al., 1996), as well as an important accumulation of Timiskaming sedimentary rocks (Duparquet Formation; Rocheleau, 1980; Mueller et al., 1991). Many E– W faults are present in the eastern sector where they crosscut most of the lithologies. These faults are not necessarily subsidiaries to the DPF, because it can be demonstrated that certain faults are clearly prior to or contemporaneous with the formation of the Duparquet basin (Goutier and Lacroix, 1992). An intense ENE–WSW to E–W schistosity is associated with the DPF and the E–W faults, but is only locally developed elsewhere in the area. Duparquet Mining Camp Several gold showings and deposits straddle the DPF (Fig. 4c), although little gold has been extracted from the Quebec portion of the DPF (~78 t Au production and resources) compared to the Ontario side (>2,400 t Au production and resources; Legault et al., 2004). An ongoing regional metallogenic study by the Quebec Geological Survey (MRNF) has identified seven main types of gold mineralization along the DPF, each showing a distinct style, alteration, control, metal content, and timing (Legault et al., 2003, 2004). They are: sulfides associated with VMS, epithermal veins, quartz-carbonate veins, silver-rich quartz veins, disseminated sulfides associated with leaching, and disseminated sulfides associated with intrusions. The latter type has been subdivided into two subtypes based on the composition of the intrusions: alkalic and calc-alkalic. Most of the gold-bearing mineralization shows a close genetic relationship with pyrite and sericite alteration, whereas the correlation between gold and carbonates is not as straightforward (Legault et al., 2003). Compilation of the gold deposits and showings has shown that gold was deposited at different depths and also at different stages in the geological evolution of the area. Of the seven types of gold mineralization identified to date, only quartz-carbonate veins and disseminated sulfides associated with alkalic intrusions appear to have the potential to host economic deposits. The other mineralization types are either too small, or the gold concentrations are too low or erratic. The studies of Legault et al. (2003, 2004) can be consulted for complete information regarding mineralization history of the region. 3-D Geological Modeling Applied to Exploration Targeting General Issues When 3-D integrated geological models are completed, the chosen properties are interpolated (i.e., interpolation is an estimation of a value within two known values in a sequence of values) for every cell of the voxet. These cells can contain information concerning the various lithologies, the alteration indices, drill hole density and spatial distribution, and geochemical and geophysical properties. The completed 3-D integrated geological model is a dynamic exploration tool that can be questioned according to criteria reflecting the geological properties associated with various mineral deposits. These interrogations or “queries” allow the user to define the relationship between chosen properties within a specific model, and to define 3-D zones of high economic potential. These queries can include different criteria depending on the metallogenic environment (i.e., distance to key marker horizons or faults, geochemical and geophysical thresholds, rheological constraints, etc.). Results from both the Joutel and Duparquet 3-D models are presented below. They illustrate the importance of carefully defining the parameters used in order to maximize
  • 8. 34 Exploration and Mining Geology, Vol. 15, Nos. 1-2, pp. 27-41, 2006 Fig.4.(a)SimplifiedgeologicalmapalongtheDestor-PorcupinefaultfromLegaultetal.(2003).(b)SimplifiedgeologicalmapoftheDuparquetminingcamp.ModifiedfromLegault etal.(2003).(c)GoldshowingsanddepositsdistributionalongtheQuebec-OntarioDPF(forsymbollegendseefigure1).
  • 9. 3-D Modeling in the Abitibi Subprovince (Quebec, Canada) • F. FALLARA ET AL. 35 the chances of defining targets corresponding to new mineralized zones. Each parameter definition, within a query, is the result of iterative and interactive (i.e., trial and error) processes. Joutel VMS Mining Camp Example Construction Steps The 3-D integrated geological model was built first at a 1:20,000 regional scale (18 × 13.5 km, and 2 km vertical depth). The regional-scale 3-D model of Joutel contains a total of 27 lithological surfaces and two faulted surfaces for a total of 34 closed geological bodies (regions) formed by 50 × 50 × 25-m cells, creating a voxet with a total of 7.8 million cells. For the Joutel VMS camp-scale 3-D model, a smaller voxet was built to focus on an area with a higher abundance of data, and also to characterize in detail the VMS deposits that were defined regionally to have typical alteration patterns associated with Noranda-type deposits (i.e., chlorite alteration centered on the deposit with a halo of sericite alteration; Piché, 2000). The smaller and more detailed VMS model (Fig. 3; 9 × 4 km, 1 km vertical depth, 25 × 15 × 15 m cells) included: (a) data from 1,500 diamond drill holes; (b) 12,697 metallic assays; (c) 1,691 lithogeochemical analysis; and (d) calculated Normat® alteration indexes (Piché, 1999; Piché and Jébrak, 2004). Exploration Criteria (JVC) When the Joutel VMS model was completed, interpolations and queries were done using the geochemical data, based on metallogenic criteria proposed by Piché (2000) to define VMS targets. The choices of constraints used within our VMS queries computed in gOcad® are presented on a UML flowchart (Fig. 5): a. Initially, areas of high heat flow had to be identified because they are responsible for the hydrothermal activ- ity that produces VMS deposits. In fact, statistical stud- ies within the Abitibi subprovince have shown that VMS deposits tend to be located at certain distances from syn- volcanic plutons: <1.5 km, or 4 to 5 km (S. Faure, pers. commun., 2001). Thus, regions within the VMS voxet with these specific distances to the Valrennes intrusion were extracted. b. Typical VMS deposits are underwater layers within vol- canic centers produced by hydrothermal activity during long periods of volcanic hiatus. Therefore, the identifica- tion of zones with economic potential necessitated the extraction of particular volcanic geological contacts (e.g., basalt–rhyolite). Hence, regions within the VMS voxet that contained both the felsic Poirier and the inter- mediate Kistabiche members were selected from the model. c. A distance of between 250 and 750 m to existing dia- mond drill holes was used as an additional constraint to avoid creating mathematical artefacts such as border effects along the edges of the voxet, and finding known economic zones. d. A distance of up to 1,500 m to identified synvolcanic faults was the next constraint to refine new economic zones. e. Altered zones were then identified and subdivided into: (a) zones of hydrothermal fluid recharge; that is, where fluids that circulated in the identified regions leached out metallic elements (Cu, Zn, Pb, Ag, Au), sulfur, Fe, and Mg, leaving a rock rich in Si-Al (i.e., quartz-epidote); and (b) discharge zones for hydrothermal fluids where VMS deposits usually form. These latter zones are dis- cordant, leached of alkalis, and enriched in chlorite- sericite, Fe, Mg, and K, as well as metallic elements These constraints allowed identification of the hydro- thermal fluid activity signatures potentially responsible for the formation of VMS type deposits. Normative alter- ation indices (Piché, 2000; Piché and Jébrak, 2004), pre- sented in Table 1, were used to infer the location of these Fig. 5. Queries computed in gOcad® represented on UML flowchart for the Joutel VMS mining camp.
  • 10. 36 Exploration and Mining Geology, Vol. 15, Nos. 1-2, pp. 27-41, 2006 discharge zones. Table 2 illustrates the minimum and maximum values within the Joutel VMS mining camp, as well as the thresholds (defined by the 75th percentile) used within the VMS 3-D queries. These values are com- pared to percentile values for the Abitibi, compiled by Descarreaux (2000) from ~55,000 greenstone belt sam- ples (Table 2). In summary, a combination of high heat flow, hydrothermal plumbing and conduits, stratigraphic controls, and direct evidence of hydrothermal activity was used to obtain typical VMS constraints used in for 3-D VMS targeting (Fig. 6). Duparquet Gold Mining Camp Example Construction Steps A 3-D model for the Duparquet camp was built at a regional scale (11.4 × 4.0 × 1.0 km) integrating all of the geoscientific data. It contains 74 lithological surfaces and 77 faulted surfaces for a total of 126 closed geological bodies (regions) formed by 20 m3 cells, creating a voxet with a total of 5.7 million cells. The data set imported into the 3-D model included 1,746 diamond drill holes, which contained 50,348 Au assays and 3,638 lithogeochemical analyses. The model was used to define 3-D gold distribution from available diamond drill hole data and to establish queries in order to propose new exploration targets. A smaller voxet named Shaft (4.32 × 1.57 km; Fig. 4), with 10 m3 cells, was built to focus on an area with a higher concentration of data and to characterize in detail the gold isosurfaces that were defined regionally. Exploration Criteria (DP) For gold exploration, the integration methodology of the data remains the same as the VMS model, except that the constraints used for queries (deformation zones, ankerite alteration, lithological contacts, etc.) differ from 3-D VMS targeting. Because gold targets are usually much smaller than VMS targets, a higher density of data is needed in order to explore efficiently at the same scale. When the DP model was completed, interpolations and queries were done using the style of mineralization at the Holloway and Holt-McDermott deposits (approximately 17 km west of the Ontario-Quebec border along the DPF; Fig. 1). These mines strongly influenced the exploration approach of Legault et al. (2004) within the DP model area, because it is likely to have similar characteristics to these two producers. The choices of constraints used within our gold- bearing queries computed in gOcad® are presented on a UML flowchart (Fig. 7): a. Proximal to the DPF, most of producing Au deposits are within 200 m of E–W faults. Thus, our first query extracts the regions close to E–W faults. The F39 fault (Fig. 4B) is a reference surface that establishes a link between the regional- and camp-scale models. b. Most Au deposits along the DPF are hosted within units with a FeO to MgO ratio greater than 3 (i.e., units with high Fe concentration are usually favourable for gold precipitation). Thus, our second query extracts those spe- cific host rocks having a high Fe/Mg ratio. c. The Holloway and Holt-McDermott deposits show intense albitization spatially associated with significant gold concentrations and located in the center of wall- rock alteration halos of sericite and carbonate. Such alteration, however, is rarely observed in the DP model region (Legault et al., 2004). At the Holloway deposit, albitization and economic gold values begin at a depth of approximately 300 m (Ropchan et al., 2002). At shal- lower depths, only sericitization and carbonatization are present, suggesting that the highly sericitized structures should be explored at greater depths. This third query keeps regions with high levels of sericite-paragonite (>40 vol.%) alteration or normative carbonate (>10 vol.%; Fig. 8; calculated using the procedure of Piché, 1999, and Piché and Jébrak 2004). d. The exploration targets are defined in areas located at more than 250 meters from a diamond drill hole (to avoid finding known deposits). e. Remaining regions with extrapolated gold values higher than 50 ppb. Borders of the Duparquet basin are the locus of known gold deposits along the DPF, containing about 87% of identified gold. Within the DP model area, exploration was focused on the DPF (Fig. 4) and some of the subsidiary structures (e.g., the Duquesne fault; Fig. 4). Little exploration has been done on subsidiary faults bordering the basin, such as the Ottman and Lepine faults (Fig. 4), despite the presence of significant alteration zones of carbonate and sericite. With the exception of a few sectors (Beattie, Shaft, Duquesne; Legault et al., 2004), little exploration has been undertaken at depths greater than 500 m. The environment of the eastern part of the DPF differs from that of the western part (Timmins sector, Ontario) by exhibiting a shallower structural level. Legault et al. (2004) suggested that the lack of gold on the Quebec side is possibly associated with its epizonal position as illustrated by the presence of epithermal mineralization. Economic mineralization may occur at greater depth in the DPF, a possibility that has been little tested to date. Limitations of 3-D Integrated Geological Models Even though 3-D models are robust and can be used as interactive exploration tools for mineral exploration, it is important to be aware of their limitations. Primary limitations are caused by uncertainties that are propagated throughout the model. The main sources of uncertainties that influence 3-D models are: a. Data distribution: Irregular or sparse data distribution can result in less meaningful regional interpolated values. In fact, the
  • 11. 3-D Modeling in the Abitibi Subprovince (Quebec, Canada) • F. FALLARA ET AL. 37 wider apart the known values are, the more difficult and less precise it becomes to estimate what lies between them. b. Interpolation method: The resulting value varies, depending on the chosen interpolation method (e.g., less subjective for alteration zonation and trend definition). c. Geophysical inversion methods (unconstrained and constrained): Geophysical data sets can be used to construct 3-D models and these can help a great deal in validating the geological model; that is, applied geophysical inversions can help constrain the depth extent and dip of specific structures and lithologies. 3-D constrained data inversion can be used as a tool to complement the 3-D initial construction steps. Inversion methods provide a more robust and quantitative solution (Perron et al., 2005). d. Chosen criteria or constraints: A wide variance of results can be obtained by choosing different queries because the user’s subjectivity is involved. For example, if there were twice as many syn-volcanic faults interpreted there would be twice as many 3-D VMS targets. If a user chooses a different distance to syn-volcanic plutons in the JVC, or introduces a query related to proximity to Timiskaming sediments in the DP model, then the targets would be quite different. This illustrates the point that the user’s interests and perception of the metallogenic model greatly influence the results obtained. It is important to note that data density is one of the most crucial factors in generating targets. Bringing these limitations into the discussion does not detract from the effectiveness of the tool, but actually creates more opportunities to try different geological parameters. Conclusions The goal of this paper is to promote the use of 3-D modeling in search of various types of ore deposits: this approach could be applied anywhere in the world. The integration of geoscientific data within a single 3-D model, and the ability to display and query these data, are significant advances for mineral exploration. The multidisciplinary approach used in 3-D integrated geological Table 1. Normative Alteration Indices Defined Specifically for VMS Deposits Notes Proposed by Piché (2000). Table 2. Minimum and Maximum Values Within the Jotel VMS Mining Camp and Their Thresholds* Used Within the VMS 3-D Queries Notes *Defined with the 75th percentile. Normative Alteration Index Description MIN.FRAIS Albite + Actinolite + Epidote + Orthoclase + Tremolite + Titanite MIN.ALT Hydrothermal (Paragonite + Pyrophyllite + Sericite+ Chlorite + Diaspore) IFRAIS MIN. FRAIS * 100 / (MIN.FRAIS + MIN.ALT) IPARA Hydrothermal Paragonite * 100/ (MIN. FRAIS + MIN. ALT) ISER Hydrothermal Sericite * 100 / (MIN. FRAIS + MIN. ALT) ICHLO Hydrothermal Chlorite * 100 / (MIN. FRAIS + MIN. ALT) IPYRO Hydrothermal Pyrophyllite * 100 / (MIN. FRAIS + MIN. ALT) ISERPAR Hydrothermal Paragonite + Sericite * 100 / (MIN. FRAIS + MIN. ALT) ICHLOPYR Hydrothermal Chlorite + Pyrophyllite * 100 / (MIN. FRAIS + MIN. ALT) Alteration Index Joutel VMS Mining Camp Min. Values Joutel VMS Mining Camp Max. Values Joutel VMS Mining Camp 75th Percentile Abitibi** 75th Percentile Abitibi** 90th Percentile IFRAIS 0 100.00 75.74 73.66 35.58 IPARA 0 76.19 18.50 14.96 25.49 ISER 0 82.19 25.27 5.39 22.96 ICHLO 0 93.87 32.00 0.0003 0.0004 IPYRO 0 28.63 0.75 0.0003 0.0004 ISERPAR 0 94.11 41.61 24.29 48.6 ICHLOPYR 0 97.46 33.13 N/A N/A ISHIKAWA 9.39 99.86 61.87 N/A N/A Cu (%) 0 29.40 0.68 N/A N/A Pb (%) 0 12.75 1.44 N/A N/A Zn (%) 0 44.30 0.28 N/A N/A magsus_hs 1.635 × 10⁻⁵ 0.06 0.005 N/A N/A
  • 12. 38 Exploration and Mining Geology, Vol. 15, Nos. 1-2, pp. 27-41, 2006
  • 13. 3-D Modeling in the Abitibi Subprovince (Quebec, Canada) • F. FALLARA ET AL. 39 Fig. 7. Queries computed in gOcad® represented on UML flowchart for the Duparquet gold mining camp (orthose = orthoclase). Fig. 6 (previous page). 3-D integrated geological model of the Joutel VMS mining camp applied to exploration targeting: (a) The final 3- D model of Joutel contains a total of 27 lithological surfaces and two faulted surfaces (F1 and F2) for a total of 34 closed geological bodies (regions) formed by 50 × 50 × 25 m cells, creating a voxet with a total of 7.8 million cells. (b) Extraction of regions within a defined distance to synvolcanic plutons. (c) Extraction of regions within the Poirier and the Kistabiche members. (d) Extraction of regions within a defined distance to diamond drill holes. (e) Extraction of regions within a defined distance to synvolcanic fractures or faults. (f) Identification of altered zones within the above extracted regions. (g) Identification of zones favorable for metal precipitation within the above extracted regions. Final targets resulting from the intersection of the altered zones and the zones rich in metals (B∩A; Figure 5).
  • 14. 40 Exploration and Mining Geology, Vol. 15, Nos. 1-2, pp. 27-41, 2006 Fig. 8. 3-D integrated geological model of the Duparquet gold mining camp applied to exploration targeting: (a) The final 3-D model of Duparquet contains a total of 74 lithological surfaces and 77 faulted surfaces for a total of 126 closed geological bodies (regions) formed by 20 m3 cells, creating a voxet with a total of 5.7 million cells. (b) The query is refined by choosing areas near first- and second-order E–W faults. (c) Extraction of regions with high Fe/Mg ratio. (d) Extraction of regions having either high levels of sericite-paragonite or normative carbonate alteration. (e) Regions are then extracted within areas located modeling demonstrates that this method can be used as a regional interactive exploration tool, allowing the use of various criteria to constrain and refine queries, and lead to the definition of exploration targets. The generation of 3-D integrated geological models of mature mining camps in the Abitibi subprovince produces refined geological syntheses and new exploration targets for deep exploration programs. Many exploration projects with a solid basis in quantitative geology are being elaborated in Quebec’s principal mining region (Abitibi), and strong partnerships between the URSTM-UQAT, the MRNF, and major exploration companies are also being developed. The models benefit from continuous validation and upgrading of the underlying database, as well as the production of regional syntheses, integrating geological, geophysical, and geochemical models in a single platform. For geological working teams, the main advantages of using 3-D integrated geological models are to: 1. Share the information: a. Conveys the data and their interpretation in a format that is accessible to all. b. Avoids loss of knowledge and interpretations that may be: • Distributed across various places within the company; • Filed in disorganized ways; • Never filed and existing only in employee’s memory. 2. Catalyze the development of knowledge: a. Easily integrates data under a common format; b. Preserves data in a unique archiving platform where it can easily be shared, seen, and analyzed. 3. Resolve problems with the entire team:
  • 15. 3-D Modeling in the Abitibi Subprovince (Quebec, Canada) • F. FALLARA ET AL. 41 a. Adaptable to team-driven problem resolution; b. Easy access to information for all team members, collaborators, and stakeholders; allows a shared comprehension of the data. 3. Accelerate the process of data integration and interpretation: a. Defines new targets with reduced uncertainty; b. Focuses the work on data interpretation: optimizes data subsets with the help of an integrating tool. 3. Direct access to data and data manipulation within the gOcad® software: a. Queries the 3-D integrated geological model. b. Saves time: rapidly validates the data and resolves uncertainties. The natural outgrowth of these 3-D geological models would be their extrapolation away from mining camps with large amounts of data to more remote areas with less data. The development of a more rigorous geostatistical approach for data interpolation throughout the model and its application to the query definition would better identify possible 3-D targets. Acknowledgments The authors would like to acknowledge J. Jobidon for the graphical design of our gOcad® images; R. McLeod and G. Morin for their computer and technical support throughout the project; G. Boudrias, P. Lévesque, J. Pettigrew, and M. Sarault for the compilation of data; C. Dion, Y. Lei, M. Piché, R. Marquis, and J. Stock for their geological consulting work; and G. Perron, V. Laflèche, J. McGaughey, and C. Williston for 3-D consultation. J. Moorhead, P. Rhéaume, L. Martin, and E. de Kemp are thanked for their critical reading of an early draft of the manuscript, and K.F. Cassidy and T. Setterfield are thanked for their formal reviews. This paper is MRNF contribution number 2004-5130-04. References Barrie, C.T., 1999, The Kidd-Munro extension project: Year 3 report: Soumis à l’Ontario Geological Survey, internal report, 263 p. Boniwell, B., and Dujardin, A., 1964, Discovery and exploration of the Poirier ore deposit: Canadian Mining and Metallurgical Bulletin, v. 57, p. 945–952. Chown, E.H., Daigneault, R., Mueller, W., and Mortensen, J.K., 1992, Tectonic evolution of the northern volcanic zone, Abitibi belt, Quebec: Canadian Journal of Earth Sciences, v. 29, p. 2211–2225. Chown, E.H., Harrap, R., and Moukhsil, A., 2002, The role of granitic intrusions in the evolution of the Abitibi belt, Canada: Precambrian Research, v. 115, p. 291–310. Corfu, F., and Noble, S., 1992, Genesis of the southern Abitibi greenstone belt, Superior province, Canada: Evidence from Zircon Hf isotope analyses using a single filament technique: Geochimica et Cosmochimica Acta, v. 56, p. 2081–2097. Davis, D., 2002, U-Pb geochronology of Archean metasedimentary rocks in the Pontiac and Abitibi subprovinces, Quebec, contraints on timing, provenance and regional tectonics: Precambrian Research, v. 115, p. 97–117. Davis, W.J., Machado, N., and Gariépy, C., 1993, U-Pb geochronology of plutonic rocks along LITHOPROBE Line 28, northern Abitibi subprovince: LITHOPROBE Abitibi-Grenville Project, report 33, p. 145–147. Descarreaux, J., 2000, Banque de données lithogéochimiques: internal report, 1 p. Doucet, P., Goutier, J., Melançon, M., and Ste-Croix, L., 2000, L’Abitibi: Un centenaire d’exploration et de succès minier: Ministère des Ressources naturelles, faune et parcs, Québec, DV 2000-03, p. 44. Dubé, L.M., 1993, Géologie de la région de Joutel (Abitibi): Ministère de l’Énergie et des Ressources, Québec, ET 90-12, 61 p. Fallara, F., Perron, G., and Williston, C., 2001, Modélisation régionale 3-D géo-intégré: Phase 1, Camp minier de Joutel, Abitibi (Québec): Ministère des Ressources naturelles, faune et parcs, Québec, PRO-2001-11, CD. Fallara, F., Perron, G., and Williston, C., 2002a, 3-D Regional common-earth modeling: Pahe 1, Joutel Mining Camp, Abitibi (Québec): Ministère des Ressources naturelles, faune et parcs, Québec, PRO- 2002-01, CD. Fallara, F., Bois, D., Perron, G., and Marquis, R., 2002b, Modélisation 3-D géo-intégrée gOcad® : Détermination des paramètres de faisabilité pour la modélisation régionale, Rapport de faisabilité interne, 66 p. Fowler, M., 2000, UML Distilled, 2nd ed.: Addison-Wesley Longman Inc., Boston, 185 p. Franklin, J.M., 1996, Gîtes de sulfures massifs à métaux communs associés à des roches volcaniques, in Eckstrand, O.R., Sinclair, W.D., and Thorpe, R.I., eds., Géologie des types de gîtes minéraux du Canada, v. 8, p. 174–202. Goutier, J., and Lacroix, S., 1992, Géologie du secteur de la Faille de Porcupine-Destor dans les cantons de Destor et Duparquet: Ministère de l’Énergie et des Ressources, Québec, MB 92-06, 66 p., 2 maps, scale 1:20,000. Jébrak, M., 2000, Le pluton de Joutel: Études pétrologique et métallogénique de la région de Joutel, Sous-province de l’Abitibi: Ministère des Ressources naturelles du Québec, MB 2000-11, p. 4–17. Lacroix, S., 1998, Compilation et répartition des gisements polymétalliques à tonnage évalué dans la Sous-province de l’Abitibi: Ministère des Ressources naturelles du Québec, MB 98-06, 29 p. Legault, M., Daigneault, R., Mueller, W., Gauthier, M., Jébrak, M., and Piché, M., 2000, Contexte géologique du camp minier de Joutel: Ministère des Ressources naturelles, faune et parc, Québec, MB 2000-10, 45 p.
  • 16. 42 Exploration and Mining Geology, Vol. 15, Nos. 1-2, pp. 27-41, 2006 Legault, M., Gauthier, M., Jébrak, M., Davis, D.W., and Baillargeon, F., 2002, Evolution of the subaqueous to near-emergent Joutel volcanic complex, northern volcanic zone, Abitibi subprovince, Quebec, Canada: Precambrian Research, v. 115, p. 187–221. Legault, M., Fallara, F., Cheng, L.Z., Beaudoin, G., Goutier, J., Perron, G., Rabeau, O., and Aucoin, M., 2003, A new look at an old mining camp: The Destor-Porcupine fault, Abitibi subprovince (phase 2): Ministère des Ressources Naturelles, faune et parc, Québec, DV 2003-08, p. 116. Legault, M., Fallara, F., Cheng, L.Z., Beaudoin, G., Goutier, J., Perron, G., Rabeau, O., and Aucoin, M., 2004, Synthèse métallogénique et modélisation 3-D de la Faille de Porcupine-Destor dans le secteur de Duparquet, sous- province de l’Abitibi (phase 2/3): Ministère des Ressources Naturelles, faune et parc, Québec, RP 2004- 07, 15 p. Marquis, R., McGaughey, J., and Bois, D., 2003, Quantitative geology using 3-D common-earth modeling, in PDAC Open Session: New opportunities in familiar places: PDAC, Toronto, Ontario, 5 p. Mortensen, J.K., 1993, U-Pb geochronology of the eastern Abitibi subprovince, Part 1: Noranda-Kirkland Lake area: Canadian Journal of Earth Sciences, v. 30, p. 29– 41. Morton, R.L., and Franklin, J.M., 1987, Two-fold classification of Archean volcanic-associated massive sulfide deposits: Economic Geology, v. 82, p. 1057– 1063. Mueller, W., Donaldson, J.A., Dufresne, D., and Rocheleau, M., 1991, The Duparquet Formation: Sedimentation in a late Archean successor basin, Abitibi greenstone belt, Quebec, Canada: Canadian Journal of Earth Sciences, v. 28, p.1394–1406. Mueller, W.U., Daigneault, R., Mortensen, J., and Chown, E., 1996, Archean terrane docking: Upper crust collision tectonics, Abitibi greenstone belt, Quebec, Canada: Tectonophysics, v. 265, p. 127–150. Perron, G., McGaughey, J., Fullagar, P., and Pears., G., 2005, 3-D gravity and magnetic inversion in Gocad: Nancy School of Geology, 25th Gocad meeting, Nancy, France, 2005, 1 p. Piché, M., 1999, Les altérations hydrothermales: cours de l’APGGQ à Rouyn-Noranda, 4 p. Piché, M., 2000, Quantification de l'altération hydrothermale des roches du camp minier de Joutel à partir d'analyses d’éléments majeurs: Ministère des Ressources Naturelles, Québec: MB 2000-06, 28 p. Piché, M., and Jébrak, M., 2004, Normative minerals and alteration indices developed for mineral exploration: Journal of Geochemical Exploration, v. 82, p. 59–77. Rocheleau, M., 1980, Stratigraphie et sédimentologie de l’Archéen dans la region de Rouyn, Abitibi, Québec, MRNF TH 0146, 284 p. Ropchan, J.R., Luinstra, B., Fowler, A.D., and Benn, K., 2002, Host-rock and structural controls on the nature and timing of gold mineralization at the Holloway mine, Abitibi subprovince, Ontario: Economic Geology, v. 97, no. 2, p. 291–309. Zhang, P., Machado, N., Ludden, J., and Moore, D., 1993, Geotectonics constraints from U-Pb ages for the Blake River Group, the Kinojévis Group, and the Normétal mine area, Abitibi, Québec: Association géologique du Canada-Association minéralogique du Canada, v. 18, p. A114.
  • 17. 3-D Modeling in the Abitibi Subprovince (Quebec, Canada) • F. FALLARA ET AL. 43
  • 18. 44 Exploration and Mining Geology, Vol. 15, Nos. 1-2, pp. 27-41, 2006