SlideShare a Scribd company logo
1 of 27
A knowledge-based model for identifying and mapping tropical
wetlands and peatlands: areas, depths and volumes
Thomas Gumbricht, Rosa María Roman-Cuesta, Martin Herold, Louis Verchot, Nadine Herold, Daniel Murdiyarso
Rome, Global Symposium on Soil Organic Carbon (GSOC17) , 21-23 March 2017
thomas.gumbricht@gmail.com ; rosa.roman@wur.nl
Source: Gumbricht et al. (GCB) 2017
Dr. Thomas Gumbricht:
Karttur AB, Stockholm, Sweden
thomas.gumbricht@gmail.com
More methodological information and maps available at: http://www.karttur.com/
Data download at SWAMP website: http://www.cifor.org/global-wetlands/
Publications
• Gumbricht et al. (2002) Remote sensing to detect sub-surface peat firs and peat fire scars in
the Okavango Delta, Botswana. South African Journal of Science, 98,351-358.
• Gumbricht T (2015) Hybrid mapping of pantropical wetlands from optical satellite images,
hydrology and geomorphology. In: Remote Sensing of Wetlands: Applications and Advances.
(eds Ralph W. Tiner, Megan W. Lang, Victor V. Klemas), pp 433-452. CRP Press. Taylor and
Francis Group. Boca Raton, Florida.
• Gumbricht T (2016) Soil Moisture Dynamics Estimated from Modis Time Series Images. In:
Multitemporal Remote Sensing. Remote Sensing and Digital Image Processing (ed Y Ban).
Springer International Publishing, Cham, Switzerland. DOI 10.1007/978-3-319-47037-5_12.
• Gumbricht et al. (2017) An expert system model for mapping tropical wetlands and
peatlands reveals South America as the largest Contributor. Global Change Biology. DOI:
10.1111/gcb.13689
Index
• Maps produced & validation
• The expert system model
• The biophysical indices
• Known errors, caveats and possible improvements
Tropical maps of wetlands and peatlands
General characteristics:
• 3 maps: wetlands, peatlands, depths
• 9 maps for individual wetland types (1-100%)
• 236m
• 38° N to 56° S; 161° E to 117° W (tropics and
subtropics), includes 146 countries but
excludes small islands.
Peat: ≥50% organic matter (30% carbon content),
≥30cm thick.
Gumbricht et al. 2017 vs Page et al. 2011
Tropical peat area : 3-fold increase
Tropical peat volumes and stocks: 4-fold
increase
The highest continental contribution (area
and volume) corresponds to South America,
Brazil, not to SE-Asia, Indonesia
Source: Gumbricht et al. (2017) An expert system model for mapping
tropical wetlands and peatlands reveals South America as the largest
Contributor. Global Change Biology. DOI: 10.1111/gcb.13689
Examples of area and depth
for the two largest peat
deposits in the tropics,
outside Asia
Cuvette Central DRC-Congo
Pastaza-Marañón in Peru
Area (km2)
(other study)
Area (km2)
(this study)
35,600 40,838
145,500 125,440
Volume (km3)
(other study)
Volume (km3)
(this study)
70,7 257
600 915
Depth (m)
(other study)
Depth (m)
(this study)
2,0 6,3
4.2 6.9
Pastaza-Marañón
(Draper et al 2015)
Congo Basin
(Dargie et al 2017)
Pastaza-Marañón
(Draper et al 2015)
Congo Basin
(Dargie et al 2017)
Pastaza-Marañón
(Draper et al 2015)
Congo Basin
(Dargie et al 2017)
Some under-reported
peatlands in the tropics
Latin America (Amazon Basin,
Argentina Río de la Plata, Paraná
River Basins)
Asia (All river deltas, Bangladesh,
Indonesia Papua)
Africa (Cuvette-Central, Niger,
Angola, Zambia, Botswana, Sudan)
Total area (km2) Volume (km3) Depth (m) Stocks** (GtC)
Tropics Page et al. (2011)
0.44 mill
(0.39-0.66)
1,758
(1,585-1,822)
2.3 89
Tropics Gumbricht et al. (2017)* 1.5 x3 mill
6,610 x4
(5,765-7,079)
2.5 352 x4
Indonesia Page et al. (2011)
206,950
(206,950-270,630)
1,138
(1,138-1,157)
5.5 57
Indonesia Gumbricht et al. (2017) 225,420
1,388
(1,089-1,396)
4.9-6.2 70
Brazil Page et al. (2011)
25,000
(15,000-55,000)
50
(3-59)
2.0 3
Brazil Gumbricht et al. (2017)
312,250 1,489 x30
(1,218-1,512)
3.9-4.8
75
Statistics of tropical peatlands
Table 1: Estimates of tropical peat variables. Source: Gumbricht et al. (GCB) 2017.
* Same study area of Page et al., (2011)
** Using standard values for bulk density and carbon content
Highest peat area (km2): Brazil, Indonesia, DRC, China, Colombia, Peru, USA, Bangladesh,
India, Venezuela, PNG, Congo
Highest peat volume (km3): Brazil, Indonesia, DRC, Peru, Congo, Colombia, Venezuela,
PNG, Bangladesh, China, Malaysia, India
Highest peat area Page: Indonesia, Peru, Malaysia, Brazil, Zambia, PNG, Venezuela,
Sudan, Guayana, Panama, Uganda.
Figure S2: Visual validation of our map against
six major tropical peat deposits as reported in
Lawson et al., (2014)
Figure S1: Distribution of the peat points (n= 275) used to
validate the peat maps produced with our expert system
model.
Numeric 65% agreement in the tropics
74% agreement in Indonesia
Validation
Visual
There is not enough ground data
available to properly validate
tropical peatland maps
The expert system model (knowledge-based predictive modeling)
Considers three basic requirements for wetland/peatland development:
1. Water input exceeds the atmospheric water demand (potential evapotransp.)
2. The surface is wet or inundated for prolonged periods
3. The geomorphology allows surface water accumulation
Requires data on:
1. Regional and local water balances:
 Mean monthly precipitation1950-2000 from WorldClim global dataset
 Evapotranspiration from CRU- East Anglia
2. Soil moisture (surface wetness phenology):
 16-day BRDF–corrected MODIS (MCD43A4) for mapping the duration of
wet and inundated soil conditions (ca. 250m) year 2011 (2010-2012)
3. Geomorphology:
 Version 4 of the Shuttle Radar Topography Mission (SRTM) digital
elevation model (DEM), prepared by CIAT (250m)
Develops and parameterizes three biophysical indices per pixel, at 236m:
1. Hydrological model: Wetland Topographic Convergence Index (wTCI)
topographic wetness
2. Soil moisture, wetness phenology: Transformed Wetness Index (TWI)
3. Geomorphological Index
HydrologySoil wetness phenology
Geomorphology
Surface wetness +
Combined Wetness Index
Hydrological modeling: Wetland Topographic Convergence Index
(wTCI)
Modification of the TCI (Beven and Kirkby 1979) to account for tropical conditions
Outputs: Surface runoff, ground water flow, flooding volumes
The figure shows modeled versus
measured discharge for 435 globally
distributed runoff stations (log scale).
Basic model concept:
1. Monthly vertical water balance from precipitation and reference evapotransp. (rET)
2. Routing of surplus water allowing rET to fill up while considering local slope and
curvature and soil water conditions.
Hydrological modeling: global runoff
Estimated mean global runoff for the period 1950-2000.
Hydrological modeling: flood volumes
Estimated flood volumes for confined valleys (top) and alluvial plains (bottom)
Soil moisture: Transformed Wetness Index (TWI)
The two MODIS composites are made with the same algorithm and the same data, but with the
vegetation signal from photosynthetic vegetation (PV) and non-PV removed from the lower panel using
a unitary matrix transformation.
The TWI- wetness estimates are done from the data illustrated in the lower panel
Spectral unmixing: Photosynthetic Vegetation (PV), NPV, Soil brightness and water
• The axis are the same in both illustrations, represeting soil brightness (x) and water (y)
derived from the unitary matrix transformation of the original MODIS data.
• The PWI = 0 is the iso-soil-wetness line, a perpendicular wetness index that helps define:
 Wetness thresholds for different land covers
 Differenciated TWIs for global mapping, in a linear manner.
Soil moisture: Transformed Wetness Index (TWI)
Soil brightness Soil brightness
(Water)
Illustration of the construction of TWI: Surface wetness estimation by an optimized non-linear
differentiation using soil-brightness and water. DS: dark soil, LS: light soil, W: water, SDS: saturated
dark soil, SLS: saturated light soil, and DMS: dry medium soil
Transformed Wetness Index ------ > Soil moisture
Basic model concept:
1. Unitary matrix transformation (spectral un-mixing) of multispectral image data to
eigen vectors representing soil brightness, photosythetic vegetation (PV), non-PV and
water.
2. Surface wetness estimation by an optimized non-linear differenciation using soil-
brightness and water.
3. Calibration using soil moisture measurements from the the International Soil
Moisture Network (ISMN)
The figure shows modeled versus measured soil moisture: left original TWI, right converted to soil
moisture and assimilated to mean and STD of measured time-series from ISMN.
Soil moisture content
Estimated global soil moisture content for 2011 using the Transformed Wetness Index. The
conversion from the TWI raw index to soil moisture content (%) was done using data from
the International Soil Moisture Network (ISMN).
Geomorphology
Digital elevation
model (SRTM)
Runoff and flooding
volumes (note the
Log-scale)
Nile River and Tributary
Final Outputs: geohydromorphologies + depth
1. Topography + Hydrology
Case example of a topographic transect with the Nile River
Geomorphology
2. Topographic Position Index (TPI) and Landform classes (geohydromorphologies)
Topographic Position Index (TPI) at 250 and 750m along the transect
Landform classes derived from multiscale analysis (250 and 750 m pixel scale) using The Topographic
Position Index (TPI)
Geomorphology
3. Landform maps and Terrain relief
Landform maps help to threshold wetland occurrence and assist in wetland categorization.
dome-shaped, valley-shaped, plain and planar surfaces
Landform map
The terrain relief is the drop in elevation between the DEM and the nearest drainage point, with
the latter identified from a combination of the landform map and the runoff map.
Terrain relief
Soil moisture (TWI) + Hydrology (wTCI) + Geomorphology
Topographic
Convergence
Index (wTCI)
(runoff and flooding)
+
local slope and
profile curvatures
Nile River and Tributary
hydrological wetness
Nile River and Tributary
Soil moisture
TWI derived from
MODIS time-series
Response by reeds and Papyrus vegetation along time, depending on flooding and soil surface water
Combined Wetness Index: wTCI + TWI
The green line shows the combined wetness for all regions, whereas the blue line is restricted to
areas that can host wetlands related to landform, terrain relief, and water blance. The index is
arbitrarily scaled
Identified wetlands along the transect, illustrated by showing the assigned depth. The assigned
depth is maximized for different wetland categories and can never exceed the terrain relief.
Identified wetlands
Depth (m)
Combined
Wetness
Index
Depths
1. Depth has been derived from a combination of:
• geomorphological data
• hydrological wetness data
• distance decay functions
2. Depth thresholds max-min
are assigned to each wetland
class
Known errors, caveats and possible improvements
• There are errors associated to the source data used in the three indices:
 Hydrology (Climate data): inaccurate source data for the tropics.
Suggested measure: Use of regional climate and regional calibrations.
 Topography (SRTM): erroneous over dense canopies (artificially heighten)
and over water bodies (artificially lowered): overestimation of soil depths in
forested swamps, leading to overestimation of volumes.
Measured applied: we halved the established max depth thresholds used
to parameterize the different wetland types, offering thresholds of volume.
Depths (m) from peat soil
profiles compiled by Nadine
Herold (unpublished data)
and estimated by our expert
system.
Known errors, caveats and possible improvements
 Soil moisture (MODIS): optical imagery misses floods and inundated soil
conditions during cloud-persistent wet seasons, and overestimates moisture
in areas with strong forest shadows (needle-leaf forests in particular).
Underestimation of wetlands also occur in areas with dense grasses and
papyrus.
Suggested measure: adjustment of TWI by canopy cover, or calibration of
TWI using microwave data.
 Soil moisture (MODIS): temporal scale limited to 2011 (2010-2012) may
have captured anomalous wet La Niña conditions leading to overestimations
of peatland area.
Suggested measure: Adopt a larger MODIS period for analysing soil
moisture.
• Lack of ground data for organic soils, as well as unstandardized definitions of
wetlands and peatland jeopardizes map validation.
• Peatland area estimates are higher than previously reported due to better spatial
resolution (236m), multi-source method improving optical limitations, inclusion of
all land covers and uses (paddy rice not excluded if swamp conditions are
detected). However, hydro-geomorphological predicted areas might not
accumulate peat. Fire and river dynamics are not included. Tectonics and
parental material are only indirectly accounted for.
Next steps for peatland monitoring
• Regional parameterizations in the tropics to improve the accuracy of the
estimates (i.e. South America, Asia, Africa). The expert system currently offers
one model and one tropical parameterization (although different for each
wetland).
•
• Inclusion of boreal peatlands: new regional parameterization
• Inclusion of montane peatlands: new regional parameterization
• Peatland area forecasting and sensitivity tests: the expert system can be
used to forecast wetland areas under future climatic conditions.
Questions?

More Related Content

What's hot

TH4.L10.1: SMOS SMAP SYNERGISMS FOR THE RETRIEVAL OF SOIL MOISTURE
  TH4.L10.1: SMOS SMAP SYNERGISMS FOR THE RETRIEVAL OF SOIL MOISTURE  TH4.L10.1: SMOS SMAP SYNERGISMS FOR THE RETRIEVAL OF SOIL MOISTURE
TH4.L10.1: SMOS SMAP SYNERGISMS FOR THE RETRIEVAL OF SOIL MOISTUREgrssieee
 
An expert system model for identifying and mapping tropical wetlands and peat...
An expert system model for identifying and mapping tropical wetlands and peat...An expert system model for identifying and mapping tropical wetlands and peat...
An expert system model for identifying and mapping tropical wetlands and peat...CIFOR-ICRAF
 
Remote Sensing Methods for operational ET determinations in the NENA region, ...
Remote Sensing Methods for operational ET determinations in the NENA region, ...Remote Sensing Methods for operational ET determinations in the NENA region, ...
Remote Sensing Methods for operational ET determinations in the NENA region, ...NENAwaterscarcity
 
Improving input data for urban canopy and land surface models: a sensitivity ...
Improving input data for urban canopy and land surface models: a sensitivity ...Improving input data for urban canopy and land surface models: a sensitivity ...
Improving input data for urban canopy and land surface models: a sensitivity ...National Institute of Food and Agriculture
 
2. Technical introduction to the GSOC Map
2. Technical introduction to the GSOC Map2. Technical introduction to the GSOC Map
2. Technical introduction to the GSOC MapFAO
 
Geofolio North Norfolk
Geofolio North NorfolkGeofolio North Norfolk
Geofolio North NorfolkGeoBlogs
 
2. virat arora, s. s. rao, e. amminedu and p. jagadeeswara rao
2. virat arora, s. s. rao, e. amminedu and p. jagadeeswara rao2. virat arora, s. s. rao, e. amminedu and p. jagadeeswara rao
2. virat arora, s. s. rao, e. amminedu and p. jagadeeswara raoJournal of Global Resources
 
Dynamic Erosion Model and Monitoring System (DEMIS)
Dynamic Erosion Model and Monitoring System (DEMIS)Dynamic Erosion Model and Monitoring System (DEMIS)
Dynamic Erosion Model and Monitoring System (DEMIS)ExternalEvents
 
Evapotranspiration estimation with remote sensing
Evapotranspiration estimation with remote sensingEvapotranspiration estimation with remote sensing
Evapotranspiration estimation with remote sensingIqura Malik
 
Exploring DEM error with geographically weighted regression
Exploring DEM error with geographically weighted regressionExploring DEM error with geographically weighted regression
Exploring DEM error with geographically weighted regressionGeoCommunity
 
Geohydrological study of weathered basement aquifers in Oban Massif and envir...
Geohydrological study of weathered basement aquifers in Oban Massif and envir...Geohydrological study of weathered basement aquifers in Oban Massif and envir...
Geohydrological study of weathered basement aquifers in Oban Massif and envir...iosrjce
 
Change detection using remote sensing and GIS
Change detection using remote sensing and GISChange detection using remote sensing and GIS
Change detection using remote sensing and GISTilok Chetri
 
Karakterisasi Letusan Merapi menggunakan Data SAR (Synthetic Aperture Radar)
Karakterisasi Letusan Merapi menggunakan Data SAR (Synthetic Aperture Radar)Karakterisasi Letusan Merapi menggunakan Data SAR (Synthetic Aperture Radar)
Karakterisasi Letusan Merapi menggunakan Data SAR (Synthetic Aperture Radar)Achmad Darul
 
A high-resolution spatially-explicit methodology to assess global soil organi...
A high-resolution spatially-explicit methodology to assess global soil organi...A high-resolution spatially-explicit methodology to assess global soil organi...
A high-resolution spatially-explicit methodology to assess global soil organi...ExternalEvents
 
ESTIMATION OF SOIL ERODIBILITY AND RAINFALL EROSIVITY FOR THE BIEMSO BASIN, G...
ESTIMATION OF SOIL ERODIBILITY AND RAINFALL EROSIVITY FOR THE BIEMSO BASIN, G...ESTIMATION OF SOIL ERODIBILITY AND RAINFALL EROSIVITY FOR THE BIEMSO BASIN, G...
ESTIMATION OF SOIL ERODIBILITY AND RAINFALL EROSIVITY FOR THE BIEMSO BASIN, G...Eric Takyi Atakora , Ph.D (candidate)
 
IGARSS11_HongboSu_ver3.ppt
IGARSS11_HongboSu_ver3.pptIGARSS11_HongboSu_ver3.ppt
IGARSS11_HongboSu_ver3.pptgrssieee
 
2. VULNERABILITY ASSESSMENT OF SOIL EROSION USING GEOSPATIAL TECHNIQUES
2. VULNERABILITY ASSESSMENT OF SOIL EROSION USING GEOSPATIAL TECHNIQUES2. VULNERABILITY ASSESSMENT OF SOIL EROSION USING GEOSPATIAL TECHNIQUES
2. VULNERABILITY ASSESSMENT OF SOIL EROSION USING GEOSPATIAL TECHNIQUESDr. Ravinder Jangra
 
SOIL LOSS ESTIMATION IN GIS FRAMEWORK: A CASE STUDY IN CHAMPABATI WATERSHED
SOIL LOSS ESTIMATION IN GIS FRAMEWORK: A CASE STUDY IN CHAMPABATI WATERSHEDSOIL LOSS ESTIMATION IN GIS FRAMEWORK: A CASE STUDY IN CHAMPABATI WATERSHED
SOIL LOSS ESTIMATION IN GIS FRAMEWORK: A CASE STUDY IN CHAMPABATI WATERSHEDAM Publications
 

What's hot (20)

Report B.Tech
Report B.TechReport B.Tech
Report B.Tech
 
Landscape agro-hydrological modeling: opportunities from remote sensing
Landscape agro-hydrological modeling: opportunities from remote sensingLandscape agro-hydrological modeling: opportunities from remote sensing
Landscape agro-hydrological modeling: opportunities from remote sensing
 
TH4.L10.1: SMOS SMAP SYNERGISMS FOR THE RETRIEVAL OF SOIL MOISTURE
  TH4.L10.1: SMOS SMAP SYNERGISMS FOR THE RETRIEVAL OF SOIL MOISTURE  TH4.L10.1: SMOS SMAP SYNERGISMS FOR THE RETRIEVAL OF SOIL MOISTURE
TH4.L10.1: SMOS SMAP SYNERGISMS FOR THE RETRIEVAL OF SOIL MOISTURE
 
An expert system model for identifying and mapping tropical wetlands and peat...
An expert system model for identifying and mapping tropical wetlands and peat...An expert system model for identifying and mapping tropical wetlands and peat...
An expert system model for identifying and mapping tropical wetlands and peat...
 
Remote Sensing Methods for operational ET determinations in the NENA region, ...
Remote Sensing Methods for operational ET determinations in the NENA region, ...Remote Sensing Methods for operational ET determinations in the NENA region, ...
Remote Sensing Methods for operational ET determinations in the NENA region, ...
 
Improving input data for urban canopy and land surface models: a sensitivity ...
Improving input data for urban canopy and land surface models: a sensitivity ...Improving input data for urban canopy and land surface models: a sensitivity ...
Improving input data for urban canopy and land surface models: a sensitivity ...
 
2. Technical introduction to the GSOC Map
2. Technical introduction to the GSOC Map2. Technical introduction to the GSOC Map
2. Technical introduction to the GSOC Map
 
Geofolio North Norfolk
Geofolio North NorfolkGeofolio North Norfolk
Geofolio North Norfolk
 
2. virat arora, s. s. rao, e. amminedu and p. jagadeeswara rao
2. virat arora, s. s. rao, e. amminedu and p. jagadeeswara rao2. virat arora, s. s. rao, e. amminedu and p. jagadeeswara rao
2. virat arora, s. s. rao, e. amminedu and p. jagadeeswara rao
 
Dynamic Erosion Model and Monitoring System (DEMIS)
Dynamic Erosion Model and Monitoring System (DEMIS)Dynamic Erosion Model and Monitoring System (DEMIS)
Dynamic Erosion Model and Monitoring System (DEMIS)
 
Evapotranspiration estimation with remote sensing
Evapotranspiration estimation with remote sensingEvapotranspiration estimation with remote sensing
Evapotranspiration estimation with remote sensing
 
Exploring DEM error with geographically weighted regression
Exploring DEM error with geographically weighted regressionExploring DEM error with geographically weighted regression
Exploring DEM error with geographically weighted regression
 
Geohydrological study of weathered basement aquifers in Oban Massif and envir...
Geohydrological study of weathered basement aquifers in Oban Massif and envir...Geohydrological study of weathered basement aquifers in Oban Massif and envir...
Geohydrological study of weathered basement aquifers in Oban Massif and envir...
 
Change detection using remote sensing and GIS
Change detection using remote sensing and GISChange detection using remote sensing and GIS
Change detection using remote sensing and GIS
 
Karakterisasi Letusan Merapi menggunakan Data SAR (Synthetic Aperture Radar)
Karakterisasi Letusan Merapi menggunakan Data SAR (Synthetic Aperture Radar)Karakterisasi Letusan Merapi menggunakan Data SAR (Synthetic Aperture Radar)
Karakterisasi Letusan Merapi menggunakan Data SAR (Synthetic Aperture Radar)
 
A high-resolution spatially-explicit methodology to assess global soil organi...
A high-resolution spatially-explicit methodology to assess global soil organi...A high-resolution spatially-explicit methodology to assess global soil organi...
A high-resolution spatially-explicit methodology to assess global soil organi...
 
ESTIMATION OF SOIL ERODIBILITY AND RAINFALL EROSIVITY FOR THE BIEMSO BASIN, G...
ESTIMATION OF SOIL ERODIBILITY AND RAINFALL EROSIVITY FOR THE BIEMSO BASIN, G...ESTIMATION OF SOIL ERODIBILITY AND RAINFALL EROSIVITY FOR THE BIEMSO BASIN, G...
ESTIMATION OF SOIL ERODIBILITY AND RAINFALL EROSIVITY FOR THE BIEMSO BASIN, G...
 
IGARSS11_HongboSu_ver3.ppt
IGARSS11_HongboSu_ver3.pptIGARSS11_HongboSu_ver3.ppt
IGARSS11_HongboSu_ver3.ppt
 
2. VULNERABILITY ASSESSMENT OF SOIL EROSION USING GEOSPATIAL TECHNIQUES
2. VULNERABILITY ASSESSMENT OF SOIL EROSION USING GEOSPATIAL TECHNIQUES2. VULNERABILITY ASSESSMENT OF SOIL EROSION USING GEOSPATIAL TECHNIQUES
2. VULNERABILITY ASSESSMENT OF SOIL EROSION USING GEOSPATIAL TECHNIQUES
 
SOIL LOSS ESTIMATION IN GIS FRAMEWORK: A CASE STUDY IN CHAMPABATI WATERSHED
SOIL LOSS ESTIMATION IN GIS FRAMEWORK: A CASE STUDY IN CHAMPABATI WATERSHEDSOIL LOSS ESTIMATION IN GIS FRAMEWORK: A CASE STUDY IN CHAMPABATI WATERSHED
SOIL LOSS ESTIMATION IN GIS FRAMEWORK: A CASE STUDY IN CHAMPABATI WATERSHED
 

Viewers also liked

Effects of land use/cover on soil aggregate-associated organic carbon in a mo...
Effects of land use/cover on soil aggregate-associated organic carbon in a mo...Effects of land use/cover on soil aggregate-associated organic carbon in a mo...
Effects of land use/cover on soil aggregate-associated organic carbon in a mo...ExternalEvents
 
Black Soils: Mollisols in the USA
Black Soils: Mollisols in the USABlack Soils: Mollisols in the USA
Black Soils: Mollisols in the USAExternalEvents
 
Regenerative Organic Farm Management Practices Mitigate Agro-Ecosystem Vulner...
Regenerative Organic Farm Management Practices Mitigate Agro-Ecosystem Vulner...Regenerative Organic Farm Management Practices Mitigate Agro-Ecosystem Vulner...
Regenerative Organic Farm Management Practices Mitigate Agro-Ecosystem Vulner...ExternalEvents
 
Assessing the potential of soil organic carbon sequestration in African soils
Assessing the potential of soil organic carbon sequestration in African soilsAssessing the potential of soil organic carbon sequestration in African soils
Assessing the potential of soil organic carbon sequestration in African soilsExternalEvents
 
Measurement of Carbon content in plots under SFM and SLM in the Gran Chaco Am...
Measurement of Carbon content in plots under SFM and SLM in the Gran Chaco Am...Measurement of Carbon content in plots under SFM and SLM in the Gran Chaco Am...
Measurement of Carbon content in plots under SFM and SLM in the Gran Chaco Am...ExternalEvents
 
Agricultural practices that store organic carbon in soils: is it only a matte...
Agricultural practices that store organic carbon in soils: is it only a matte...Agricultural practices that store organic carbon in soils: is it only a matte...
Agricultural practices that store organic carbon in soils: is it only a matte...ExternalEvents
 
Distribution and degradation status of tropical peatland types
Distribution and degradation status of tropical peatland typesDistribution and degradation status of tropical peatland types
Distribution and degradation status of tropical peatland typesExternalEvents
 
Effects of a raised water table on greenhouse gas emissions and celery yield ...
Effects of a raised water table on greenhouse gas emissions and celery yield ...Effects of a raised water table on greenhouse gas emissions and celery yield ...
Effects of a raised water table on greenhouse gas emissions and celery yield ...ExternalEvents
 
Land Use Changes on Soil Carbon Dynamics, Stocks in Eastern Himalayas, India
Land Use Changes on Soil Carbon Dynamics, Stocks in Eastern Himalayas, IndiaLand Use Changes on Soil Carbon Dynamics, Stocks in Eastern Himalayas, India
Land Use Changes on Soil Carbon Dynamics, Stocks in Eastern Himalayas, IndiaExternalEvents
 
Combining Soil Organic Carbon sequestration and food security in African soils
Combining Soil Organic Carbon sequestration and food security in African soilsCombining Soil Organic Carbon sequestration and food security in African soils
Combining Soil Organic Carbon sequestration and food security in African soilsExternalEvents
 
Calculating changes in soil carbon in Japanese agricultural land by IPCC-tier...
Calculating changes in soil carbon in Japanese agricultural land by IPCC-tier...Calculating changes in soil carbon in Japanese agricultural land by IPCC-tier...
Calculating changes in soil carbon in Japanese agricultural land by IPCC-tier...ExternalEvents
 
Status of Soil Organic Carbon Stocks in the Small Island Developing States (S...
Status of Soil Organic Carbon Stocks in the Small Island Developing States (S...Status of Soil Organic Carbon Stocks in the Small Island Developing States (S...
Status of Soil Organic Carbon Stocks in the Small Island Developing States (S...ExternalEvents
 
Towards a Tier 3 approach to estimate SOC stocks at sub-regional scale in Sou...
Towards a Tier 3 approach to estimate SOC stocks at sub-regional scale in Sou...Towards a Tier 3 approach to estimate SOC stocks at sub-regional scale in Sou...
Towards a Tier 3 approach to estimate SOC stocks at sub-regional scale in Sou...ExternalEvents
 
Evaluation of annual carbon losses due to soil respiration
Evaluation of annual carbon losses due to soil respirationEvaluation of annual carbon losses due to soil respiration
Evaluation of annual carbon losses due to soil respirationExternalEvents
 
Black Soil Conservation and Sustainable Use in China
Black Soil Conservation and Sustainable Use in ChinaBlack Soil Conservation and Sustainable Use in China
Black Soil Conservation and Sustainable Use in ChinaExternalEvents
 
Soil Carbon 4 per 1000
Soil Carbon 4 per 1000Soil Carbon 4 per 1000
Soil Carbon 4 per 1000ExternalEvents
 
Measuring and monitoring soil carbon stocks from point to continental scale i...
Measuring and monitoring soil carbon stocks from point to continental scale i...Measuring and monitoring soil carbon stocks from point to continental scale i...
Measuring and monitoring soil carbon stocks from point to continental scale i...ExternalEvents
 
Soil carbon models for carbon stock estimation – where do we fail?
Soil carbon models for carbon stock estimation – where do we fail?Soil carbon models for carbon stock estimation – where do we fail?
Soil carbon models for carbon stock estimation – where do we fail?ExternalEvents
 
Quantifying terrestrial ecosystem carbon stocks for future GHG mitigation, su...
Quantifying terrestrial ecosystem carbon stocks for future GHG mitigation, su...Quantifying terrestrial ecosystem carbon stocks for future GHG mitigation, su...
Quantifying terrestrial ecosystem carbon stocks for future GHG mitigation, su...ExternalEvents
 

Viewers also liked (20)

Effects of land use/cover on soil aggregate-associated organic carbon in a mo...
Effects of land use/cover on soil aggregate-associated organic carbon in a mo...Effects of land use/cover on soil aggregate-associated organic carbon in a mo...
Effects of land use/cover on soil aggregate-associated organic carbon in a mo...
 
Black Soils: Mollisols in the USA
Black Soils: Mollisols in the USABlack Soils: Mollisols in the USA
Black Soils: Mollisols in the USA
 
Regenerative Organic Farm Management Practices Mitigate Agro-Ecosystem Vulner...
Regenerative Organic Farm Management Practices Mitigate Agro-Ecosystem Vulner...Regenerative Organic Farm Management Practices Mitigate Agro-Ecosystem Vulner...
Regenerative Organic Farm Management Practices Mitigate Agro-Ecosystem Vulner...
 
Assessing the potential of soil organic carbon sequestration in African soils
Assessing the potential of soil organic carbon sequestration in African soilsAssessing the potential of soil organic carbon sequestration in African soils
Assessing the potential of soil organic carbon sequestration in African soils
 
Measurement of Carbon content in plots under SFM and SLM in the Gran Chaco Am...
Measurement of Carbon content in plots under SFM and SLM in the Gran Chaco Am...Measurement of Carbon content in plots under SFM and SLM in the Gran Chaco Am...
Measurement of Carbon content in plots under SFM and SLM in the Gran Chaco Am...
 
Agricultural practices that store organic carbon in soils: is it only a matte...
Agricultural practices that store organic carbon in soils: is it only a matte...Agricultural practices that store organic carbon in soils: is it only a matte...
Agricultural practices that store organic carbon in soils: is it only a matte...
 
Distribution and degradation status of tropical peatland types
Distribution and degradation status of tropical peatland typesDistribution and degradation status of tropical peatland types
Distribution and degradation status of tropical peatland types
 
Effects of a raised water table on greenhouse gas emissions and celery yield ...
Effects of a raised water table on greenhouse gas emissions and celery yield ...Effects of a raised water table on greenhouse gas emissions and celery yield ...
Effects of a raised water table on greenhouse gas emissions and celery yield ...
 
Land Use Changes on Soil Carbon Dynamics, Stocks in Eastern Himalayas, India
Land Use Changes on Soil Carbon Dynamics, Stocks in Eastern Himalayas, IndiaLand Use Changes on Soil Carbon Dynamics, Stocks in Eastern Himalayas, India
Land Use Changes on Soil Carbon Dynamics, Stocks in Eastern Himalayas, India
 
Combining Soil Organic Carbon sequestration and food security in African soils
Combining Soil Organic Carbon sequestration and food security in African soilsCombining Soil Organic Carbon sequestration and food security in African soils
Combining Soil Organic Carbon sequestration and food security in African soils
 
Calculating changes in soil carbon in Japanese agricultural land by IPCC-tier...
Calculating changes in soil carbon in Japanese agricultural land by IPCC-tier...Calculating changes in soil carbon in Japanese agricultural land by IPCC-tier...
Calculating changes in soil carbon in Japanese agricultural land by IPCC-tier...
 
Status of Soil Organic Carbon Stocks in the Small Island Developing States (S...
Status of Soil Organic Carbon Stocks in the Small Island Developing States (S...Status of Soil Organic Carbon Stocks in the Small Island Developing States (S...
Status of Soil Organic Carbon Stocks in the Small Island Developing States (S...
 
Black soils in Russia
Black soils in RussiaBlack soils in Russia
Black soils in Russia
 
Towards a Tier 3 approach to estimate SOC stocks at sub-regional scale in Sou...
Towards a Tier 3 approach to estimate SOC stocks at sub-regional scale in Sou...Towards a Tier 3 approach to estimate SOC stocks at sub-regional scale in Sou...
Towards a Tier 3 approach to estimate SOC stocks at sub-regional scale in Sou...
 
Evaluation of annual carbon losses due to soil respiration
Evaluation of annual carbon losses due to soil respirationEvaluation of annual carbon losses due to soil respiration
Evaluation of annual carbon losses due to soil respiration
 
Black Soil Conservation and Sustainable Use in China
Black Soil Conservation and Sustainable Use in ChinaBlack Soil Conservation and Sustainable Use in China
Black Soil Conservation and Sustainable Use in China
 
Soil Carbon 4 per 1000
Soil Carbon 4 per 1000Soil Carbon 4 per 1000
Soil Carbon 4 per 1000
 
Measuring and monitoring soil carbon stocks from point to continental scale i...
Measuring and monitoring soil carbon stocks from point to continental scale i...Measuring and monitoring soil carbon stocks from point to continental scale i...
Measuring and monitoring soil carbon stocks from point to continental scale i...
 
Soil carbon models for carbon stock estimation – where do we fail?
Soil carbon models for carbon stock estimation – where do we fail?Soil carbon models for carbon stock estimation – where do we fail?
Soil carbon models for carbon stock estimation – where do we fail?
 
Quantifying terrestrial ecosystem carbon stocks for future GHG mitigation, su...
Quantifying terrestrial ecosystem carbon stocks for future GHG mitigation, su...Quantifying terrestrial ecosystem carbon stocks for future GHG mitigation, su...
Quantifying terrestrial ecosystem carbon stocks for future GHG mitigation, su...
 

Similar to A knowledge-based model for identifying and mapping tropical wetlands and peatlands: areas, depths, and volumes

An integrative information aqueduct to close the gaps between global satellit...
An integrative information aqueduct to close the gaps between global satellit...An integrative information aqueduct to close the gaps between global satellit...
An integrative information aqueduct to close the gaps between global satellit...Salvatore Manfreda
 
Streamflow simulation using radar-based precipitation applied to the Illinois...
Streamflow simulation using radar-based precipitation applied to the Illinois...Streamflow simulation using radar-based precipitation applied to the Illinois...
Streamflow simulation using radar-based precipitation applied to the Illinois...Alireza Safari
 
From Global satellite water cycle products to field scale satellite water states
From Global satellite water cycle products to field scale satellite water statesFrom Global satellite water cycle products to field scale satellite water states
From Global satellite water cycle products to field scale satellite water statesSalvatore Manfreda
 
Drought monitoring, Precipitation statistics, and water balance with freely a...
Drought monitoring, Precipitation statistics, and water balance with freely a...Drought monitoring, Precipitation statistics, and water balance with freely a...
Drought monitoring, Precipitation statistics, and water balance with freely a...AngelosAlamanos
 
GEOtop Sisef presentation
GEOtop Sisef presentationGEOtop Sisef presentation
GEOtop Sisef presentationRiccardo Rigon
 
Spatial variation in surface runoff at catchment scale, the case study of adi...
Spatial variation in surface runoff at catchment scale, the case study of adi...Spatial variation in surface runoff at catchment scale, the case study of adi...
Spatial variation in surface runoff at catchment scale, the case study of adi...Alexander Decker
 
Coupling of Surface water and Groundwater Models
Coupling of Surface water and Groundwater Models Coupling of Surface water and Groundwater Models
Coupling of Surface water and Groundwater Models TIPU SULTAN BADAGAN
 
Egu talk on EcoHydrology by Brenner et al.
Egu talk on EcoHydrology by Brenner et al.Egu talk on EcoHydrology by Brenner et al.
Egu talk on EcoHydrology by Brenner et al.Riccardo Rigon
 
Ess 16-3959-2012
Ess 16-3959-2012Ess 16-3959-2012
Ess 16-3959-2012Simone88888
 
Surface soil moisturescaling
Surface soil moisturescalingSurface soil moisturescaling
Surface soil moisturescalingposterVienna
 
Scale-dependency and Sensitivity of Hydrological Estimations to Land Use and ...
Scale-dependency and Sensitivity of Hydrological Estimations to Land Use and ...Scale-dependency and Sensitivity of Hydrological Estimations to Land Use and ...
Scale-dependency and Sensitivity of Hydrological Estimations to Land Use and ...Beniamino Murgante
 
Soil organic carbon in soils of the northern permafrost zones: Information st...
Soil organic carbon in soils of the northern permafrost zones: Information st...Soil organic carbon in soils of the northern permafrost zones: Information st...
Soil organic carbon in soils of the northern permafrost zones: Information st...ExternalEvents
 
Assessing the importance of geo hydrological data acquisition in the developm...
Assessing the importance of geo hydrological data acquisition in the developm...Assessing the importance of geo hydrological data acquisition in the developm...
Assessing the importance of geo hydrological data acquisition in the developm...Alexander Decker
 
DSD-INT 2017 Global modelling of hydrology and water resources: current state...
DSD-INT 2017 Global modelling of hydrology and water resources: current state...DSD-INT 2017 Global modelling of hydrology and water resources: current state...
DSD-INT 2017 Global modelling of hydrology and water resources: current state...Deltares
 
5. PREDICTING SOIL EROSION RISK BY SWAT IN A-searchable.pdf
5. PREDICTING SOIL EROSION RISK BY SWAT IN A-searchable.pdf5. PREDICTING SOIL EROSION RISK BY SWAT IN A-searchable.pdf
5. PREDICTING SOIL EROSION RISK BY SWAT IN A-searchable.pdfAbdusalamIdiris
 

Similar to A knowledge-based model for identifying and mapping tropical wetlands and peatlands: areas, depths, and volumes (20)

An integrative information aqueduct to close the gaps between global satellit...
An integrative information aqueduct to close the gaps between global satellit...An integrative information aqueduct to close the gaps between global satellit...
An integrative information aqueduct to close the gaps between global satellit...
 
Streamflow simulation using radar-based precipitation applied to the Illinois...
Streamflow simulation using radar-based precipitation applied to the Illinois...Streamflow simulation using radar-based precipitation applied to the Illinois...
Streamflow simulation using radar-based precipitation applied to the Illinois...
 
From Global satellite water cycle products to field scale satellite water states
From Global satellite water cycle products to field scale satellite water statesFrom Global satellite water cycle products to field scale satellite water states
From Global satellite water cycle products to field scale satellite water states
 
Drought monitoring, Precipitation statistics, and water balance with freely a...
Drought monitoring, Precipitation statistics, and water balance with freely a...Drought monitoring, Precipitation statistics, and water balance with freely a...
Drought monitoring, Precipitation statistics, and water balance with freely a...
 
GEOtop Sisef presentation
GEOtop Sisef presentationGEOtop Sisef presentation
GEOtop Sisef presentation
 
Spatial variation in surface runoff at catchment scale, the case study of adi...
Spatial variation in surface runoff at catchment scale, the case study of adi...Spatial variation in surface runoff at catchment scale, the case study of adi...
Spatial variation in surface runoff at catchment scale, the case study of adi...
 
Intercomparison
IntercomparisonIntercomparison
Intercomparison
 
Coupling of Surface water and Groundwater Models
Coupling of Surface water and Groundwater Models Coupling of Surface water and Groundwater Models
Coupling of Surface water and Groundwater Models
 
water-11-00084.pdf
water-11-00084.pdfwater-11-00084.pdf
water-11-00084.pdf
 
Egu talk on EcoHydrology by Brenner et al.
Egu talk on EcoHydrology by Brenner et al.Egu talk on EcoHydrology by Brenner et al.
Egu talk on EcoHydrology by Brenner et al.
 
Ess 16-3959-2012
Ess 16-3959-2012Ess 16-3959-2012
Ess 16-3959-2012
 
Surface soil moisturescaling
Surface soil moisturescalingSurface soil moisturescaling
Surface soil moisturescaling
 
Giacomo bertoldi seminar_30_padova_08
Giacomo bertoldi seminar_30_padova_08Giacomo bertoldi seminar_30_padova_08
Giacomo bertoldi seminar_30_padova_08
 
Scale-dependency and Sensitivity of Hydrological Estimations to Land Use and ...
Scale-dependency and Sensitivity of Hydrological Estimations to Land Use and ...Scale-dependency and Sensitivity of Hydrological Estimations to Land Use and ...
Scale-dependency and Sensitivity of Hydrological Estimations to Land Use and ...
 
Smart management for the public sector
Smart management for the public sectorSmart management for the public sector
Smart management for the public sector
 
Ijirt148701 paper
Ijirt148701 paperIjirt148701 paper
Ijirt148701 paper
 
Soil organic carbon in soils of the northern permafrost zones: Information st...
Soil organic carbon in soils of the northern permafrost zones: Information st...Soil organic carbon in soils of the northern permafrost zones: Information st...
Soil organic carbon in soils of the northern permafrost zones: Information st...
 
Assessing the importance of geo hydrological data acquisition in the developm...
Assessing the importance of geo hydrological data acquisition in the developm...Assessing the importance of geo hydrological data acquisition in the developm...
Assessing the importance of geo hydrological data acquisition in the developm...
 
DSD-INT 2017 Global modelling of hydrology and water resources: current state...
DSD-INT 2017 Global modelling of hydrology and water resources: current state...DSD-INT 2017 Global modelling of hydrology and water resources: current state...
DSD-INT 2017 Global modelling of hydrology and water resources: current state...
 
5. PREDICTING SOIL EROSION RISK BY SWAT IN A-searchable.pdf
5. PREDICTING SOIL EROSION RISK BY SWAT IN A-searchable.pdf5. PREDICTING SOIL EROSION RISK BY SWAT IN A-searchable.pdf
5. PREDICTING SOIL EROSION RISK BY SWAT IN A-searchable.pdf
 

More from ExternalEvents

More from ExternalEvents (20)

Mauritania
Mauritania Mauritania
Mauritania
 
Malawi - M. Munthali
Malawi - M. MunthaliMalawi - M. Munthali
Malawi - M. Munthali
 
Malawi (Mbewe)
Malawi (Mbewe)Malawi (Mbewe)
Malawi (Mbewe)
 
Malawi (Desideri)
Malawi (Desideri)Malawi (Desideri)
Malawi (Desideri)
 
Lesotho
LesothoLesotho
Lesotho
 
Kenya
KenyaKenya
Kenya
 
ICRAF: Soil-plant spectral diagnostics laboratory
ICRAF: Soil-plant spectral diagnostics laboratoryICRAF: Soil-plant spectral diagnostics laboratory
ICRAF: Soil-plant spectral diagnostics laboratory
 
Ghana
GhanaGhana
Ghana
 
Ethiopia
EthiopiaEthiopia
Ethiopia
 
Item 15
Item 15Item 15
Item 15
 
Item 14
Item 14Item 14
Item 14
 
Item 13
Item 13Item 13
Item 13
 
Item 7
Item 7Item 7
Item 7
 
Item 6
Item 6Item 6
Item 6
 
Item 3
Item 3Item 3
Item 3
 
Item 16
Item 16Item 16
Item 16
 
Item 9: Soil mapping to support sustainable agriculture
Item 9: Soil mapping to support sustainable agricultureItem 9: Soil mapping to support sustainable agriculture
Item 9: Soil mapping to support sustainable agriculture
 
Item 8: WRB, World Reference Base for Soil Resouces
Item 8: WRB, World Reference Base for Soil ResoucesItem 8: WRB, World Reference Base for Soil Resouces
Item 8: WRB, World Reference Base for Soil Resouces
 
Item 7: Progress made in Nepal
Item 7: Progress made in NepalItem 7: Progress made in Nepal
Item 7: Progress made in Nepal
 
Item 6: International Center for Biosaline Agriculture
Item 6: International Center for Biosaline AgricultureItem 6: International Center for Biosaline Agriculture
Item 6: International Center for Biosaline Agriculture
 

Recently uploaded

Exploring_the_Narrative_Style_of_Amitav_Ghoshs_Gun_Island.pptx
Exploring_the_Narrative_Style_of_Amitav_Ghoshs_Gun_Island.pptxExploring_the_Narrative_Style_of_Amitav_Ghoshs_Gun_Island.pptx
Exploring_the_Narrative_Style_of_Amitav_Ghoshs_Gun_Island.pptxPooja Bhuva
 
Application orientated numerical on hev.ppt
Application orientated numerical on hev.pptApplication orientated numerical on hev.ppt
Application orientated numerical on hev.pptRamjanShidvankar
 
How to Create and Manage Wizard in Odoo 17
How to Create and Manage Wizard in Odoo 17How to Create and Manage Wizard in Odoo 17
How to Create and Manage Wizard in Odoo 17Celine George
 
Sociology 101 Demonstration of Learning Exhibit
Sociology 101 Demonstration of Learning ExhibitSociology 101 Demonstration of Learning Exhibit
Sociology 101 Demonstration of Learning Exhibitjbellavia9
 
How to Manage Global Discount in Odoo 17 POS
How to Manage Global Discount in Odoo 17 POSHow to Manage Global Discount in Odoo 17 POS
How to Manage Global Discount in Odoo 17 POSCeline George
 
Basic Civil Engineering first year Notes- Chapter 4 Building.pptx
Basic Civil Engineering first year Notes- Chapter 4 Building.pptxBasic Civil Engineering first year Notes- Chapter 4 Building.pptx
Basic Civil Engineering first year Notes- Chapter 4 Building.pptxDenish Jangid
 
ICT role in 21st century education and it's challenges.
ICT role in 21st century education and it's challenges.ICT role in 21st century education and it's challenges.
ICT role in 21st century education and it's challenges.MaryamAhmad92
 
UGC NET Paper 1 Mathematical Reasoning & Aptitude.pdf
UGC NET Paper 1 Mathematical Reasoning & Aptitude.pdfUGC NET Paper 1 Mathematical Reasoning & Aptitude.pdf
UGC NET Paper 1 Mathematical Reasoning & Aptitude.pdfNirmal Dwivedi
 
Kodo Millet PPT made by Ghanshyam bairwa college of Agriculture kumher bhara...
Kodo Millet  PPT made by Ghanshyam bairwa college of Agriculture kumher bhara...Kodo Millet  PPT made by Ghanshyam bairwa college of Agriculture kumher bhara...
Kodo Millet PPT made by Ghanshyam bairwa college of Agriculture kumher bhara...pradhanghanshyam7136
 
REMIFENTANIL: An Ultra short acting opioid.pptx
REMIFENTANIL: An Ultra short acting opioid.pptxREMIFENTANIL: An Ultra short acting opioid.pptx
REMIFENTANIL: An Ultra short acting opioid.pptxDr. Ravikiran H M Gowda
 
Interdisciplinary_Insights_Data_Collection_Methods.pptx
Interdisciplinary_Insights_Data_Collection_Methods.pptxInterdisciplinary_Insights_Data_Collection_Methods.pptx
Interdisciplinary_Insights_Data_Collection_Methods.pptxPooja Bhuva
 
SOC 101 Demonstration of Learning Presentation
SOC 101 Demonstration of Learning PresentationSOC 101 Demonstration of Learning Presentation
SOC 101 Demonstration of Learning Presentationcamerronhm
 
80 ĐỀ THI THỬ TUYỂN SINH TIẾNG ANH VÀO 10 SỞ GD – ĐT THÀNH PHỐ HỒ CHÍ MINH NĂ...
80 ĐỀ THI THỬ TUYỂN SINH TIẾNG ANH VÀO 10 SỞ GD – ĐT THÀNH PHỐ HỒ CHÍ MINH NĂ...80 ĐỀ THI THỬ TUYỂN SINH TIẾNG ANH VÀO 10 SỞ GD – ĐT THÀNH PHỐ HỒ CHÍ MINH NĂ...
80 ĐỀ THI THỬ TUYỂN SINH TIẾNG ANH VÀO 10 SỞ GD – ĐT THÀNH PHỐ HỒ CHÍ MINH NĂ...Nguyen Thanh Tu Collection
 
NO1 Top Black Magic Specialist In Lahore Black magic In Pakistan Kala Ilam Ex...
NO1 Top Black Magic Specialist In Lahore Black magic In Pakistan Kala Ilam Ex...NO1 Top Black Magic Specialist In Lahore Black magic In Pakistan Kala Ilam Ex...
NO1 Top Black Magic Specialist In Lahore Black magic In Pakistan Kala Ilam Ex...Amil baba
 
Fostering Friendships - Enhancing Social Bonds in the Classroom
Fostering Friendships - Enhancing Social Bonds  in the ClassroomFostering Friendships - Enhancing Social Bonds  in the Classroom
Fostering Friendships - Enhancing Social Bonds in the ClassroomPooky Knightsmith
 
Unit 3 Emotional Intelligence and Spiritual Intelligence.pdf
Unit 3 Emotional Intelligence and Spiritual Intelligence.pdfUnit 3 Emotional Intelligence and Spiritual Intelligence.pdf
Unit 3 Emotional Intelligence and Spiritual Intelligence.pdfDr Vijay Vishwakarma
 
Single or Multiple melodic lines structure
Single or Multiple melodic lines structureSingle or Multiple melodic lines structure
Single or Multiple melodic lines structuredhanjurrannsibayan2
 
TỔNG ÔN TẬP THI VÀO LỚP 10 MÔN TIẾNG ANH NĂM HỌC 2023 - 2024 CÓ ĐÁP ÁN (NGỮ Â...
TỔNG ÔN TẬP THI VÀO LỚP 10 MÔN TIẾNG ANH NĂM HỌC 2023 - 2024 CÓ ĐÁP ÁN (NGỮ Â...TỔNG ÔN TẬP THI VÀO LỚP 10 MÔN TIẾNG ANH NĂM HỌC 2023 - 2024 CÓ ĐÁP ÁN (NGỮ Â...
TỔNG ÔN TẬP THI VÀO LỚP 10 MÔN TIẾNG ANH NĂM HỌC 2023 - 2024 CÓ ĐÁP ÁN (NGỮ Â...Nguyen Thanh Tu Collection
 
Jamworks pilot and AI at Jisc (20/03/2024)
Jamworks pilot and AI at Jisc (20/03/2024)Jamworks pilot and AI at Jisc (20/03/2024)
Jamworks pilot and AI at Jisc (20/03/2024)Jisc
 
Google Gemini An AI Revolution in Education.pptx
Google Gemini An AI Revolution in Education.pptxGoogle Gemini An AI Revolution in Education.pptx
Google Gemini An AI Revolution in Education.pptxDr. Sarita Anand
 

Recently uploaded (20)

Exploring_the_Narrative_Style_of_Amitav_Ghoshs_Gun_Island.pptx
Exploring_the_Narrative_Style_of_Amitav_Ghoshs_Gun_Island.pptxExploring_the_Narrative_Style_of_Amitav_Ghoshs_Gun_Island.pptx
Exploring_the_Narrative_Style_of_Amitav_Ghoshs_Gun_Island.pptx
 
Application orientated numerical on hev.ppt
Application orientated numerical on hev.pptApplication orientated numerical on hev.ppt
Application orientated numerical on hev.ppt
 
How to Create and Manage Wizard in Odoo 17
How to Create and Manage Wizard in Odoo 17How to Create and Manage Wizard in Odoo 17
How to Create and Manage Wizard in Odoo 17
 
Sociology 101 Demonstration of Learning Exhibit
Sociology 101 Demonstration of Learning ExhibitSociology 101 Demonstration of Learning Exhibit
Sociology 101 Demonstration of Learning Exhibit
 
How to Manage Global Discount in Odoo 17 POS
How to Manage Global Discount in Odoo 17 POSHow to Manage Global Discount in Odoo 17 POS
How to Manage Global Discount in Odoo 17 POS
 
Basic Civil Engineering first year Notes- Chapter 4 Building.pptx
Basic Civil Engineering first year Notes- Chapter 4 Building.pptxBasic Civil Engineering first year Notes- Chapter 4 Building.pptx
Basic Civil Engineering first year Notes- Chapter 4 Building.pptx
 
ICT role in 21st century education and it's challenges.
ICT role in 21st century education and it's challenges.ICT role in 21st century education and it's challenges.
ICT role in 21st century education and it's challenges.
 
UGC NET Paper 1 Mathematical Reasoning & Aptitude.pdf
UGC NET Paper 1 Mathematical Reasoning & Aptitude.pdfUGC NET Paper 1 Mathematical Reasoning & Aptitude.pdf
UGC NET Paper 1 Mathematical Reasoning & Aptitude.pdf
 
Kodo Millet PPT made by Ghanshyam bairwa college of Agriculture kumher bhara...
Kodo Millet  PPT made by Ghanshyam bairwa college of Agriculture kumher bhara...Kodo Millet  PPT made by Ghanshyam bairwa college of Agriculture kumher bhara...
Kodo Millet PPT made by Ghanshyam bairwa college of Agriculture kumher bhara...
 
REMIFENTANIL: An Ultra short acting opioid.pptx
REMIFENTANIL: An Ultra short acting opioid.pptxREMIFENTANIL: An Ultra short acting opioid.pptx
REMIFENTANIL: An Ultra short acting opioid.pptx
 
Interdisciplinary_Insights_Data_Collection_Methods.pptx
Interdisciplinary_Insights_Data_Collection_Methods.pptxInterdisciplinary_Insights_Data_Collection_Methods.pptx
Interdisciplinary_Insights_Data_Collection_Methods.pptx
 
SOC 101 Demonstration of Learning Presentation
SOC 101 Demonstration of Learning PresentationSOC 101 Demonstration of Learning Presentation
SOC 101 Demonstration of Learning Presentation
 
80 ĐỀ THI THỬ TUYỂN SINH TIẾNG ANH VÀO 10 SỞ GD – ĐT THÀNH PHỐ HỒ CHÍ MINH NĂ...
80 ĐỀ THI THỬ TUYỂN SINH TIẾNG ANH VÀO 10 SỞ GD – ĐT THÀNH PHỐ HỒ CHÍ MINH NĂ...80 ĐỀ THI THỬ TUYỂN SINH TIẾNG ANH VÀO 10 SỞ GD – ĐT THÀNH PHỐ HỒ CHÍ MINH NĂ...
80 ĐỀ THI THỬ TUYỂN SINH TIẾNG ANH VÀO 10 SỞ GD – ĐT THÀNH PHỐ HỒ CHÍ MINH NĂ...
 
NO1 Top Black Magic Specialist In Lahore Black magic In Pakistan Kala Ilam Ex...
NO1 Top Black Magic Specialist In Lahore Black magic In Pakistan Kala Ilam Ex...NO1 Top Black Magic Specialist In Lahore Black magic In Pakistan Kala Ilam Ex...
NO1 Top Black Magic Specialist In Lahore Black magic In Pakistan Kala Ilam Ex...
 
Fostering Friendships - Enhancing Social Bonds in the Classroom
Fostering Friendships - Enhancing Social Bonds  in the ClassroomFostering Friendships - Enhancing Social Bonds  in the Classroom
Fostering Friendships - Enhancing Social Bonds in the Classroom
 
Unit 3 Emotional Intelligence and Spiritual Intelligence.pdf
Unit 3 Emotional Intelligence and Spiritual Intelligence.pdfUnit 3 Emotional Intelligence and Spiritual Intelligence.pdf
Unit 3 Emotional Intelligence and Spiritual Intelligence.pdf
 
Single or Multiple melodic lines structure
Single or Multiple melodic lines structureSingle or Multiple melodic lines structure
Single or Multiple melodic lines structure
 
TỔNG ÔN TẬP THI VÀO LỚP 10 MÔN TIẾNG ANH NĂM HỌC 2023 - 2024 CÓ ĐÁP ÁN (NGỮ Â...
TỔNG ÔN TẬP THI VÀO LỚP 10 MÔN TIẾNG ANH NĂM HỌC 2023 - 2024 CÓ ĐÁP ÁN (NGỮ Â...TỔNG ÔN TẬP THI VÀO LỚP 10 MÔN TIẾNG ANH NĂM HỌC 2023 - 2024 CÓ ĐÁP ÁN (NGỮ Â...
TỔNG ÔN TẬP THI VÀO LỚP 10 MÔN TIẾNG ANH NĂM HỌC 2023 - 2024 CÓ ĐÁP ÁN (NGỮ Â...
 
Jamworks pilot and AI at Jisc (20/03/2024)
Jamworks pilot and AI at Jisc (20/03/2024)Jamworks pilot and AI at Jisc (20/03/2024)
Jamworks pilot and AI at Jisc (20/03/2024)
 
Google Gemini An AI Revolution in Education.pptx
Google Gemini An AI Revolution in Education.pptxGoogle Gemini An AI Revolution in Education.pptx
Google Gemini An AI Revolution in Education.pptx
 

A knowledge-based model for identifying and mapping tropical wetlands and peatlands: areas, depths, and volumes

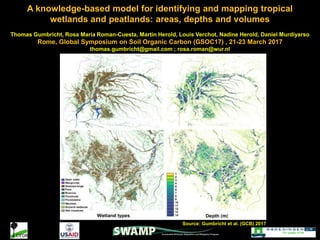
  • 1. A knowledge-based model for identifying and mapping tropical wetlands and peatlands: areas, depths and volumes Thomas Gumbricht, Rosa María Roman-Cuesta, Martin Herold, Louis Verchot, Nadine Herold, Daniel Murdiyarso Rome, Global Symposium on Soil Organic Carbon (GSOC17) , 21-23 March 2017 thomas.gumbricht@gmail.com ; rosa.roman@wur.nl Source: Gumbricht et al. (GCB) 2017
  • 2. Dr. Thomas Gumbricht: Karttur AB, Stockholm, Sweden thomas.gumbricht@gmail.com More methodological information and maps available at: http://www.karttur.com/ Data download at SWAMP website: http://www.cifor.org/global-wetlands/ Publications • Gumbricht et al. (2002) Remote sensing to detect sub-surface peat firs and peat fire scars in the Okavango Delta, Botswana. South African Journal of Science, 98,351-358. • Gumbricht T (2015) Hybrid mapping of pantropical wetlands from optical satellite images, hydrology and geomorphology. In: Remote Sensing of Wetlands: Applications and Advances. (eds Ralph W. Tiner, Megan W. Lang, Victor V. Klemas), pp 433-452. CRP Press. Taylor and Francis Group. Boca Raton, Florida. • Gumbricht T (2016) Soil Moisture Dynamics Estimated from Modis Time Series Images. In: Multitemporal Remote Sensing. Remote Sensing and Digital Image Processing (ed Y Ban). Springer International Publishing, Cham, Switzerland. DOI 10.1007/978-3-319-47037-5_12. • Gumbricht et al. (2017) An expert system model for mapping tropical wetlands and peatlands reveals South America as the largest Contributor. Global Change Biology. DOI: 10.1111/gcb.13689
  • 3. Index • Maps produced & validation • The expert system model • The biophysical indices • Known errors, caveats and possible improvements
  • 4. Tropical maps of wetlands and peatlands General characteristics: • 3 maps: wetlands, peatlands, depths • 9 maps for individual wetland types (1-100%) • 236m • 38° N to 56° S; 161° E to 117° W (tropics and subtropics), includes 146 countries but excludes small islands. Peat: ≥50% organic matter (30% carbon content), ≥30cm thick. Gumbricht et al. 2017 vs Page et al. 2011 Tropical peat area : 3-fold increase Tropical peat volumes and stocks: 4-fold increase The highest continental contribution (area and volume) corresponds to South America, Brazil, not to SE-Asia, Indonesia Source: Gumbricht et al. (2017) An expert system model for mapping tropical wetlands and peatlands reveals South America as the largest Contributor. Global Change Biology. DOI: 10.1111/gcb.13689
  • 5. Examples of area and depth for the two largest peat deposits in the tropics, outside Asia Cuvette Central DRC-Congo Pastaza-Marañón in Peru Area (km2) (other study) Area (km2) (this study) 35,600 40,838 145,500 125,440 Volume (km3) (other study) Volume (km3) (this study) 70,7 257 600 915 Depth (m) (other study) Depth (m) (this study) 2,0 6,3 4.2 6.9 Pastaza-Marañón (Draper et al 2015) Congo Basin (Dargie et al 2017) Pastaza-Marañón (Draper et al 2015) Congo Basin (Dargie et al 2017) Pastaza-Marañón (Draper et al 2015) Congo Basin (Dargie et al 2017)
  • 6. Some under-reported peatlands in the tropics Latin America (Amazon Basin, Argentina Río de la Plata, Paraná River Basins) Asia (All river deltas, Bangladesh, Indonesia Papua) Africa (Cuvette-Central, Niger, Angola, Zambia, Botswana, Sudan)
  • 7. Total area (km2) Volume (km3) Depth (m) Stocks** (GtC) Tropics Page et al. (2011) 0.44 mill (0.39-0.66) 1,758 (1,585-1,822) 2.3 89 Tropics Gumbricht et al. (2017)* 1.5 x3 mill 6,610 x4 (5,765-7,079) 2.5 352 x4 Indonesia Page et al. (2011) 206,950 (206,950-270,630) 1,138 (1,138-1,157) 5.5 57 Indonesia Gumbricht et al. (2017) 225,420 1,388 (1,089-1,396) 4.9-6.2 70 Brazil Page et al. (2011) 25,000 (15,000-55,000) 50 (3-59) 2.0 3 Brazil Gumbricht et al. (2017) 312,250 1,489 x30 (1,218-1,512) 3.9-4.8 75 Statistics of tropical peatlands Table 1: Estimates of tropical peat variables. Source: Gumbricht et al. (GCB) 2017. * Same study area of Page et al., (2011) ** Using standard values for bulk density and carbon content Highest peat area (km2): Brazil, Indonesia, DRC, China, Colombia, Peru, USA, Bangladesh, India, Venezuela, PNG, Congo Highest peat volume (km3): Brazil, Indonesia, DRC, Peru, Congo, Colombia, Venezuela, PNG, Bangladesh, China, Malaysia, India Highest peat area Page: Indonesia, Peru, Malaysia, Brazil, Zambia, PNG, Venezuela, Sudan, Guayana, Panama, Uganda.
  • 8. Figure S2: Visual validation of our map against six major tropical peat deposits as reported in Lawson et al., (2014) Figure S1: Distribution of the peat points (n= 275) used to validate the peat maps produced with our expert system model. Numeric 65% agreement in the tropics 74% agreement in Indonesia Validation Visual There is not enough ground data available to properly validate tropical peatland maps
  • 9. The expert system model (knowledge-based predictive modeling) Considers three basic requirements for wetland/peatland development: 1. Water input exceeds the atmospheric water demand (potential evapotransp.) 2. The surface is wet or inundated for prolonged periods 3. The geomorphology allows surface water accumulation Requires data on: 1. Regional and local water balances:  Mean monthly precipitation1950-2000 from WorldClim global dataset  Evapotranspiration from CRU- East Anglia 2. Soil moisture (surface wetness phenology):  16-day BRDF–corrected MODIS (MCD43A4) for mapping the duration of wet and inundated soil conditions (ca. 250m) year 2011 (2010-2012) 3. Geomorphology:  Version 4 of the Shuttle Radar Topography Mission (SRTM) digital elevation model (DEM), prepared by CIAT (250m) Develops and parameterizes three biophysical indices per pixel, at 236m: 1. Hydrological model: Wetland Topographic Convergence Index (wTCI) topographic wetness 2. Soil moisture, wetness phenology: Transformed Wetness Index (TWI) 3. Geomorphological Index
  • 10. HydrologySoil wetness phenology Geomorphology Surface wetness + Combined Wetness Index
  • 11. Hydrological modeling: Wetland Topographic Convergence Index (wTCI) Modification of the TCI (Beven and Kirkby 1979) to account for tropical conditions Outputs: Surface runoff, ground water flow, flooding volumes The figure shows modeled versus measured discharge for 435 globally distributed runoff stations (log scale). Basic model concept: 1. Monthly vertical water balance from precipitation and reference evapotransp. (rET) 2. Routing of surplus water allowing rET to fill up while considering local slope and curvature and soil water conditions.
  • 12. Hydrological modeling: global runoff Estimated mean global runoff for the period 1950-2000.
  • 13. Hydrological modeling: flood volumes Estimated flood volumes for confined valleys (top) and alluvial plains (bottom)
  • 14. Soil moisture: Transformed Wetness Index (TWI) The two MODIS composites are made with the same algorithm and the same data, but with the vegetation signal from photosynthetic vegetation (PV) and non-PV removed from the lower panel using a unitary matrix transformation. The TWI- wetness estimates are done from the data illustrated in the lower panel Spectral unmixing: Photosynthetic Vegetation (PV), NPV, Soil brightness and water
  • 15. • The axis are the same in both illustrations, represeting soil brightness (x) and water (y) derived from the unitary matrix transformation of the original MODIS data. • The PWI = 0 is the iso-soil-wetness line, a perpendicular wetness index that helps define:  Wetness thresholds for different land covers  Differenciated TWIs for global mapping, in a linear manner. Soil moisture: Transformed Wetness Index (TWI) Soil brightness Soil brightness (Water) Illustration of the construction of TWI: Surface wetness estimation by an optimized non-linear differentiation using soil-brightness and water. DS: dark soil, LS: light soil, W: water, SDS: saturated dark soil, SLS: saturated light soil, and DMS: dry medium soil
  • 16. Transformed Wetness Index ------ > Soil moisture Basic model concept: 1. Unitary matrix transformation (spectral un-mixing) of multispectral image data to eigen vectors representing soil brightness, photosythetic vegetation (PV), non-PV and water. 2. Surface wetness estimation by an optimized non-linear differenciation using soil- brightness and water. 3. Calibration using soil moisture measurements from the the International Soil Moisture Network (ISMN) The figure shows modeled versus measured soil moisture: left original TWI, right converted to soil moisture and assimilated to mean and STD of measured time-series from ISMN.
  • 17. Soil moisture content Estimated global soil moisture content for 2011 using the Transformed Wetness Index. The conversion from the TWI raw index to soil moisture content (%) was done using data from the International Soil Moisture Network (ISMN).
  • 18. Geomorphology Digital elevation model (SRTM) Runoff and flooding volumes (note the Log-scale) Nile River and Tributary Final Outputs: geohydromorphologies + depth 1. Topography + Hydrology Case example of a topographic transect with the Nile River
  • 19. Geomorphology 2. Topographic Position Index (TPI) and Landform classes (geohydromorphologies) Topographic Position Index (TPI) at 250 and 750m along the transect Landform classes derived from multiscale analysis (250 and 750 m pixel scale) using The Topographic Position Index (TPI)
  • 20. Geomorphology 3. Landform maps and Terrain relief Landform maps help to threshold wetland occurrence and assist in wetland categorization. dome-shaped, valley-shaped, plain and planar surfaces Landform map The terrain relief is the drop in elevation between the DEM and the nearest drainage point, with the latter identified from a combination of the landform map and the runoff map. Terrain relief
  • 21. Soil moisture (TWI) + Hydrology (wTCI) + Geomorphology Topographic Convergence Index (wTCI) (runoff and flooding) + local slope and profile curvatures Nile River and Tributary hydrological wetness Nile River and Tributary Soil moisture TWI derived from MODIS time-series Response by reeds and Papyrus vegetation along time, depending on flooding and soil surface water
  • 22. Combined Wetness Index: wTCI + TWI The green line shows the combined wetness for all regions, whereas the blue line is restricted to areas that can host wetlands related to landform, terrain relief, and water blance. The index is arbitrarily scaled Identified wetlands along the transect, illustrated by showing the assigned depth. The assigned depth is maximized for different wetland categories and can never exceed the terrain relief. Identified wetlands Depth (m) Combined Wetness Index
  • 23. Depths 1. Depth has been derived from a combination of: • geomorphological data • hydrological wetness data • distance decay functions 2. Depth thresholds max-min are assigned to each wetland class
  • 24. Known errors, caveats and possible improvements • There are errors associated to the source data used in the three indices:  Hydrology (Climate data): inaccurate source data for the tropics. Suggested measure: Use of regional climate and regional calibrations.  Topography (SRTM): erroneous over dense canopies (artificially heighten) and over water bodies (artificially lowered): overestimation of soil depths in forested swamps, leading to overestimation of volumes. Measured applied: we halved the established max depth thresholds used to parameterize the different wetland types, offering thresholds of volume. Depths (m) from peat soil profiles compiled by Nadine Herold (unpublished data) and estimated by our expert system.
  • 25. Known errors, caveats and possible improvements  Soil moisture (MODIS): optical imagery misses floods and inundated soil conditions during cloud-persistent wet seasons, and overestimates moisture in areas with strong forest shadows (needle-leaf forests in particular). Underestimation of wetlands also occur in areas with dense grasses and papyrus. Suggested measure: adjustment of TWI by canopy cover, or calibration of TWI using microwave data.  Soil moisture (MODIS): temporal scale limited to 2011 (2010-2012) may have captured anomalous wet La Niña conditions leading to overestimations of peatland area. Suggested measure: Adopt a larger MODIS period for analysing soil moisture. • Lack of ground data for organic soils, as well as unstandardized definitions of wetlands and peatland jeopardizes map validation. • Peatland area estimates are higher than previously reported due to better spatial resolution (236m), multi-source method improving optical limitations, inclusion of all land covers and uses (paddy rice not excluded if swamp conditions are detected). However, hydro-geomorphological predicted areas might not accumulate peat. Fire and river dynamics are not included. Tectonics and parental material are only indirectly accounted for.
  • 26. Next steps for peatland monitoring • Regional parameterizations in the tropics to improve the accuracy of the estimates (i.e. South America, Asia, Africa). The expert system currently offers one model and one tropical parameterization (although different for each wetland). • • Inclusion of boreal peatlands: new regional parameterization • Inclusion of montane peatlands: new regional parameterization • Peatland area forecasting and sensitivity tests: the expert system can be used to forecast wetland areas under future climatic conditions.

Editor's Notes

  1. Soil wetness phenology: soil moisture Hydrology: topographic wetness Them combined offer a measure of surface wetness
  2. . We have applied the following modifications to the original definition of the TCI (Beven & Kirkby, 1979): 1) inclusion of local (cell) vertical water balances, 2) consideration of full atmospheric evapotranspiration potential, 3) lateral water inflow (Merot et al., 2003), 4) estimation of flood volumes, 5) separation of lateral ground water flow and surface water flow, and 6) definition of local topographic conditions including profile curvature and hydraulic head (Hjerdt, 2004). By eliminating different components of the local water balance, specific wTCIs were calculated for identifying different categories of wetlands, including for dome shape peat swamps (omitting surface runoff and groundwater flow), fens (omitting all lateral flow except groundwater), riverine and floodplains (omitting all lateral flow except flooding). In addition a general wTCI including all lateral flow components from the hydrological model was used for identifying other wetland categories, including most sub-categories of swamps and marshes.
  3. Illustration of the construction of TWI. The axis are the same in both illustrations, represeting soil brightness (x) and water (y) derived from the unitary matrix transformation of the original MODIS band data (previous slide). The left panel illustrates a perpendicular wetness index and estimated wetness for different types of landcover. The line indicated as PWI = 0 is the iso-soil-wetness line, that was used for formulating the differenciated TWI illustrated in the right panel. The colors of the right panel corresponds to the colors in the TWI map (next slide).
  4. Topographic Position Index (TPI) at 250 and 750 m along the transect. Positive values Indicate convex surfaces and negative concave. Coinciding positive values (at 250 and 750 m) denote a height, whereas coinciding negative denote a depression. Dependent on the values and the signs of the TPI the terrains is classified into different landform categories. The Nile channel is seen as the most concave region in the graph.
  5. TWI:The stems dry periodically out but remain standing, and the wetness signal captured by MODIS is depressed Topographic Convergence(Wetness) Index (TCI) combining estimated runoff and flooding with local slope and profile curvature for estimating hydrological wetness. The Nile valley is clearly seen, and as the hydrological model assigns reference evapotranspiration to open water bodies there is no difference between the green (orignal model) and the blue (exhausted evapotranspiration) lines.