1. Using Geographic Information Systems to Measure
Historical California Estuary Extent
Introduction
Methods
Acknowledgements
The varied California coastline needs updated restoration plans to more
effectively protect ecosystem services and maintain biodiversity. Considering
that wetlands are the second most endangered habitat in the world behind
tropical rain forests, correcting restoration efforts is urgent. In order to
formulate more effective management strategies for these critical systems,
their historical status and how they have changed over time need to be
understood. By analyzing historical topographic maps and comparing them
with current day imagery, the effects of former management techniques and
infrastructure additions can be measured. Geographic information systems
(GIS) can be utilized to gain area measurements of California estuaries
throughout recent history. This project aims to enhance the historical
understanding of these coastal systems in order to improve management
techniques.
Thank you to Professor Rachel Kennison and the Grand Challenges
Undergraduate Research Scholars Program for providing this research
opportunity and teaching me so much about the scientific process. This
research was funded by the Vice Chancellor for Research and was made
possible by a unique collaboration between the Assistant Vice Chancellor for
Research, M. Popowitz and the Director of Undergraduate Research Centers,
T. Hasson.
Future Research
ALEXA M. FORNES1 and David K. Jacobs2
1Department of Geography, University of California, Los Angeles
2Department of Ecology and Evolutionary Biology, University of California, Los Angeles
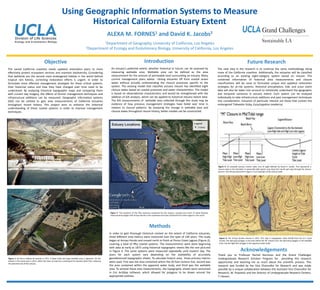
In order to gain thorough historical context on the extent of California estuaries,
three different area metrics were measured over the span of 140 years. The study
began at Arroyo Hondo and moved north to finish at Pismo Creek Lagoon (Figure 2),
covering a total of fifty coastal systems. The measurements were done beginning
with data as early as 1873 using historical topographic sheets like the one pictured
in Figure 4. The same systems were measured repeatedly until modern day. The
years for each system vary depending on the availability of accurately
georeferenced topographic sheets. To calculate historic area, three primary metrics
were used. First was the area contained within the 20 foot contour line, second was
the area contained within the apparent water body, and third was the wettable
area. To achieve these area measurements, the topographic sheets were vectorized
in Esri ArcMap software, which allowed for polygons to be drawn around the
appropriate outlines.
Figure 2: The locations of the fifty estuaries measured for this project. Located just north of Santa Barbara,
measurements began with Arroyo Hondo in the southeast and have reached Pismo Creek Lagoon in the north.
The next step in the research is to continue the same methodology along
more of the California coastline. Additionally, the estuaries will be classified
according to an existing eight-category system based on closure. The
combined information of historical area measurements and closure
classifications will be used to formulate unique and updated restoration
strategies for at-risk systems. Historical precipitation, tide, and scour event
data will also be taken into account to holistically understand the geographic
and temporal variances in estuary extent. Each system can be analyzed
individually to take infrastructure additions and past management techniques
into consideration. Estuaries of particular interest are those that contain the
endangered Tidewater Goby, Eucyclogobius newberryi.
Figure 1: On top is Cañada de Gaviota in 1972. A water body and large wettable area is apparent. On the
bottom is the same area in 2013, which has been turned into a parking lot for Gaviota State Park, reducing
the potential size of the estuary.
An estuary’s potential extent, whether historical or future, can be assessed by
measuring wettable area. Wettable area can be defined as the area
measurement for the amount of permeable land surrounding an estuary. Many
current management plans advise closing estuaries off from coastal ocean
water without actually understanding the closure processes specific to the
system. The existing model that classifies estuary closure has identified eight
closure states based on coastal processes and water characteristics. The model
is based on observational characteristics and would be strengthened with the
addition of GIS analysis, which can be applied to historical estuary extent data.
The GIS measurements of wettable area collected through this study may be
evidence of how previous management strategies have failed over time in
relation to closure patterns. By analyzing the change in wettable area and
closure states throughout recent history, better models can be constructed.
Objective
Figure 4: The Arroyo Hondo estuary in 1873. This map is topographic sheet #1338 from the U.S. Coast
Survey. The dark gray polygon is the area within the 20’ contour line, the dark blue polygon is the wettable
area, and the light blue polygon is the apparent water body.
Figure 3: An example estuary closure state, one of eight defined by David K. Jacobs. This represents a
closure state in the intertidal. A seasonally tidal system may show the mouth part-way through the closure
process. The estuary pictured in Figure 1 is an example of this closure state.