2. Intl J Agri Crop Sci. Vol., 8 (5), 686-691, 2015
687
0
0
.
.
Zx
dsZ
x
z
(3)
If at time t, advancement is equal to x, A (s, t) is the surface flow cross section at distance s from entry
point which varies between A0 to zero and also Z is the percolated surface at the distance s from the entry point
which varies between Z0 to zero (8-12).
y and z values in equations (2) and (3) change relative to time. Waliantaze has reported equations for these
coefficients as below which have been used in this paper (5 and 6):
Study of y changes
Waliantaze employed the kinematic model to investigate y changes in sloped strips and furrows equations of
which are as Follows:
01
a
aKt
x
Q
t
A
(4)
0
1
22
2
s
A
nQ
(5)
Where,
N= the manning roughness coefficient, S0=slope of the strip floor or furrow and a and K are the coefficients of
Kostianov percolation equation 1 and 2 are strip or furrow shape factors:
a
KtZ (6)
2
1
33.12
ARA (7)
That in the above equation R is the hydraulic radius.
By changing of the below variable, variables of equations 4 and 5 decrease:
rx
x
x * ,
rt
t
t * ,
rQ
Q
Q ,
rA
A
A (8)
Where:
0QQr , nr AA ,
a
r
r
K
A
t
1
, rrrr AtQx /. (9)
Where:
An= flow cross section proportionate to the normal depth (obtained employing the Manning equation as
for the flow rate Q0).
Following changing the equation 8 variables in equations 4 and 5 and their combination, a new equation
is obtained which was solved by Waliantaze via the numerical method of finite differences from solution of which
a various times, cross section changes alongside the advancement route is obtained through which using
equation 2, y can be computed at various times. Waliantaze drew the y changes relative to time, for different
a and z for which using statistical regression presented the following equation:
6.03.1
2 47.0055.08.0min
ay (10)
Where y min is the minimum y this researcher following specifying the minimum and maximum y , proposed
its changes relative to time through the following equation:
min
min
1
.
1
y
yy
a
y
t
x
(11)
By solving the above relation through the trial and error procedure, y value at any time can be computed.
Study of z changes
3. Intl J Agri Crop Sci. Vol., 8 (5), 686-691, 2015
688
To study the z changes waliantaze employed the Hall technique which has been modified by Elezba
and sterikov (1).
Using the above method, z changes relative to time for various values of a was studied. z Values
stand between the two R0 and R1 parameters. These two parameters are as follows:
a
R
1
1
0 (12)
a
aa
R
sin
1..
1
(13)
Now, if parameter s is defined as follows:
10
1
RR
R
s z
(14)
Regarding z variations, s variations will be between zero and one. Waliantaze concluded that s
variations are independent of a (while z variations are dependent on a). H attributed the s variations to the
parameter W as follows:
32
6.16.2 WWs (15)
Which
1
1
a
t
x
W (16)
Therefore in a specified time, using equations 12 to 16, z can be computed.
Using the equations presented in the previous section, VB can be employed with variable coefficients (relative to
time) and perform the water advancement computations relative to time.
To determine X in lieu specified time t, operations are performed as follows:
in exchange of a knows flow rate Q0 and shape factors 1 and 2 and strip or furrow floor slope and the Manning
roughness coefficient, A0 value is computed from the equation (5) (A0= An).
R0 and R1 values are computed using the equations 12 and 13 and the percolation function.
miny is computed using equation 10.
z and y are assumed (for the first assumption y = 0.77 and z = (R0+R1) (2)
Percolation value at the beginning following time t is computed using the Kostiakov percolation equation (Z0).
x value is computed using equation (1).
x* and t* values are computed employing the equations 8 and 9.
The W value is computed using the equation 16.
S value is computed using the equation 16.
z value is computed using the equation 14 and y values are computed using equation 11. (To compute y
, on the left side of the equation 11 instead of y , the value assumed in section 4 is placed).
with new values of z and y , the value of X is computed from the equation 11.
In case the X values computed from the stages 11 and 6 differ, computations are repeated with z and y of
stage 11 until the X values computed from the stages 11 and 6 become sufficiently close to each other. Thus,
the last X is the advancement distance at the time t and the last z and y too, is considered as the shape
factors in time t.
All the above computations in this research have been performed using a computer program.
It should be mentioned that instead of Kostiakov percolation equation it is possible to employ any other
percolation equation.
For this purpose, the following modifications should be done:
1. Z0 should be calculated using the new percolation equation
2. Instead of power a in the above method the following equation must be used.
4. Intl J Agri Crop Sci. Vol., 8 (5), 686-691, 2015
689
2
/ 5.0
Log
ZLogZ
a tt
(17)
Where:
Zs should be computed from the new percolation equation.
RESULTS
In this research, measurement of percolation speed, advancement and shape factors were performed
on seventeen farms in Isfahan the summary of which data for two types of farms is presented in the following
table.
Using the presented method and the above data, y and z variations relative to time are computed
and presented in figures 1 and 2. Also, advancement computations in various farms were done that compared
with data on field measurements; precision of the method presented in this paper is confirmed. As shown in
figures 3 and 4, the difference between results of this method and the field data is negligible.
DISCUSSION
The method presented in this paper enjoys high precision. However, this method depend on the normal
cross section to compute which the strip or furrow floor slope must be known and therefore for flat strips or furrows
(with zero slope) this method cannot be applied (13-15). On one hand, precision of the kinematic wave model in
flat and low sloped lands decreased and in this method, this model has been used to study the y variations
(16-20).
In such a condition the zero inertia models must be used.
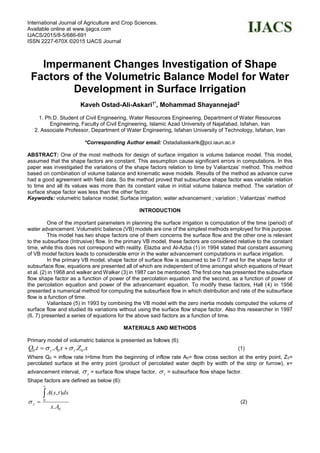
Regarding figures 1 and 2 it can be seen mean y for farms 1 and 2 was 0.73 and 0.74 respectively that
in the primary VB model its value is assumed to be 0.77. z measured by the relations presented for them is
independent of time (like Heart of walker relations) for both farms is about 0.5 while regarding figures 1 and 2,
their variations are between 0.56 to 0.74. Therefore Relations presented for z (independent from time) do not
enjoy sufficient precision. For other strips results similar to the above results were obtained (21-25).
Table 1. Data from two research fields
Soil texturenK(m/mina
)a0s mmq min//3
0
Characteristics
Silty loam clay0.080.00401580.79470.0010.135Farm 1
Clay loam0.180.00458130.79360.0050.20232Farm 2
Figure 1. Coefficient of variation on the farm (1)
5. Intl J Agri Crop Sci. Vol., 8 (5), 686-691, 2015
690
Figure 2. Coefficient of variation on the farm (2)
Figure 3. Comparison model results with field data for the farm (2)
Figure 4. Comparison model results with field data for the farm (1)
6. Intl J Agri Crop Sci. Vol., 8 (5), 686-691, 2015
691
REFERENCES
Al-Azba, A., and Strelkoff, T., 1994, Correct form of Hall technique for border irrigation advance, J. Irrig. and Drain. Engrg., 120(2):292-307.
doi: 10.1061/(ASCE)0733-9437(1994)120:2(292).
Hall, W. A., 1956, Estimating irrigation border flow, Agric. Engrg., 37(4):263-256
Hart, W. E., Basset, D. L., and Strelkoff, T., 1968, Surface irrigation hydraulics-kinematics, J. Irrig. and Drain. Engrg., 94(4):419-440.
Ostad-Ali-Askari K, Shayannejad M, Golabchian M. Numerical methods in groundwater. Kankash publisher. First edition, 2015.
Ostad-Ali-Askari K. Groundwater. Horoufchin publisher, First Edition, 2015.
Ostad-Ali-Askari K. Nitrate pollution in groundwater. Horoufchin publisher, First Edition, 2015.
Ostad-Ali-Askari, K., Shayannejad, M. 2015, Presenting a Mathematical Model for Estimating the Deep Percolation Due to Irrigation.
International Journal of Hydraulic Engineering, 4(1), 17-21.
Ostad-Ali-Askari, K., Shayannejad, M. 2015, Study of sensitivity of Autumnal wheat to under irrigation in Shahrekord, Shahrekord City, Iran.
International Journal of Agriculture and Crop Sciences , 8 (4), 602-605.
Ostad-Ali-Askari, K., Shayannejad, M. 2015, Study of sensitivity of Autumnal wheat to under irrigation in Shahrekord, Shahrekord City,Iran.
International Journal of Agriculture and Crop Sciences.,8(4), 602-605.
Ostad-Ali-Askari, K., Shayannejad, M. 2015, The Reviews of Einstein's Equation of Logarithmic Distribution Platform and the Process
of Changes in the Speed Range of the Karkheh River, Khuzestan province, Iran. International Journal of Development Research,
5(3), 3786-3790.
Ostad-Ali-Askari, K., Shayannejad, M. 2015, Usage of rockfill dams in the HEC-RAS software for the purpose of controlling floods. American
Journal of Fluid Dynamics,5(1), 23-29.
Ostad-Ali-Askari, K., Shayannejad, M. 2015, Developing an Optimal Design Model of Furrow Irrigation Based on the Minimum Cost and
Maximum Irrigation Efficiency. International Bulletin of Water Resources & Development , 3(2), 18-23.
Ostad-Ali-Askari, K., Shayannejad, M. 2015, The Study of Mixture Design for Foam Bitumen and the Polymeric and Oil Materials Function in
Loose Soils Consolidation. Journal of Civil Engineering Research, 5(2), 39-44.
Ostad-Ali-Askari, K., Shayannejad, M., Ghorbanizadee-Kharazi, H. 2015, Assessment of artificial neural network performance and
exponential regression in prediction of effective rainfall, International Journal of Development Research, 5(3),3791-3794
Raeisi-Vanani, H., Soltani Todeshki, A. R., Ostad-Ali- Askari, K., Shayannejad, M. 2015, The effect of heterogeneity due to inappropriate
tillage on water advance and recession in furrow irrigation. Journal of Agricultural Science, 7(6), 127-136.
Sayedipour, M., Ostad-Ali-Askari, K., Shayannejad, M. 2015, Recovery of Run off of the Sewage Refinery, a Factor for Balancing the Isfahan-
Borkhar Plain Water Table in Drought Crisis Situation in Isfahan Province-Iran. American Journal of Environmental Engineering, 5(2):
43-46.
Shayannejad M, Ostad-Ali-Askari K. Modeling of solute movement in groundwater. Kankash publisher. First edition, 2015.
Shayannejad M, Ostad-Ali-Askari K. Optimization and its application in water resources management. Kankash publisher. First edition, 2015.
Shayannejad, M. Akbari, N. and Ostad-Ali-Askari, K. 2015, Determination of the nonlinear Muskingum model coefficients using genetic
algorithm and numerical solution of the continuity. Int. J. of Science: Basic and Applied Research, 21(1),1-14.
Shayannejad, M., Akbari, N., Ostad-Ali-Askari, K. 2015, Study of modifications of the river physical specifications on muskingum coefficients,
through employment of genetic algorithm. International Journal of Development Research , 5(3), 3782-3785.
Soltani-Todeshki, A. R., Raeisi-Vanani, H., Shayannejad, M., Ostad-Ali-Askari, K. 2015, Effects of magnetized municipal effluent on some
chemical properties of soil in furrow irrigation. International Journal of Agriculture and Crop Sciences, 8(3), 482-489.
Valiantzas, J. D., 1993, Border advance using improved volume balance model, J. Irrig. and Drain. Engrg. 119(6):1006-1013. doi:
10.1061/(ASCE)0733-9437(1993)119:6(1006)
Valiantzas, J. D., 1997, Surface irrigation advance equation: variation of subsurface shape factor, J. Irrig. and Drain. Engrg. 123(4):300-
306. doi: 10.1061/(ASCE)0733-9437(1997)123:4(300).
Valiantzas, J. D., 1997, Volume balance irrigation advance equation: variation of surface shape factor, J. Irrig. and Drain. Engrg. 123(4):307-
312. doi: 10.1061/(ASCE)0733-9437(1997)123:4(307)
Walker, W. R., and Skogerboe, G. V., 1987, Surface Irrigation Theory And Practice, Prentice-Hall Inc., Englewood Cliffs, N. J.