
Recommended
Recommended
More Related Content
What's hot
What's hot (10)
Viewers also liked
Viewers also liked (16)
Similar to Data correlationforspheredrag2013
Similar to Data correlationforspheredrag2013 (20)
Recently uploaded
Recently uploaded (20)
Data correlationforspheredrag2013
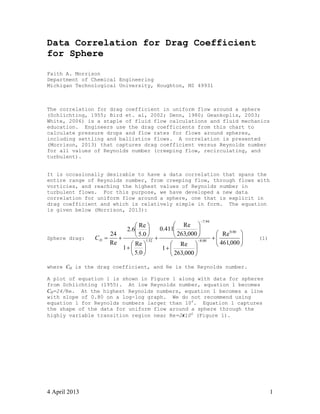
- 1. 4 April 2013 1 Data Correlation for Drag Coefficient for Sphere Faith A. Morrison Department of Chemical Engineering Michigan Technological University, Houghton, MI 49931 The correlation for drag coefficient in uniform flow around a sphere (Schlichting, 1955; Bird et. al, 2002; Denn, 1980; Geankoplis, 2003; White, 2006) is a staple of fluid flow calculations and fluid mechanics education. Engineers use the drag coefficients from this chart to calculate pressure drops and flow rates for flows around spheres, including settling and ballistics flows. A correlation is presented (Morrison, 2013) that captures drag coefficient versus Reynolds number for all values of Reynolds number (creeping flow, recirculating, and turbulent). It is occasionally desirable to have a data correlation that spans the entire range of Reynolds number, from creeping flow, through flows with vorticies, and reaching the highest values of Reynolds number in turbulent flows. For this purpose, we have developed a new data correlation for uniform flow around a sphere, one that is explicit in drag coefficient and which is relatively simple in form. The equation is given below (Morrison, 2013): Sphere drag: 000,461 Re 000,263 Re 1 000,263 Re 411.0 0.5 Re 1 0.5 Re 6.2 Re 24 80.0 00.8 94.7 52.1DC (1) where CD is the drag coefficient, and Re is the Reynolds number. A plot of equation 1 is shown in Figure 1 along with data for spheres from Schlichting (1955). At low Reynolds number, equation 1 becomes CD=24/Re. At the highest Reynolds numbers, equation 1 becomes a line with slope of 0.80 on a log-log graph. We do not recommend using equation 1 for Reynolds numbers larger than 106 . Equation 1 captures the shape of the data for uniform flow around a sphere through the highly variable transition region near Re=2x10⁶ (Figure 1).
- 2. 4 April 2013 2 Figure 1: Equation 1 (Morrison, 2013) captures drag coefficient as a function of Reynolds number over the entire Reynolds-number range of the available experimental data. Also shown are data for uniform flow around a sphere (Schlichting, 1955). Use beyond Re=106 is not recommended; for Re<2 equation 1 follows the creeping-flow result (CD=24/Re). References: R. B. Bird, W. Stewart, and E. Lightfoot, Transport Phenomena, 2nd edition (John Wiley & Sons: New York, 2002). M. M. Denn, Process Fluid Mechanics (Prentice-Hall: Englewood Cliffs, NJ, 1980). C. J. Geankoplis, Transport Processes and Unit Operations, 4th edition, (Prentice Hall: Englewood Clifs, NY, 2003). F. A. Morrison, An Introduction to Fluid Mechanics, (Cambridge University Press, New York, 2013). This correlation appears in Figure 8.13 on page 625. H. Schlichting, Boundary Layer Theory, (McGraw-Hill, New York, 1955). F. M. White, Fluid Mechanics, 6th edition (McGraw-Hill, Inc.: New York, 2006). Available as: Faith A. Morrison, “Data Correlation for Drag Coefficient for Sphere,” Department of Chemical Engineering, Michigan Technological University, Houghton, MI, www.chem.mtu.edu/~fmorriso/DataCorrelationForSphereDrag2013.pdf. 0.01 0.1 1 10 100 1000 10000 0.01 0.1 1 10 100 1000 10000 1E+0 5 1E+0 6 1E+0 7 Re CD 104 105 106 107 000,461 Re 000,263 Re 1 000,263 Re 411.0 0.5 Re 1 0.5 Re 6.2 Re 24 80.0 00.8 94.7 52.1DC sphere