SlideShare a Scribd company logo
1 of 69
Download to read offline
1
TABLE OF CONTENTS
1. INTRODUCTION .................................................................................................................................................................................... 2
2. RATIONALE OF THE STUDY............................................................................................................................................................ 2
3. OBJECTIVES ............................................................................................................................................................................................ 3
4. SOURCES OF DATA .............................................................................................................................................................................. 3
5. METHODOLOGY.................................................................................................................................................................................... 4
6. FINDINGS OF THE RATIO ANALYSIS........................................................................................................................................... 5
6.1. Liquidity Ratio............................................................................................................................................................................. 5
6.1.1. Current ratio ..................................................................................................................................................................... 5
6.1.2. Quick Ratio......................................................................................................................................................................... 5
6.1.3. Debt Ratio........................................................................................................................................................................... 6
6.2. Profitability/Performance..................................................................................................................................................... 7
6.2.1. Gross Profit Margin........................................................................................................................................................ 7
6.2.2. Net Profit Margin ............................................................................................................................................................ 8
6.2.3. Return on Asset (ROA) ................................................................................................................................................. 8
6.2.4. Return on Equity (ROE) ............................................................................................................................................... 9
6.3. Activity Ratio .............................................................................................................................................................................10
6.3.1. Account Receivables Turnover...............................................................................................................................10
6.3.2. Average Collection Period.........................................................................................................................................10
6.3.3. Inventory Turnover .....................................................................................................................................................11
6.3.4. Inventory Turnover in days .....................................................................................................................................12
6.3.5. Payable Turnover .........................................................................................................................................................12
6.3.6. Payable Turnover in Days.........................................................................................................................................13
6.3.7. Operating Cycle..............................................................................................................................................................13
6.4. Market Performance...............................................................................................................................................................13
6.4.1. EPS.......................................................................................................................................................................................13
6.4.2. Payout Ratio....................................................................................................................................................................14
6.4.3. PE Ratio.............................................................................................................................................................................14
CONCLUSION...................................................................................................................................................................................................15
ANNEXURE -I (BALANCE SHEET OF Daffodil Computers).........................................................................................................16
ANNEXURE-II (BALANCE SHEET OF INFORMATION SERVICES NETWORK) ...................................................................35
ANNEXURE-III (BALANCE SHEET OF BDCOM ONLINE LIMITED)..........................................................................................55
2
1. INTRODUCTION
A sustainable business and mission requires effective planning and financial management. Ratio
analysis is a useful management tool that will improve your understanding of financial results and
trends over time, and provide key indicators of organizational performance. Managers will use ratio
analysis to pinpoint strengths and weaknesses from which strategies and initiatives can be formed.
Funders may use ratio analysis to measure your results against other organizations or make
judgments concerning management effectiveness and mission impact.
For ratios to be useful and meaningful, they must be:
 Calculated using reliable, accurate financial information (does your financial
information reflect your true cost picture?)
 Calculated consistently from period to period.
 Used in comparison to internal benchmarks and goals o Used in comparison to other
companies in your industry.
 Viewed both at a single point in time and as an indication of broad trends and issues
over time.
 Carefully interpreted in the proper context, considering there are many other important
factors and indicators involved in assessing performance.
Ratios can be divided into four major categories:
 Profitability Sustainability
 Operational Efficiency
 Liquidity
 Leverage (Funding – Debt, Equity, Grants)
The ratios presented below represent some of the standard ratios used in business practice and are
provided as guidelines. Not all these ratios will provide the information you need to support your
particular decisions and strategies. You can also develop your own ratios and indicators based on
what you consider important and meaningful to your organization and stakeholders.
2. RATIONALE OF THE STUDY
A widely held view is that the growth of the ICT industry may provide an opportunity for
developing countries to leapfrog into the industrialized economy. For example, low-income
economies that have a strong human capital base can take advantage of the rapid decline in the cost
3
of computing power and telecommunication over the last decade that has made it possible to
deliver IT service from a remote location.
There is considerable potential for the development of ICT industries in Bangladesh because of the
availability of trained personnel at relatively low wage rates. The present government of
Bangladesh envisions creating a Digital Bangladesh by , which critically depends on proper
policies as well as infrastructure development for this sector. However, in order to capture
significant gains from the growth of the ICT industry worldwide, policy makers and firms both
require a clear understanding of its dynamics. While a cheap and abundant human capital base can
explain the early stage of software industry development, improved productivity is required to take
advantage of emerging opportunities and carve out a niche in the export of outsourced services.
3. OBJECTIVES
This Study will examine the financial statement and analysis its financial prospects in terms of
liquidity, debt, company performance, efficiency and the market performance of the market.
4. SOURCES OF DATA
The main data source is the published annual reports of DAFODILCOM (Daffodil Computers Ltd.),
ISNLTD (Information Services Network Ltd.), and BDCOM (BDCOM Online limited) for the year
ended 2007, 2008, 2009, 2010 and 2011.
4
5. METHODOLOGY
The Financial Ratios:
I. Liquidity Ratio
i) Current Ratio
ii) Quick Ratio
II. Debt Ratio
i) Debt-to-equity
ii) Debt-to-Total Asset
III. Profitability/Performance
i) Gross Profit Margin
ii) Net Profit Margin
iii) Return on Asset (ROA)
iv) Return on Equity (ROE)
IV. Activity Ratio
i) Account Receivables Turnover
ii) Average Collection Period
iii) Inventory Turnover
iv) Inventory Turnover in days
v) Payable Turnover
vi) Payable Turnover in Days
vii) Operating Cycle
V. Market Performance
i) EPS
ii) Payout Ratio
iii) PE Ratio
5
6. FINDINGS OF THE RATIO ANALYSIS
6.1. Liquidity Ratio
In a nutshell, a company's liquidity is its ability to meet its near-term obligations, and it is a major
measure of financial health. Liquidity can be measured through several ratios.
6.1.1. Current ratio
The current ratio is the most basic liquidity test. It signifies a company's ability to meet its short-
term liabilities with its short-term assets. A current ratio greater than or equal to one indicates that
current assets should be able to satisfy near-term obligations. A current ratio of less than one may
mean the firm has liquidity issues.
Current Ratio = (Current Assets) / Current Liabilities
Current ratio
Company/Years 2007 2008 2009 2010 2011 Average
DAFODILCOM 2.51 1.42 1.71 1.84 2.66 2.03
ISNLTD 3.12 4.96 6.11 2.87 2.09 3.83
BDCOM 7.18 7.01 1.62 1.56 4.65 4.40
Table 1: Current ratio
Among the three companies BDCOM online Ltd. is more liquid then ISNLTD and then DAFODIL.
6.1.2. Quick Ratio
The quick ratio is a tougher test of liquidity than the current ratio. It eliminates certain current
assets such as inventory and prepaid expenses that may be more difficult to convert to cash. Like
the current ratio, having a quick ratio above one means a company should have little problem with
liquidity. The higher the ratio, the more liquid it is, and the better able the company will be to ride
out any downturn in its business.
Quick Ratio = (Cash + Accounts Receivable + Short-Term or Marketable Securities) / (Current
Liabilities)
6
Acid test ratio
Company/Years 2007 2008 2009 2010 2011 Average
DAFODILCOM 1.97 1.37 0.81 1.22 2.20 1.51
ISNLTD 3.12 4.96 6.11 2.87 2.09 3.83
BDCOM 6.06 5.76 1.37 1.30 4.22 3.74
Table 2: Acid test ratio
The quick ratio also behalf like the current ratio. Among the three companies BDCOM online Ltd. is
more liquid then ISNLTD and then DAFODIL. One interesting observation is the Current and Quick
ratios of all selected year are same, because of null inventories in their operations.
Ranking in terms of Liquidity
Rank Current ratio Acid test ratio
1 BDCOM ISNLTD
2 ISNLTD BDCOM
3 DAFODILCOM DAFODILCOM
Table 3: Ranking in terms of Liquidity
6.1.3. Debt Ratio
The debt ratio compares a company's total debt to its total assets, which is used to gain a general
idea as to the amount of leverage being used by a company. A low percentage means that the
company is less dependent on leverage, i.e., money borrowed from and/or owed to others. The
lower the percentage, the less leverage a company is using and the stronger its equity position. In
general, the higher the ratio, the more risk that company is considered to have taken on.
Total debt to equity ratio
Company/Years 2007 2008 2009 2010 2011 Average
DAFODILCOM 39.00% 39.00% 23.00% 22.00% 24.00% 29.00%
ISNLTD 24.00% 14.00% 7.00% 20.00% 31.00% 19.00%
BDCOM 7.00% 8.00% 33.00% 33.00% 11.00% 18.00%
Table 4: Total debt to equity ratio
DAFODILCOM have comparatively higher debt portion relative to the equity than other two
companies. It might not be normal compared to the industry and which might put the firm under
risk but indicate high leverage.
7
Debt-to-Total Asset
Company/Years 2007 2008 2009 2010 2011 Average
DAFODILCOM 39.91% 70.47% 58.42% 54.42% 37.59% 52.16%
ISNLTD 32.10% 20.17% 16.38% 34.84% 47.94% 30.29%
BDCOM 13.94% 14.26% 61.86% 64.15% 21.49% 35.14%
Table 5: Debt-to-Total Asset
DAFODILCOM also have comparatively higher debt portion relative to the Assets than other two
companies. It seems using more debt compared to the industry and which might put the firm under
risk pressure but indicate high leverage.
Ranking in terms of high leverage
Rank Total debt to equity ratio Debt-to-Total Asset
1 DAFODILCOM DAFODILCOM
2 ISNLTD BDCOM
3 BDCOM ISNLTD
Table 6: Ranking in terms of high leverage
6.2. Profitability/Performance
Every firm is most concerned with its profitability. One of the most frequently used tools of
financial ratio analysis is profitability ratios which are used to determine the company's bottom
line. Profitability measures are important to company managers and owners alike. If a small
business has outside investors who have put their own money into the company, the primary
owner certainly has to show profitability to those equity investors.
6.2.1. Gross Profit Margin
The gross profit margin looks at cost of goods sold as a percentage of sales. This ratio looks at how
well a company controls the cost of its inventory and the manufacturing of its products and
subsequently passes on the costs to its customers. The larger the gross profit margin, the better for
the company. The calculation is: Gross Profit/Net Sales = ____%. Both terms of the equation come
from the company's income statement.
8
Gross Profit Margin
Company/Years 2007 2008 2009 2010 2011 Average
DAFODILCOM 19.16% 19.16% 19.93% 18.71% 21.72% 19.74%
ISNLTD 45.93% 51.38% 44.47% 49.62% 47.85% 47.85%
BDCOM 65.35% 67.03% 73.94% 68.38% 63.16% 67.57%
Table 7: Gross Profit Margin
Higher GPM indicates higher profitability of the firm.
6.2.2. Net Profit Margin
When doing a simple profitability ratio analysis, net profit margin is the most often margin ratio
used. The net profit margin shows how much of each sales dollar shows up as net income after all
expenses are paid. For example, if the net profit margin is 5% that means that 5 cents of every
dollar is profit. The net profit margin measures profitability after consideration of all expenses
including taxes, interest, and depreciation. The calculation is: Net Income/Net Sales = _____%. Both
terms of the equation come from the income statement.
Net Profit Margin
Company/Years 2007 2008 2009 2010 2011 Average
DAFODILCOM 4.72% 4.04% 6.05% 6.29% 12.39% 6.70%
ISNLTD 22.56% 24.35% 20.56% 19.43% 10.53% 19.49%
BDCOM 6.87% 7.84% 7.76% 9.46% 16.29% 9.65%
Table 8: Net Profit Margin
Here also higher NPM indicates higher profitability of the firm.
6.2.3. Return on Asset (ROA)
The Return on Assets ratio is an important profitability ratio because it measures the efficiency
with which the company is managing its investment in assets and using them to generate profit. It
measures the amount of profit earned relative to the firm's level of investment in total assets. The
return on assets ratio is related to the asset management category of financial ratios. The
calculation for the return on assets ratio is: Net Income/Total Assets = _____%. Net Income is taken
from the income statement and total assets are taken from the balance sheet.
9
Return on Asset
Company/Years 2007 2008 2009 2010 2011 Average
DAFODILCOM 3.67% 3.06% 5.32% 4.45% 5.21% 4.34%
ISNLTD 9.33% 9.50% 5.81% 4.97% 2.62% 6.45%
BDCOM 2.96% 3.42% 2.81% 5.04% 6.02% 4.05%
Table 9: Return on Asset
The higher the percentage, the better the firm s asset utilization to earn, because that means the
company is doing a good job using its assets to generate sales.
6.2.4. Return on Equity (ROE)
The Return on Equity ratio is perhaps the most important of all the financial ratios to investors in
the company. It measures the return on the money the investors have put into the company. This is
the ratio potential investors look at when deciding whether or not to invest in the company. The
calculation is: Net Income/Stockholder's Equity = _____%. Net income comes from the income
statement and stockholder's equity comes from the balance sheet.
Return on Equity
Company/Years 2007 2008 2009 2010 2011 Average
DAFODILCOM 5.11% 3.70% 5.65% 5.44% 6.45% 5.27%
ISNLTD 11.56% 10.84% 6.23% 5.96% 3.42% 7.60%
BDCOM 3.17% 3.71% 3.74% 6.69% 6.68% 4.80%
Table 10: Return on Equity
In general, the higher the percentage, the better earning capability against its equity, with some
exceptions, as it shows that the company is doing a good job using the investors' money.
Ranking in terms of Profitability & Performance
Rank Gross Profit Margin Net Profit Margin Return on Asset Return on Equity
1 BDCOM ISNLTD ISNLTD ISNLTD
2 ISNLTD DAFODILCOM BDCOM BDCOM
3 DAFODILCOM BDCOM DAFODILCOM DAFODILCOM
Table 11: Ranking in terms of Profitability & Performance
10
6.3. Activity Ratio
Activity ratios measure company sales per another asset account—the most common asset
accounts used are accounts receivable, inventory, and total assets. Activity ratios measure the
efficiency of the company in using its resources. Since most companies invest heavily in accounts
receivable or inventory, these accounts are used in the denominator of the most popular activity
ratios.
6.3.1. Account Receivables Turnover
Accounts receivable is the total amount of money due to a company for products or services sold
on an open credit account. The accounts receivable turnover shows how quickly a company
collects what is owed to it.
Accounts Receivable Turnover =
Total Credit Sales
Accounts Receivable
Receivable Turnover
Company/Years 2007 2008 2009 2010 2011 Average
DAFODILCOM 5.32 3.84 5.82 22.66 11.26 9.78
ISNLTD 1.00 0.90 0.92 0.73 0.63 0.84
BDCOM 2.11 2.18 2.40 3.33 3.21 2.65
Table 12: Receivable Turnover
The higher the receivable turnover indicates quicker chance of receivable collection.
6.3.2. Average Collection Period
This indicates the collection period in days of the receivables of credit sales.
11
Average Collection Period
Company/Years 2007 2008 2009 2010 2011 Average
DAFODILCOM 67.69 93.67 61.81 15.89 31.98 54.21
ISNLTD 358.39 398.53 389.84 492.87 569.13 441.75
BDCOM 170.42 165.31 149.81 108.10 112.18 141.16
Table 13: Average Collection Period
The lower the collection period indicates quicker receivable collection.
6.3.3. Inventory Turnover
For a company to be profitable, it must be able to manage its inventory, because it is money
invested that does not earn a return. The best measure of inventory utilization is the inventory
turnover ratio (aka inventory utilization ratio), which is the total annual sales or the cost of
goods sold divided by the cost of inventory.
Inventory Turnover =
Total Annual Sales or Cost of Goods Sold
Inventory Cost
Using the cost of goods sold in the numerator is a more accurate indicator of inventory
turnover, and allows a more direct comparison with other companies, since different companies
would have different markups to the sale price, which would overstate the actual inventory
turnover.
Inventory Turnover
Company/Years 2007 2008 2009 2010 2011 Average
DAFODILCOM 5.14 44.62 4.49 6.28 4.74 13.06
ISNLTD - - - - - -
BDCOM 5.91 4.51 5.90 8.39 8.73 6.69
Table 14: Inventory Turnover
The higher turnover indicates the maximum utilization of inventory efficiently.
(ISNLTD do not have any inventory for operation)
12
6.3.4. Inventory Turnover in days
The lower turnover in days indicates the maximum utilization of inventory efficiently.
Inventory Turnover (Days)
Company/Years 2007 2008 2009 2010 2011 Average
DAFODILCOM 70.08 8.07 80.17 57.28 75.95 58.31
ISNLTD - - - - - -
BDCOM 60.87 79.87 61.01 42.88 41.23 57.17
Table 15: Inventory Turnover (Days)
(ISNLTD do not have any inventory for operation)
6.3.5. Payable Turnover
A short-term liquidity measure used to quantify the rate at which a company pays off its
suppliers. Accounts payable turnover ratio is calculated by taking the total purchases made from
suppliers and dividing it by the average accounts payable amount during the same period.
Payable Turnover
Company/Years 2007 2008 2009 2010 2011 Average
DAFODILCOM 36.95 32.62 41.98 27.69 33.40 34.53
ISNLTD - - - - - -
BDCOM 8.27 6.14 1.54 4.01 4.76 4.94
Table 16: Payable Turnover
The lower payable turnover allows the firm to get the maximum advantage of credit purchase.
(ISNLTD do not have any credit purchase/ payables)
13
6.3.6. Payable Turnover in Days
Payable Turnover (Days)
Company/Years 2007 2008 2009 2010 2011 Average
DAFODILCOM 9.74 11.03 8.57 13.00 10.78 10.63
ISNLTD - - - - - -
BDCOM 43.55 58.67 233.25 89.70 75.65 100.16
Table 17: Payable Turnover (Days)
The higher payable turnover days allow the firm to get the maximum advantage of credit purchase.
6.3.7. Operating Cycle
The time between the purchases of an asset and its sale, or the sale of a product made from the
asset. Most companies desire short operating cycles because it creates cash flow to cover the
company's liabilities.
Operating Cycle
Company/Years 2007 2008 2009 2010 2011 Average
DAFODILCOM 138.75 101.85 143.10 73.97 108.98 113.33
ISNLTD - - - - - -
BDCOM 232.13 246.28 211.66 151.58 153.98 199.13
Table 18: Operating Cycle
6.4. Market Performance
6.4.1. EPS
The portion of a company's profit allocated to each outstanding share of common stock. Earnings
per share serve as an indicator of a company's profitability. Calculated as:
14
EPS
Company/Years 2007 2008 2009 2010 2011 Average
DAFODILCOM 0.69 0.47 0.70 0.63 0.94 0.69
ISNLTD 1.08 1.22 1.18 1.05 0.55 1.02
BDCOM 0.67 0.92 0.86 0.61 0.51 0.71
Table 19: EPS
6.4.2. Payout Ratio
The amount of earnings paid out in dividends to shareholders. Investors can use the payout ratio
to determine what companies are doing with their earnings.
Calculated as:
Payout Ratio
Company/Years 2007 2008 2009 2010 2011 Average
DAFODILCOM 1.84 0.03 0.53 0.01 0.00 0.48
ISNLTD 0.90 0.32 0.42 0.00 0.00 0.33
BDCOM 0.00 0.00 0.00 0.00 0.53 0.11
Table 20: Payout Ratio
Mostly depend in the company policy
6.4.3. PE Ratio
The P/E looks at the relationship between the stock price and the company s earnings. The P/E is
the most popular metric of stock analysis, although it is far from the only one you should consider.
P/E = Stock Price / EPS
15
PE Ratio
Company/Years 2007 2008 2009 2010 2011 Average
DAFODILCOM 26.13 25.50 18.65 22.22 14.89 21.48
ISNLTD 15.28 14.75 20.34 20.95 49.09 24.08
BDCOM 32.84 20.65 20.93 28.69 34.80 27.58
Table 2119: PE Ratio
Ranking in terms of Market performance
Rank EPS Payout P/E
1 ISNLTD BDCOM BDCOM
2 BDCOM ISNLTD ISNLTD
3 DAFODILCOM DAFODILCOM DAFODILCOM
Table 22: Ranking in terms of Market performance
CONCLUSION
It is to be concluded for this study that, this is a very difficult to make decision about any of the
firms performance and the measurement tools, because all the formulas and functions are applied
to attain an specific requirement of the firm as the part of the firm s financial strategy. So, the
qualitative information will also need to understand the purpose of the firm to use any of the tools
to measure their performance. Finally it could be recommended that, the importance of the ratio
analysis depends on the stakeholder s specific need and the situational requirements.
16
ANNEXURE -I (BALANCE SHEET OF Daffodil Computers)
Daffodil Computers Limited
Balance Sheet
As at 30 June 2007
Particulars Notes
30 June 2007 30 June 2006
Taka Taka
APPLICATION OF FUNDS
Non-Current Assets
Fixed Assets (At cost) 4 73,989,988 73,823,828
Less: Accumulated Depreciation 31,692,765 26,731,842
42,297,223 47,091,986
Customized Software Development 5 32,791,653 32,648,138
Work-in-Progress (Customized Software
Development) 6 832,861 2,019,696
Web Development 7 - 16,199,678
Investment in Subsidiary JS E-
Recruitment Ltd. 8 18,049,678 -
Deferred Revenue Expenditure 9 3,044,435 3,805,544
Current Assets
Inventories 10 49,758,534 53,224,857
Sundry Debtors 11 48,062,844 59,539,560
Advances, Deposits and Prepayments 12 130,058,457 114,490,782
Cash & Cash Equivalents 13 3,488,997 15,854,521
231,368,832 243,109,720
Less: Current Liabilities
Bank Loans, Overdraft and Credit 14 68,348,609 79,531,649
Trade Creditors 15 6,918,217 4,205,859
Other Creditors 16 - 910,000
Liabilities for Expenses 17 5,706,021 5,093,205
Unclaimed Dividend 332,185 3,223,200
Provision for Income Tax 18 11,023,199 6,061,226
92,328,231 99,025,139
Net Current Assets 139,040,602 144,084,581
Total 236,056,451 245,849,624
SOURCES OF FUNDS
Shareholders' Equity
Share Capital 19 175,000,000 175,000,000
Reserve & Surplus
Profit & Loss A/c 20 43,556,451 51,599,624
Dividends
Proposed Dividend 36 17,500,000 19,250,000
Shareholders' Equity 236,056,451 245,849,624
Total 236,056,451 245,849,624
17
Daffodil Computers Limited
Profit and Loss Account
For the year ended 30 June 2007
Particulars Notes 2006-07 2005-06
Taka Taka
Net Sales 21 255,605,075 318,358,099
Cost of Goods Sold 22 (206,631,145) (259,996,275)
Gross Profit 48,973,930 58,361,824
Operating Expenses:
Administrative Expenses 23 (25,699,185) (26,658,302)
Selling & Distribution Expenses 24 (2,166,554) (2,944,594)
Financial Expenses 25 (7,207,517) (4,702,951)
(35,073,256) (34,305,847)
Operating Profit 13,900,674 24,055,977
Other Income 26 518,126 1,592,122
Net Profit Before Tax 14,418,800 25,648,099
Provision for Income Tax 18 (2,361,973) (1,370,837)
Net Profit After Tax 12,056,827 24,277,262
Profit/(Loss) brought forward 51,599,624 46,861,731
Prior year adjustment:
Short Provision for Income Tax for the year
2004-05 (2,600,000) -
Short Provision for Income Tax for the years
2002-03 & 2003-04 18 - (289,369)
(2,600,000) (289,369)
Profit available for Appropriation 61,056,451 70,849,624
Proposed Dividend 36 17,500,000 19,250,000
Profit/(Loss) carried forward 43,556,451 51,599,624
Earning per Share (EPS) 27 0.69 1.39
18
Daffodil Computers Limited
Cash Flow Statement
For the year ended 30 June 2007
PARTICULARS 2006-07 2005-06
Taka Taka
A. Cash flow from Operating Activities:
Cash Received from Customers & Others 270,003,037 333,533,404
Cash Paid to Suppliers, Employees & Others (234,631,621) (278,939,161)
Cash generated from Operations: 35,371,416 54,594,243
Interest income on FDR 416,841 1,403,095
Bank Loan Interest & Lease Rental paid (7,207,517) (4,702,951)
VAT paid (2,819,961) (2,035,561)
Income Tax Paid/Income Tax paid in advance (2,103,532) (389,453)
Net cash flow from operating activities 23,657,247 48,869,373
B. Cash flow from Investing Activities:
Net Purchase of property, plant & equipment (166,160) (235,140)
Investment made (Customized software development) (1,869,391) (22,990,517)
Work-in-Progress (Customized software development) 1,186,835 (2,019,696)
Investment made (Web Development) - (1,620,000)
Investment made in JS E-Recruitment Ltd. (1,850,000) -
Net cash used in investing activities (2,698,716) (26,865,353)
C. Cash flow from Financing Activities:
Bank Loan, Overdrafts & Credit (11,183,040) (2,619,612)
Dividend Paid (22,141,015) (23,339,500)
Net Cash used in Financing Activities (33,324,055) (25,959,112)
Net Increase/(Decrease) in Cash & Cash Equivalents (12,365,524) (3,955,092)
Cash & Cash Equivalents at Opening 15,854,521 19,809,613
Cash & Cash Equivalents at Closing 3,488,997 15,854,521
19
20
21
22
23
24
25
26
27
28
29
30
31
32
33
34
35
ANNEXURE-II (BALANCE SHEET OF INFORMATION SERVICES NETWORK)
36
37
38
39
40
41
42
43
44
45
46
47
48
49
50
51
52
53
54
55
ANNEXURE-III (BALANCE SHEET OF BDCOM ONLINE LIMITED)
56
57
58
59
60
61
62
63
64
65
66
67
68
69

More Related Content

Similar to An Assignment On Ratio Analysis

Scorecard & Dashboards
Scorecard & DashboardsScorecard & Dashboards
Scorecard & Dashboards
Sunam Pal
 
Bpr Project - Attendance Management System
Bpr Project - Attendance Management SystemBpr Project - Attendance Management System
Bpr Project - Attendance Management System
Gihan Timantha
 
An Analysis of Working Capital Management at BHEL
An Analysis of Working Capital Management at BHELAn Analysis of Working Capital Management at BHEL
An Analysis of Working Capital Management at BHEL
Smitha Thippeswamy
 
Hisham El Sherbini MPSP Assignment v2.0 (For Pub)
Hisham El Sherbini MPSP Assignment v2.0 (For Pub)Hisham El Sherbini MPSP Assignment v2.0 (For Pub)
Hisham El Sherbini MPSP Assignment v2.0 (For Pub)
Hisham El Sherbini
 
Rapport veille salon-mobile IT & bigdata
Rapport veille salon-mobile IT & bigdataRapport veille salon-mobile IT & bigdata
Rapport veille salon-mobile IT & bigdata
Viedoc
 
Information and-communications-technologies-ict-strategic2439
Information and-communications-technologies-ict-strategic2439Information and-communications-technologies-ict-strategic2439
Information and-communications-technologies-ict-strategic2439
Munir ZD
 
Financial Management
Financial ManagementFinancial Management
Financial Management
deepak_varma
 

Similar to An Assignment On Ratio Analysis (20)

Scorecard & Dashboards
Scorecard & DashboardsScorecard & Dashboards
Scorecard & Dashboards
 
Redict Report
Redict ReportRedict Report
Redict Report
 
Frost Report
Frost ReportFrost Report
Frost Report
 
Nokia Competitive Intelligence, Strategy and Marketing analysis
Nokia Competitive Intelligence, Strategy and Marketing analysisNokia Competitive Intelligence, Strategy and Marketing analysis
Nokia Competitive Intelligence, Strategy and Marketing analysis
 
Mpo
MpoMpo
Mpo
 
Social Media And Financial Communications Mid-Year 2011 Report: “The Train Ha...
Social Media And Financial Communications Mid-Year 2011 Report: “The Train Ha...Social Media And Financial Communications Mid-Year 2011 Report: “The Train Ha...
Social Media And Financial Communications Mid-Year 2011 Report: “The Train Ha...
 
Bpr Project - Attendance Management System
Bpr Project - Attendance Management SystemBpr Project - Attendance Management System
Bpr Project - Attendance Management System
 
An Analysis of Working Capital Management at BHEL
An Analysis of Working Capital Management at BHELAn Analysis of Working Capital Management at BHEL
An Analysis of Working Capital Management at BHEL
 
2 P A G E Table Of Contents Page COURSEWORK HEADER SHEET
2   P A G E Table Of Contents Page COURSEWORK HEADER SHEET2   P A G E Table Of Contents Page COURSEWORK HEADER SHEET
2 P A G E Table Of Contents Page COURSEWORK HEADER SHEET
 
Hisham El Sherbini MPSP Assignment v2.0 (For Pub)
Hisham El Sherbini MPSP Assignment v2.0 (For Pub)Hisham El Sherbini MPSP Assignment v2.0 (For Pub)
Hisham El Sherbini MPSP Assignment v2.0 (For Pub)
 
Indian IT Industry overview
Indian IT Industry overviewIndian IT Industry overview
Indian IT Industry overview
 
Solar Business Opportunities in India-A Value Chain Perspective EAI
Solar Business Opportunities in India-A Value Chain Perspective EAISolar Business Opportunities in India-A Value Chain Perspective EAI
Solar Business Opportunities in India-A Value Chain Perspective EAI
 
Rapport veille salon-mobile IT & bigdata
Rapport veille salon-mobile IT & bigdataRapport veille salon-mobile IT & bigdata
Rapport veille salon-mobile IT & bigdata
 
Information and-communications-technologies-ict-strategic2439
Information and-communications-technologies-ict-strategic2439Information and-communications-technologies-ict-strategic2439
Information and-communications-technologies-ict-strategic2439
 
Thinking like a global financial institution - Account Based Marketing
Thinking like a global financial institution - Account Based MarketingThinking like a global financial institution - Account Based Marketing
Thinking like a global financial institution - Account Based Marketing
 
MBA assignment for Managing Human Capital
MBA assignment for Managing Human CapitalMBA assignment for Managing Human Capital
MBA assignment for Managing Human Capital
 
The business savvy_cio
The business savvy_cioThe business savvy_cio
The business savvy_cio
 
CHAPTER 2.pdf
CHAPTER 2.pdfCHAPTER 2.pdf
CHAPTER 2.pdf
 
HK FinTech Steering Group inaugural report 2016
HK FinTech Steering Group inaugural report 2016HK FinTech Steering Group inaugural report 2016
HK FinTech Steering Group inaugural report 2016
 
Financial Management
Financial ManagementFinancial Management
Financial Management
 

More from Don Dooley

More from Don Dooley (20)

012 Movie Review Essay Cover Letters Of Explorato
012 Movie Review Essay Cover Letters Of Explorato012 Movie Review Essay Cover Letters Of Explorato
012 Movie Review Essay Cover Letters Of Explorato
 
How To Write The Disadvant. Online assignment writing service.
How To Write The Disadvant. Online assignment writing service.How To Write The Disadvant. Online assignment writing service.
How To Write The Disadvant. Online assignment writing service.
 
8 Steps To Help You In Writing A Good Research
8 Steps To Help You In Writing A Good Research8 Steps To Help You In Writing A Good Research
8 Steps To Help You In Writing A Good Research
 
How To Write An Essay In 5 Easy Steps Teaching Writin
How To Write An Essay In 5 Easy Steps Teaching WritinHow To Write An Essay In 5 Easy Steps Teaching Writin
How To Write An Essay In 5 Easy Steps Teaching Writin
 
005 Sample Grad School Essays Diversity Essay Gr
005 Sample Grad School Essays Diversity Essay Gr005 Sample Grad School Essays Diversity Essay Gr
005 Sample Grad School Essays Diversity Essay Gr
 
Position Paper Sample By Alizeh Tariq - Issuu
Position Paper Sample By Alizeh Tariq - IssuuPosition Paper Sample By Alizeh Tariq - Issuu
Position Paper Sample By Alizeh Tariq - Issuu
 
Literature Review Summary Template. Online assignment writing service.
Literature Review Summary Template. Online assignment writing service.Literature Review Summary Template. Online assignment writing service.
Literature Review Summary Template. Online assignment writing service.
 
No-Fuss Methods For Literary Analysis Paper Ex
No-Fuss Methods For Literary Analysis Paper ExNo-Fuss Methods For Literary Analysis Paper Ex
No-Fuss Methods For Literary Analysis Paper Ex
 
Reflection Essay Dental School Essay. Online assignment writing service.
Reflection Essay Dental School Essay. Online assignment writing service.Reflection Essay Dental School Essay. Online assignment writing service.
Reflection Essay Dental School Essay. Online assignment writing service.
 
9 College Essay Outline Template - Template Guru
9 College Essay Outline Template - Template Guru9 College Essay Outline Template - Template Guru
9 College Essay Outline Template - Template Guru
 
Pin By Lynn Carpenter On Quick Saves Writing Rubric, Essay Writin
Pin By Lynn Carpenter On Quick Saves Writing Rubric, Essay WritinPin By Lynn Carpenter On Quick Saves Writing Rubric, Essay Writin
Pin By Lynn Carpenter On Quick Saves Writing Rubric, Essay Writin
 
How To Make Your Essay Lon. Online assignment writing service.
How To Make Your Essay Lon. Online assignment writing service.How To Make Your Essay Lon. Online assignment writing service.
How To Make Your Essay Lon. Online assignment writing service.
 
Favorite Book Essay. Online assignment writing service.
Favorite Book Essay. Online assignment writing service.Favorite Book Essay. Online assignment writing service.
Favorite Book Essay. Online assignment writing service.
 
Wilson Fundations Printables. Online assignment writing service.
Wilson Fundations Printables. Online assignment writing service.Wilson Fundations Printables. Online assignment writing service.
Wilson Fundations Printables. Online assignment writing service.
 
Green Alien Stationery - Free Printable Writing Paper Pr
Green Alien Stationery - Free Printable Writing Paper PrGreen Alien Stationery - Free Printable Writing Paper Pr
Green Alien Stationery - Free Printable Writing Paper Pr
 
How To Write Up Research Findings. How To Write Chap
How To Write Up Research Findings. How To Write ChapHow To Write Up Research Findings. How To Write Chap
How To Write Up Research Findings. How To Write Chap
 
Saral Marathi Nibandhmala Ani Rachna Part 2 (Std. 8,
Saral Marathi Nibandhmala Ani Rachna Part 2 (Std. 8,Saral Marathi Nibandhmala Ani Rachna Part 2 (Std. 8,
Saral Marathi Nibandhmala Ani Rachna Part 2 (Std. 8,
 
Free Snowflake Stationery And Writing Paper Clip Ar
Free Snowflake Stationery And Writing Paper Clip ArFree Snowflake Stationery And Writing Paper Clip Ar
Free Snowflake Stationery And Writing Paper Clip Ar
 
Free Printable Blank Handwriting Paper - Disco
Free Printable Blank Handwriting Paper - DiscoFree Printable Blank Handwriting Paper - Disco
Free Printable Blank Handwriting Paper - Disco
 
Essay Outline Template, Essay Outline, Essay Outlin
Essay Outline Template, Essay Outline, Essay OutlinEssay Outline Template, Essay Outline, Essay Outlin
Essay Outline Template, Essay Outline, Essay Outlin
 

Recently uploaded

Spellings Wk 4 and Wk 5 for Grade 4 at CAPS
Spellings Wk 4 and Wk 5 for Grade 4 at CAPSSpellings Wk 4 and Wk 5 for Grade 4 at CAPS
Spellings Wk 4 and Wk 5 for Grade 4 at CAPS
AnaAcapella
 
The basics of sentences session 3pptx.pptx
The basics of sentences session 3pptx.pptxThe basics of sentences session 3pptx.pptx
The basics of sentences session 3pptx.pptx
heathfieldcps1
 

Recently uploaded (20)

NO1 Top Black Magic Specialist In Lahore Black magic In Pakistan Kala Ilam Ex...
NO1 Top Black Magic Specialist In Lahore Black magic In Pakistan Kala Ilam Ex...NO1 Top Black Magic Specialist In Lahore Black magic In Pakistan Kala Ilam Ex...
NO1 Top Black Magic Specialist In Lahore Black magic In Pakistan Kala Ilam Ex...
 
How to Add New Custom Addons Path in Odoo 17
How to Add New Custom Addons Path in Odoo 17How to Add New Custom Addons Path in Odoo 17
How to Add New Custom Addons Path in Odoo 17
 
AIM of Education-Teachers Training-2024.ppt
AIM of Education-Teachers Training-2024.pptAIM of Education-Teachers Training-2024.ppt
AIM of Education-Teachers Training-2024.ppt
 
VAMOS CUIDAR DO NOSSO PLANETA! .
VAMOS CUIDAR DO NOSSO PLANETA!                    .VAMOS CUIDAR DO NOSSO PLANETA!                    .
VAMOS CUIDAR DO NOSSO PLANETA! .
 
Simple, Complex, and Compound Sentences Exercises.pdf
Simple, Complex, and Compound Sentences Exercises.pdfSimple, Complex, and Compound Sentences Exercises.pdf
Simple, Complex, and Compound Sentences Exercises.pdf
 
Details on CBSE Compartment Exam.pptx1111
Details on CBSE Compartment Exam.pptx1111Details on CBSE Compartment Exam.pptx1111
Details on CBSE Compartment Exam.pptx1111
 
Sensory_Experience_and_Emotional_Resonance_in_Gabriel_Okaras_The_Piano_and_Th...
Sensory_Experience_and_Emotional_Resonance_in_Gabriel_Okaras_The_Piano_and_Th...Sensory_Experience_and_Emotional_Resonance_in_Gabriel_Okaras_The_Piano_and_Th...
Sensory_Experience_and_Emotional_Resonance_in_Gabriel_Okaras_The_Piano_and_Th...
 
OSCM Unit 2_Operations Processes & Systems
OSCM Unit 2_Operations Processes & SystemsOSCM Unit 2_Operations Processes & Systems
OSCM Unit 2_Operations Processes & Systems
 
80 ĐỀ THI THỬ TUYỂN SINH TIẾNG ANH VÀO 10 SỞ GD – ĐT THÀNH PHỐ HỒ CHÍ MINH NĂ...
80 ĐỀ THI THỬ TUYỂN SINH TIẾNG ANH VÀO 10 SỞ GD – ĐT THÀNH PHỐ HỒ CHÍ MINH NĂ...80 ĐỀ THI THỬ TUYỂN SINH TIẾNG ANH VÀO 10 SỞ GD – ĐT THÀNH PHỐ HỒ CHÍ MINH NĂ...
80 ĐỀ THI THỬ TUYỂN SINH TIẾNG ANH VÀO 10 SỞ GD – ĐT THÀNH PHỐ HỒ CHÍ MINH NĂ...
 
Tatlong Kwento ni Lola basyang-1.pdf arts
Tatlong Kwento ni Lola basyang-1.pdf artsTatlong Kwento ni Lola basyang-1.pdf arts
Tatlong Kwento ni Lola basyang-1.pdf arts
 
Exploring_the_Narrative_Style_of_Amitav_Ghoshs_Gun_Island.pptx
Exploring_the_Narrative_Style_of_Amitav_Ghoshs_Gun_Island.pptxExploring_the_Narrative_Style_of_Amitav_Ghoshs_Gun_Island.pptx
Exploring_the_Narrative_Style_of_Amitav_Ghoshs_Gun_Island.pptx
 
Understanding Accommodations and Modifications
Understanding  Accommodations and ModificationsUnderstanding  Accommodations and Modifications
Understanding Accommodations and Modifications
 
Unit 3 Emotional Intelligence and Spiritual Intelligence.pdf
Unit 3 Emotional Intelligence and Spiritual Intelligence.pdfUnit 3 Emotional Intelligence and Spiritual Intelligence.pdf
Unit 3 Emotional Intelligence and Spiritual Intelligence.pdf
 
21st_Century_Skills_Framework_Final_Presentation_2.pptx
21st_Century_Skills_Framework_Final_Presentation_2.pptx21st_Century_Skills_Framework_Final_Presentation_2.pptx
21st_Century_Skills_Framework_Final_Presentation_2.pptx
 
REMIFENTANIL: An Ultra short acting opioid.pptx
REMIFENTANIL: An Ultra short acting opioid.pptxREMIFENTANIL: An Ultra short acting opioid.pptx
REMIFENTANIL: An Ultra short acting opioid.pptx
 
PANDITA RAMABAI- Indian political thought GENDER.pptx
PANDITA RAMABAI- Indian political thought GENDER.pptxPANDITA RAMABAI- Indian political thought GENDER.pptx
PANDITA RAMABAI- Indian political thought GENDER.pptx
 
COMMUNICATING NEGATIVE NEWS - APPROACHES .pptx
COMMUNICATING NEGATIVE NEWS - APPROACHES .pptxCOMMUNICATING NEGATIVE NEWS - APPROACHES .pptx
COMMUNICATING NEGATIVE NEWS - APPROACHES .pptx
 
Spellings Wk 4 and Wk 5 for Grade 4 at CAPS
Spellings Wk 4 and Wk 5 for Grade 4 at CAPSSpellings Wk 4 and Wk 5 for Grade 4 at CAPS
Spellings Wk 4 and Wk 5 for Grade 4 at CAPS
 
How to Add a Tool Tip to a Field in Odoo 17
How to Add a Tool Tip to a Field in Odoo 17How to Add a Tool Tip to a Field in Odoo 17
How to Add a Tool Tip to a Field in Odoo 17
 
The basics of sentences session 3pptx.pptx
The basics of sentences session 3pptx.pptxThe basics of sentences session 3pptx.pptx
The basics of sentences session 3pptx.pptx
 

An Assignment On Ratio Analysis

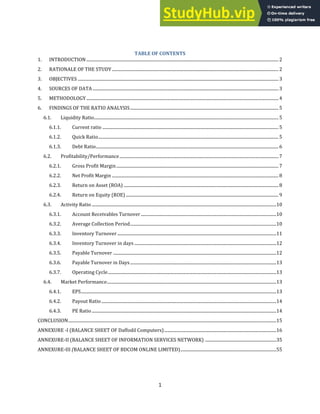
  • 1. 1 TABLE OF CONTENTS 1. INTRODUCTION .................................................................................................................................................................................... 2 2. RATIONALE OF THE STUDY............................................................................................................................................................ 2 3. OBJECTIVES ............................................................................................................................................................................................ 3 4. SOURCES OF DATA .............................................................................................................................................................................. 3 5. METHODOLOGY.................................................................................................................................................................................... 4 6. FINDINGS OF THE RATIO ANALYSIS........................................................................................................................................... 5 6.1. Liquidity Ratio............................................................................................................................................................................. 5 6.1.1. Current ratio ..................................................................................................................................................................... 5 6.1.2. Quick Ratio......................................................................................................................................................................... 5 6.1.3. Debt Ratio........................................................................................................................................................................... 6 6.2. Profitability/Performance..................................................................................................................................................... 7 6.2.1. Gross Profit Margin........................................................................................................................................................ 7 6.2.2. Net Profit Margin ............................................................................................................................................................ 8 6.2.3. Return on Asset (ROA) ................................................................................................................................................. 8 6.2.4. Return on Equity (ROE) ............................................................................................................................................... 9 6.3. Activity Ratio .............................................................................................................................................................................10 6.3.1. Account Receivables Turnover...............................................................................................................................10 6.3.2. Average Collection Period.........................................................................................................................................10 6.3.3. Inventory Turnover .....................................................................................................................................................11 6.3.4. Inventory Turnover in days .....................................................................................................................................12 6.3.5. Payable Turnover .........................................................................................................................................................12 6.3.6. Payable Turnover in Days.........................................................................................................................................13 6.3.7. Operating Cycle..............................................................................................................................................................13 6.4. Market Performance...............................................................................................................................................................13 6.4.1. EPS.......................................................................................................................................................................................13 6.4.2. Payout Ratio....................................................................................................................................................................14 6.4.3. PE Ratio.............................................................................................................................................................................14 CONCLUSION...................................................................................................................................................................................................15 ANNEXURE -I (BALANCE SHEET OF Daffodil Computers).........................................................................................................16 ANNEXURE-II (BALANCE SHEET OF INFORMATION SERVICES NETWORK) ...................................................................35 ANNEXURE-III (BALANCE SHEET OF BDCOM ONLINE LIMITED)..........................................................................................55
  • 2. 2 1. INTRODUCTION A sustainable business and mission requires effective planning and financial management. Ratio analysis is a useful management tool that will improve your understanding of financial results and trends over time, and provide key indicators of organizational performance. Managers will use ratio analysis to pinpoint strengths and weaknesses from which strategies and initiatives can be formed. Funders may use ratio analysis to measure your results against other organizations or make judgments concerning management effectiveness and mission impact. For ratios to be useful and meaningful, they must be:  Calculated using reliable, accurate financial information (does your financial information reflect your true cost picture?)  Calculated consistently from period to period.  Used in comparison to internal benchmarks and goals o Used in comparison to other companies in your industry.  Viewed both at a single point in time and as an indication of broad trends and issues over time.  Carefully interpreted in the proper context, considering there are many other important factors and indicators involved in assessing performance. Ratios can be divided into four major categories:  Profitability Sustainability  Operational Efficiency  Liquidity  Leverage (Funding – Debt, Equity, Grants) The ratios presented below represent some of the standard ratios used in business practice and are provided as guidelines. Not all these ratios will provide the information you need to support your particular decisions and strategies. You can also develop your own ratios and indicators based on what you consider important and meaningful to your organization and stakeholders. 2. RATIONALE OF THE STUDY A widely held view is that the growth of the ICT industry may provide an opportunity for developing countries to leapfrog into the industrialized economy. For example, low-income economies that have a strong human capital base can take advantage of the rapid decline in the cost
  • 3. 3 of computing power and telecommunication over the last decade that has made it possible to deliver IT service from a remote location. There is considerable potential for the development of ICT industries in Bangladesh because of the availability of trained personnel at relatively low wage rates. The present government of Bangladesh envisions creating a Digital Bangladesh by , which critically depends on proper policies as well as infrastructure development for this sector. However, in order to capture significant gains from the growth of the ICT industry worldwide, policy makers and firms both require a clear understanding of its dynamics. While a cheap and abundant human capital base can explain the early stage of software industry development, improved productivity is required to take advantage of emerging opportunities and carve out a niche in the export of outsourced services. 3. OBJECTIVES This Study will examine the financial statement and analysis its financial prospects in terms of liquidity, debt, company performance, efficiency and the market performance of the market. 4. SOURCES OF DATA The main data source is the published annual reports of DAFODILCOM (Daffodil Computers Ltd.), ISNLTD (Information Services Network Ltd.), and BDCOM (BDCOM Online limited) for the year ended 2007, 2008, 2009, 2010 and 2011.
  • 4. 4 5. METHODOLOGY The Financial Ratios: I. Liquidity Ratio i) Current Ratio ii) Quick Ratio II. Debt Ratio i) Debt-to-equity ii) Debt-to-Total Asset III. Profitability/Performance i) Gross Profit Margin ii) Net Profit Margin iii) Return on Asset (ROA) iv) Return on Equity (ROE) IV. Activity Ratio i) Account Receivables Turnover ii) Average Collection Period iii) Inventory Turnover iv) Inventory Turnover in days v) Payable Turnover vi) Payable Turnover in Days vii) Operating Cycle V. Market Performance i) EPS ii) Payout Ratio iii) PE Ratio
  • 5. 5 6. FINDINGS OF THE RATIO ANALYSIS 6.1. Liquidity Ratio In a nutshell, a company's liquidity is its ability to meet its near-term obligations, and it is a major measure of financial health. Liquidity can be measured through several ratios. 6.1.1. Current ratio The current ratio is the most basic liquidity test. It signifies a company's ability to meet its short- term liabilities with its short-term assets. A current ratio greater than or equal to one indicates that current assets should be able to satisfy near-term obligations. A current ratio of less than one may mean the firm has liquidity issues. Current Ratio = (Current Assets) / Current Liabilities Current ratio Company/Years 2007 2008 2009 2010 2011 Average DAFODILCOM 2.51 1.42 1.71 1.84 2.66 2.03 ISNLTD 3.12 4.96 6.11 2.87 2.09 3.83 BDCOM 7.18 7.01 1.62 1.56 4.65 4.40 Table 1: Current ratio Among the three companies BDCOM online Ltd. is more liquid then ISNLTD and then DAFODIL. 6.1.2. Quick Ratio The quick ratio is a tougher test of liquidity than the current ratio. It eliminates certain current assets such as inventory and prepaid expenses that may be more difficult to convert to cash. Like the current ratio, having a quick ratio above one means a company should have little problem with liquidity. The higher the ratio, the more liquid it is, and the better able the company will be to ride out any downturn in its business. Quick Ratio = (Cash + Accounts Receivable + Short-Term or Marketable Securities) / (Current Liabilities)
  • 6. 6 Acid test ratio Company/Years 2007 2008 2009 2010 2011 Average DAFODILCOM 1.97 1.37 0.81 1.22 2.20 1.51 ISNLTD 3.12 4.96 6.11 2.87 2.09 3.83 BDCOM 6.06 5.76 1.37 1.30 4.22 3.74 Table 2: Acid test ratio The quick ratio also behalf like the current ratio. Among the three companies BDCOM online Ltd. is more liquid then ISNLTD and then DAFODIL. One interesting observation is the Current and Quick ratios of all selected year are same, because of null inventories in their operations. Ranking in terms of Liquidity Rank Current ratio Acid test ratio 1 BDCOM ISNLTD 2 ISNLTD BDCOM 3 DAFODILCOM DAFODILCOM Table 3: Ranking in terms of Liquidity 6.1.3. Debt Ratio The debt ratio compares a company's total debt to its total assets, which is used to gain a general idea as to the amount of leverage being used by a company. A low percentage means that the company is less dependent on leverage, i.e., money borrowed from and/or owed to others. The lower the percentage, the less leverage a company is using and the stronger its equity position. In general, the higher the ratio, the more risk that company is considered to have taken on. Total debt to equity ratio Company/Years 2007 2008 2009 2010 2011 Average DAFODILCOM 39.00% 39.00% 23.00% 22.00% 24.00% 29.00% ISNLTD 24.00% 14.00% 7.00% 20.00% 31.00% 19.00% BDCOM 7.00% 8.00% 33.00% 33.00% 11.00% 18.00% Table 4: Total debt to equity ratio DAFODILCOM have comparatively higher debt portion relative to the equity than other two companies. It might not be normal compared to the industry and which might put the firm under risk but indicate high leverage.
  • 7. 7 Debt-to-Total Asset Company/Years 2007 2008 2009 2010 2011 Average DAFODILCOM 39.91% 70.47% 58.42% 54.42% 37.59% 52.16% ISNLTD 32.10% 20.17% 16.38% 34.84% 47.94% 30.29% BDCOM 13.94% 14.26% 61.86% 64.15% 21.49% 35.14% Table 5: Debt-to-Total Asset DAFODILCOM also have comparatively higher debt portion relative to the Assets than other two companies. It seems using more debt compared to the industry and which might put the firm under risk pressure but indicate high leverage. Ranking in terms of high leverage Rank Total debt to equity ratio Debt-to-Total Asset 1 DAFODILCOM DAFODILCOM 2 ISNLTD BDCOM 3 BDCOM ISNLTD Table 6: Ranking in terms of high leverage 6.2. Profitability/Performance Every firm is most concerned with its profitability. One of the most frequently used tools of financial ratio analysis is profitability ratios which are used to determine the company's bottom line. Profitability measures are important to company managers and owners alike. If a small business has outside investors who have put their own money into the company, the primary owner certainly has to show profitability to those equity investors. 6.2.1. Gross Profit Margin The gross profit margin looks at cost of goods sold as a percentage of sales. This ratio looks at how well a company controls the cost of its inventory and the manufacturing of its products and subsequently passes on the costs to its customers. The larger the gross profit margin, the better for the company. The calculation is: Gross Profit/Net Sales = ____%. Both terms of the equation come from the company's income statement.
  • 8. 8 Gross Profit Margin Company/Years 2007 2008 2009 2010 2011 Average DAFODILCOM 19.16% 19.16% 19.93% 18.71% 21.72% 19.74% ISNLTD 45.93% 51.38% 44.47% 49.62% 47.85% 47.85% BDCOM 65.35% 67.03% 73.94% 68.38% 63.16% 67.57% Table 7: Gross Profit Margin Higher GPM indicates higher profitability of the firm. 6.2.2. Net Profit Margin When doing a simple profitability ratio analysis, net profit margin is the most often margin ratio used. The net profit margin shows how much of each sales dollar shows up as net income after all expenses are paid. For example, if the net profit margin is 5% that means that 5 cents of every dollar is profit. The net profit margin measures profitability after consideration of all expenses including taxes, interest, and depreciation. The calculation is: Net Income/Net Sales = _____%. Both terms of the equation come from the income statement. Net Profit Margin Company/Years 2007 2008 2009 2010 2011 Average DAFODILCOM 4.72% 4.04% 6.05% 6.29% 12.39% 6.70% ISNLTD 22.56% 24.35% 20.56% 19.43% 10.53% 19.49% BDCOM 6.87% 7.84% 7.76% 9.46% 16.29% 9.65% Table 8: Net Profit Margin Here also higher NPM indicates higher profitability of the firm. 6.2.3. Return on Asset (ROA) The Return on Assets ratio is an important profitability ratio because it measures the efficiency with which the company is managing its investment in assets and using them to generate profit. It measures the amount of profit earned relative to the firm's level of investment in total assets. The return on assets ratio is related to the asset management category of financial ratios. The calculation for the return on assets ratio is: Net Income/Total Assets = _____%. Net Income is taken from the income statement and total assets are taken from the balance sheet.
  • 9. 9 Return on Asset Company/Years 2007 2008 2009 2010 2011 Average DAFODILCOM 3.67% 3.06% 5.32% 4.45% 5.21% 4.34% ISNLTD 9.33% 9.50% 5.81% 4.97% 2.62% 6.45% BDCOM 2.96% 3.42% 2.81% 5.04% 6.02% 4.05% Table 9: Return on Asset The higher the percentage, the better the firm s asset utilization to earn, because that means the company is doing a good job using its assets to generate sales. 6.2.4. Return on Equity (ROE) The Return on Equity ratio is perhaps the most important of all the financial ratios to investors in the company. It measures the return on the money the investors have put into the company. This is the ratio potential investors look at when deciding whether or not to invest in the company. The calculation is: Net Income/Stockholder's Equity = _____%. Net income comes from the income statement and stockholder's equity comes from the balance sheet. Return on Equity Company/Years 2007 2008 2009 2010 2011 Average DAFODILCOM 5.11% 3.70% 5.65% 5.44% 6.45% 5.27% ISNLTD 11.56% 10.84% 6.23% 5.96% 3.42% 7.60% BDCOM 3.17% 3.71% 3.74% 6.69% 6.68% 4.80% Table 10: Return on Equity In general, the higher the percentage, the better earning capability against its equity, with some exceptions, as it shows that the company is doing a good job using the investors' money. Ranking in terms of Profitability & Performance Rank Gross Profit Margin Net Profit Margin Return on Asset Return on Equity 1 BDCOM ISNLTD ISNLTD ISNLTD 2 ISNLTD DAFODILCOM BDCOM BDCOM 3 DAFODILCOM BDCOM DAFODILCOM DAFODILCOM Table 11: Ranking in terms of Profitability & Performance
  • 10. 10 6.3. Activity Ratio Activity ratios measure company sales per another asset account—the most common asset accounts used are accounts receivable, inventory, and total assets. Activity ratios measure the efficiency of the company in using its resources. Since most companies invest heavily in accounts receivable or inventory, these accounts are used in the denominator of the most popular activity ratios. 6.3.1. Account Receivables Turnover Accounts receivable is the total amount of money due to a company for products or services sold on an open credit account. The accounts receivable turnover shows how quickly a company collects what is owed to it. Accounts Receivable Turnover = Total Credit Sales Accounts Receivable Receivable Turnover Company/Years 2007 2008 2009 2010 2011 Average DAFODILCOM 5.32 3.84 5.82 22.66 11.26 9.78 ISNLTD 1.00 0.90 0.92 0.73 0.63 0.84 BDCOM 2.11 2.18 2.40 3.33 3.21 2.65 Table 12: Receivable Turnover The higher the receivable turnover indicates quicker chance of receivable collection. 6.3.2. Average Collection Period This indicates the collection period in days of the receivables of credit sales.
  • 11. 11 Average Collection Period Company/Years 2007 2008 2009 2010 2011 Average DAFODILCOM 67.69 93.67 61.81 15.89 31.98 54.21 ISNLTD 358.39 398.53 389.84 492.87 569.13 441.75 BDCOM 170.42 165.31 149.81 108.10 112.18 141.16 Table 13: Average Collection Period The lower the collection period indicates quicker receivable collection. 6.3.3. Inventory Turnover For a company to be profitable, it must be able to manage its inventory, because it is money invested that does not earn a return. The best measure of inventory utilization is the inventory turnover ratio (aka inventory utilization ratio), which is the total annual sales or the cost of goods sold divided by the cost of inventory. Inventory Turnover = Total Annual Sales or Cost of Goods Sold Inventory Cost Using the cost of goods sold in the numerator is a more accurate indicator of inventory turnover, and allows a more direct comparison with other companies, since different companies would have different markups to the sale price, which would overstate the actual inventory turnover. Inventory Turnover Company/Years 2007 2008 2009 2010 2011 Average DAFODILCOM 5.14 44.62 4.49 6.28 4.74 13.06 ISNLTD - - - - - - BDCOM 5.91 4.51 5.90 8.39 8.73 6.69 Table 14: Inventory Turnover The higher turnover indicates the maximum utilization of inventory efficiently. (ISNLTD do not have any inventory for operation)
  • 12. 12 6.3.4. Inventory Turnover in days The lower turnover in days indicates the maximum utilization of inventory efficiently. Inventory Turnover (Days) Company/Years 2007 2008 2009 2010 2011 Average DAFODILCOM 70.08 8.07 80.17 57.28 75.95 58.31 ISNLTD - - - - - - BDCOM 60.87 79.87 61.01 42.88 41.23 57.17 Table 15: Inventory Turnover (Days) (ISNLTD do not have any inventory for operation) 6.3.5. Payable Turnover A short-term liquidity measure used to quantify the rate at which a company pays off its suppliers. Accounts payable turnover ratio is calculated by taking the total purchases made from suppliers and dividing it by the average accounts payable amount during the same period. Payable Turnover Company/Years 2007 2008 2009 2010 2011 Average DAFODILCOM 36.95 32.62 41.98 27.69 33.40 34.53 ISNLTD - - - - - - BDCOM 8.27 6.14 1.54 4.01 4.76 4.94 Table 16: Payable Turnover The lower payable turnover allows the firm to get the maximum advantage of credit purchase. (ISNLTD do not have any credit purchase/ payables)
  • 13. 13 6.3.6. Payable Turnover in Days Payable Turnover (Days) Company/Years 2007 2008 2009 2010 2011 Average DAFODILCOM 9.74 11.03 8.57 13.00 10.78 10.63 ISNLTD - - - - - - BDCOM 43.55 58.67 233.25 89.70 75.65 100.16 Table 17: Payable Turnover (Days) The higher payable turnover days allow the firm to get the maximum advantage of credit purchase. 6.3.7. Operating Cycle The time between the purchases of an asset and its sale, or the sale of a product made from the asset. Most companies desire short operating cycles because it creates cash flow to cover the company's liabilities. Operating Cycle Company/Years 2007 2008 2009 2010 2011 Average DAFODILCOM 138.75 101.85 143.10 73.97 108.98 113.33 ISNLTD - - - - - - BDCOM 232.13 246.28 211.66 151.58 153.98 199.13 Table 18: Operating Cycle 6.4. Market Performance 6.4.1. EPS The portion of a company's profit allocated to each outstanding share of common stock. Earnings per share serve as an indicator of a company's profitability. Calculated as:
  • 14. 14 EPS Company/Years 2007 2008 2009 2010 2011 Average DAFODILCOM 0.69 0.47 0.70 0.63 0.94 0.69 ISNLTD 1.08 1.22 1.18 1.05 0.55 1.02 BDCOM 0.67 0.92 0.86 0.61 0.51 0.71 Table 19: EPS 6.4.2. Payout Ratio The amount of earnings paid out in dividends to shareholders. Investors can use the payout ratio to determine what companies are doing with their earnings. Calculated as: Payout Ratio Company/Years 2007 2008 2009 2010 2011 Average DAFODILCOM 1.84 0.03 0.53 0.01 0.00 0.48 ISNLTD 0.90 0.32 0.42 0.00 0.00 0.33 BDCOM 0.00 0.00 0.00 0.00 0.53 0.11 Table 20: Payout Ratio Mostly depend in the company policy 6.4.3. PE Ratio The P/E looks at the relationship between the stock price and the company s earnings. The P/E is the most popular metric of stock analysis, although it is far from the only one you should consider. P/E = Stock Price / EPS
  • 15. 15 PE Ratio Company/Years 2007 2008 2009 2010 2011 Average DAFODILCOM 26.13 25.50 18.65 22.22 14.89 21.48 ISNLTD 15.28 14.75 20.34 20.95 49.09 24.08 BDCOM 32.84 20.65 20.93 28.69 34.80 27.58 Table 2119: PE Ratio Ranking in terms of Market performance Rank EPS Payout P/E 1 ISNLTD BDCOM BDCOM 2 BDCOM ISNLTD ISNLTD 3 DAFODILCOM DAFODILCOM DAFODILCOM Table 22: Ranking in terms of Market performance CONCLUSION It is to be concluded for this study that, this is a very difficult to make decision about any of the firms performance and the measurement tools, because all the formulas and functions are applied to attain an specific requirement of the firm as the part of the firm s financial strategy. So, the qualitative information will also need to understand the purpose of the firm to use any of the tools to measure their performance. Finally it could be recommended that, the importance of the ratio analysis depends on the stakeholder s specific need and the situational requirements.
  • 16. 16 ANNEXURE -I (BALANCE SHEET OF Daffodil Computers) Daffodil Computers Limited Balance Sheet As at 30 June 2007 Particulars Notes 30 June 2007 30 June 2006 Taka Taka APPLICATION OF FUNDS Non-Current Assets Fixed Assets (At cost) 4 73,989,988 73,823,828 Less: Accumulated Depreciation 31,692,765 26,731,842 42,297,223 47,091,986 Customized Software Development 5 32,791,653 32,648,138 Work-in-Progress (Customized Software Development) 6 832,861 2,019,696 Web Development 7 - 16,199,678 Investment in Subsidiary JS E- Recruitment Ltd. 8 18,049,678 - Deferred Revenue Expenditure 9 3,044,435 3,805,544 Current Assets Inventories 10 49,758,534 53,224,857 Sundry Debtors 11 48,062,844 59,539,560 Advances, Deposits and Prepayments 12 130,058,457 114,490,782 Cash & Cash Equivalents 13 3,488,997 15,854,521 231,368,832 243,109,720 Less: Current Liabilities Bank Loans, Overdraft and Credit 14 68,348,609 79,531,649 Trade Creditors 15 6,918,217 4,205,859 Other Creditors 16 - 910,000 Liabilities for Expenses 17 5,706,021 5,093,205 Unclaimed Dividend 332,185 3,223,200 Provision for Income Tax 18 11,023,199 6,061,226 92,328,231 99,025,139 Net Current Assets 139,040,602 144,084,581 Total 236,056,451 245,849,624 SOURCES OF FUNDS Shareholders' Equity Share Capital 19 175,000,000 175,000,000 Reserve & Surplus Profit & Loss A/c 20 43,556,451 51,599,624 Dividends Proposed Dividend 36 17,500,000 19,250,000 Shareholders' Equity 236,056,451 245,849,624 Total 236,056,451 245,849,624
  • 17. 17 Daffodil Computers Limited Profit and Loss Account For the year ended 30 June 2007 Particulars Notes 2006-07 2005-06 Taka Taka Net Sales 21 255,605,075 318,358,099 Cost of Goods Sold 22 (206,631,145) (259,996,275) Gross Profit 48,973,930 58,361,824 Operating Expenses: Administrative Expenses 23 (25,699,185) (26,658,302) Selling & Distribution Expenses 24 (2,166,554) (2,944,594) Financial Expenses 25 (7,207,517) (4,702,951) (35,073,256) (34,305,847) Operating Profit 13,900,674 24,055,977 Other Income 26 518,126 1,592,122 Net Profit Before Tax 14,418,800 25,648,099 Provision for Income Tax 18 (2,361,973) (1,370,837) Net Profit After Tax 12,056,827 24,277,262 Profit/(Loss) brought forward 51,599,624 46,861,731 Prior year adjustment: Short Provision for Income Tax for the year 2004-05 (2,600,000) - Short Provision for Income Tax for the years 2002-03 & 2003-04 18 - (289,369) (2,600,000) (289,369) Profit available for Appropriation 61,056,451 70,849,624 Proposed Dividend 36 17,500,000 19,250,000 Profit/(Loss) carried forward 43,556,451 51,599,624 Earning per Share (EPS) 27 0.69 1.39
  • 18. 18 Daffodil Computers Limited Cash Flow Statement For the year ended 30 June 2007 PARTICULARS 2006-07 2005-06 Taka Taka A. Cash flow from Operating Activities: Cash Received from Customers & Others 270,003,037 333,533,404 Cash Paid to Suppliers, Employees & Others (234,631,621) (278,939,161) Cash generated from Operations: 35,371,416 54,594,243 Interest income on FDR 416,841 1,403,095 Bank Loan Interest & Lease Rental paid (7,207,517) (4,702,951) VAT paid (2,819,961) (2,035,561) Income Tax Paid/Income Tax paid in advance (2,103,532) (389,453) Net cash flow from operating activities 23,657,247 48,869,373 B. Cash flow from Investing Activities: Net Purchase of property, plant & equipment (166,160) (235,140) Investment made (Customized software development) (1,869,391) (22,990,517) Work-in-Progress (Customized software development) 1,186,835 (2,019,696) Investment made (Web Development) - (1,620,000) Investment made in JS E-Recruitment Ltd. (1,850,000) - Net cash used in investing activities (2,698,716) (26,865,353) C. Cash flow from Financing Activities: Bank Loan, Overdrafts & Credit (11,183,040) (2,619,612) Dividend Paid (22,141,015) (23,339,500) Net Cash used in Financing Activities (33,324,055) (25,959,112) Net Increase/(Decrease) in Cash & Cash Equivalents (12,365,524) (3,955,092) Cash & Cash Equivalents at Opening 15,854,521 19,809,613 Cash & Cash Equivalents at Closing 3,488,997 15,854,521
  • 19. 19
  • 20. 20
  • 21. 21
  • 22. 22
  • 23. 23
  • 24. 24
  • 25. 25
  • 26. 26
  • 27. 27
  • 28. 28
  • 29. 29
  • 30. 30
  • 31. 31
  • 32. 32
  • 33. 33
  • 34. 34
  • 35. 35 ANNEXURE-II (BALANCE SHEET OF INFORMATION SERVICES NETWORK)
  • 36. 36
  • 37. 37
  • 38. 38
  • 39. 39
  • 40. 40
  • 41. 41
  • 42. 42
  • 43. 43
  • 44. 44
  • 45. 45
  • 46. 46
  • 47. 47
  • 48. 48
  • 49. 49
  • 50. 50
  • 51. 51
  • 52. 52
  • 53. 53
  • 54. 54
  • 55. 55 ANNEXURE-III (BALANCE SHEET OF BDCOM ONLINE LIMITED)
  • 56. 56
  • 57. 57
  • 58. 58
  • 59. 59
  • 60. 60
  • 61. 61
  • 62. 62
  • 63. 63
  • 64. 64
  • 65. 65
  • 66. 66
  • 67. 67
  • 68. 68
  • 69. 69