Recommended

Recommended
More Related Content
Similar to Rogersville Shale Compostion Reading Between the Plates Maryville over Rome, plates 21 over 23 b logs
Similar to Rogersville Shale Compostion Reading Between the Plates Maryville over Rome, plates 21 over 23 b logs (20)
More from Dexter Marsh
More from Dexter Marsh (20)
Recently uploaded
Recently uploaded (20)
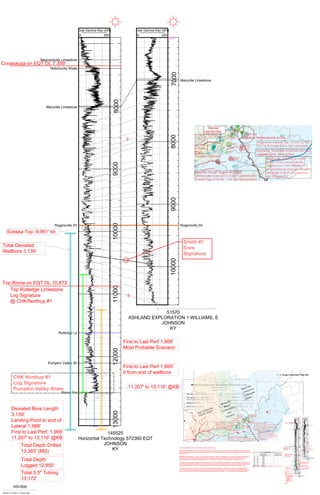
Rogersville Shale Compostion Reading Between the Plates Maryville over Rome, plates 21 over 23 b logs
- 1. ? ? ? ? 18 15 67 4 17 31 14 620 11 10 28 5 25 5 1 16 35 13 20 10 4 3 1 11 15 2 0 4 0 4 14 0 31 17 3 19 17 16 13 25 3 16 9 20 10 10 20 10 20 30 10 20 10 10 10 0 Sandstone percentages are derived from lithologic fractions calculated by computer from digital well log data. The quality of these data are dependent on the original log quality and the accuracy of the lithology calculation. For these maps, rocks were classified as sandstone if the sandstone component calculated was greater than or equal to 40%. Well locations indicated with a + symbol are partial penetrations, and these values are not necessarily honored by the contours. Rome Formation Net Sandstone Percentage Map Contour interval 10% Scale 1:1,000,000 0–10% sandstone with porosity >4% 10–20% sandstone with porosity >4% 20–30% sandstone with porosity >4% 30–40% sandstone with porosity >4% >40% sandstone with porosity >4% Well penetrating entire Rome Fm Well penetrating partial Rome Fm (data not necessarily honored by contours) Surface Fault (Ky.) Rome Trough Outline Rome Trough Consortium Rome Formation Net Sandstone Percentage map Contour Interval 10% Scale 1:1,000,000 3216 0 16 48 64 80 Kilometers 16 0 16 32 48 64 80 Miles Rome Trough Consortium: Plate 23B Maryville Limestone Carbonate Ramp Eau Claire Fm. Clastic Shelf Conasauga Shale Intrashelf Basin Maryville Limestone Carbonate Ramp Maryville Mixed Carbonates and Clastics 3216 0 16 48 64 80 Kilometers 16 0 16 32 48 64 80 Miles EQT IEP XEC CHK TOC 4.8 CHK XEC IEP COG HRD Fannin 537 1st Production LO White 529533 Fee Margincrest Prospect Migration Perpendicular to Dip Rogersville Subsea Top -10,034' by 758' thick RGV & Rutledge below high carbonate Rogersville Subsea Top -8,318' by 744' thick Rogersville Subsea Top -8,337' by 434' Thick On-lapping Local Minor Topography would make a good example for textbook Rogersville Subsea top -8,961' by 973' Thick Lower Gamma Gamma Low< Ash Williams & accumulated at much slower rate carbonate in EQT vs Clastics in Ash Williams??? Rogersville Thickness Undefined this map suggests higher sand content Ashland Williams #1 Maryville through Rogersville higher accumulation rate +20% of EQT Location RGV Subsea Top -8,520 by 1,100' partial penetration At A Glance Insights Into The Composition of the Rogersville shale. * New Rogersville Shale well locations and opportunities within the Rome Trough of Eastern Kentucky including the Exxon Smith #1 well, the location of the highest documented Rogersville TOC and the preferred migration pathway suggested by Ryder in Open-File Report 05-1443. *. Highlighting the differences in make up of the Maryville Limestone (Plate 21 transparency) which directly overlies the Rogersville Shale overlain on base map showing the high porosity Rome Net Sands (plate 23-B) that are below the Rogersville shale hydrocarbon kitchen. .Modified from Plates 23-B and 21 of the Rome Trough Consortium Study by Harris and Others. * Far right shows comparison between the gamma logs from the EQT-Horizontal Technologies 1-H and the Ashland Williams #1 well the EQT log is marked MD and without a TVD or directional survey it is hard to tell but the survey tells us it is vertical. Terminology issues between the different O&G companies is obvious in the comparison of log signatures compared to the drillers Logs. * This should be a good "at a glance" indicator of the relative ratio of carbonates vs clastics within the underlying Rogersville in relation to unconventional completions as well as the potential for high quality sands in the Rome below and the Maryville directly above to have received direct and or substantial hydrocarbon charge from migration out of the self-sourcing Rogersville shale. Stacked Opportunities 145525 Horizontal Technology 572360 EQT JOHNSON KY 51570 ASHLAND EXPLORATION 1 WILLIAMS, E JOHNSON KY 0 200 Total Gamma Ray (API) 0 200 Total Gamma Ray (API) Maynardville Limestone Nolichucky Shale Maryville Limestone Maryville Limestone Rogersville Sh Rogersville Sh Rutledge Ls Pumpkin Valley Sh Rome Fm 8000900010000110001200013000 70008000900010000 HS=500 PETRA 1/17/2017 11:40:57 AM Conasauga on EQT DL 7,359' Top Rome on EQT DL 10,873' Total Depth Drilled 13,383' (MD) Total Depth Logged 12,850' Total 5.5" Tubing 13,172' Deviated Bore Length 3,139' Landing Point to end of Lateral 1,988' First to Last Perf. 1,909' 11,207' to 13,116' @KB Total Deviated Wellbore 3,139' First to Last Perf 1,909' Most Probable Scenario First to Last Perf 1,909' if from end of wellbore 11,207' to 13,116' @KB ? Top Rutledge Limestone Log Signature @ CHK/Northup #1 CHK Northup #1 Log Signature Pumpkin Valley Shale Subsea Top -8.961' kb ? Smith #1 Core Signature EQT Rogersville Top Below TD in Williams Well