SCIMAP - David Higgins, Tees Rivers trust
•Download as PPTX, PDF•
1 like•813 views

Talks provided at the Scottish Fisheries Co-ordination Centre/Institute of Fisheries Management MAPPING FISHERIES workshop in Edinburgh on March 1st-2nd 2016

Recommended
Recommended
More Related Content
What's hot
Viewers also liked
Viewers also liked (15)
Similar to SCIMAP - David Higgins, Tees Rivers trust
Similar to SCIMAP - David Higgins, Tees Rivers trust (20)
More from Scottish Fisheries Co Ordination Centre
More from Scottish Fisheries Co Ordination Centre (20)
Recently uploaded
Recently uploaded (20)
SCIMAP - David Higgins, Tees Rivers trust
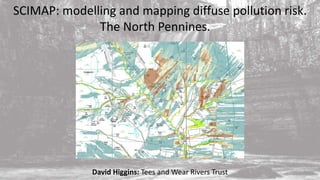
- 1. SCIMAP: modelling and mapping diffuse pollution risk. The North Pennines. David Higgins: Tees and Wear Rivers Trust
- 2. Tees and Wear River Trusts: EA funded Metal Mines Project Introduction and background GIS-based desktop – SCIMAP and literature Walkover surveys Developing costed restoration plans
- 3. SCIMAP www.scimap.org.uk Risk map for fine sediment Route risk through catchment Point scale risk Surface flow index Saturation propensity channels erodability Stream power Upslope area slope Land cover DEM Rain map
- 4. Farmer 1: ‘a mile out and not representing the situation on the farm.’ ‘the model is simply wrong and doesn’t fit with what actually happens’ ‘had not known a time when the drain couldn’t cope with the amount of runoff even in severe downpours.’ Testing the model
- 5. Farmer 2: ‘when the culvert becomes blocked with debris, the water does follow the locations shown on the map (SCIMAP).’
- 6. Farmer 3: ‘the model is right but the farming system changes the result’ ‘the farm is a very low risk (due to) the farming system we have which reduces runoff.’
- 7. Farmer 4: ‘above the road (SCIMAP) appears to be reasonably accurate but the water is picked up by drains once it reaches the road and is redirected away from the lower sections of the farm.’
- 8. SCIMAP outputs in channel Erosion sources x surface flow In channel fine sediment risk
- 9. Tees and Wear River Trusts Metal Mines Project GIS-based desktop – SCIMAP
- 10. Four catchments failing WFD Pb, Zn, Cd.
- 11. The SCIMAP Model: Identifying risky locations Connection and disconnection Hillslope Spoil heap Surface flow Connection or disconnection River
- 12. Strong connection and risk of fine sediment delivery, here the stream bank is severely eroded. Area of eroding spoil heap undercut by stream. Area of extensive mine spoil, workings and bare earth. SCIMAP confirms strong connectivity and risk of fine sediment delivery and by implication heavy metal delivery. This fits with the EA investigations so offers ground truthing of the model. SCIMAP outputs for Hudeshope Beck. Blue and brown colours show hydrological connectivity and fine sediment risk with the brown areas posing the greatest risk of fine sediment delivery.
- 13. SCIMAP: Coldberry and Marl Beck, 1m LIDAR
- 14. A step change in risk factor?
- 15. Overlaying metal mine/spoil heap locations
- 16. Tees and Wear River Trusts Metal Mines Project Walkover Surveys
- 17. Proposed Methodology for Metal Mines Project River Catchment Zone Description Priority (1 high priority…3 lowest priority) Riparian Eroding bank passing through lead mining zone 1 Eroding bank undermining spoil heap 1 Eroding bank 100 m d/s of lead mining zone 2 Eroding bank u/s of lead mining zone 3 2 Locations closest to the river bank can be assumed to pose the greatest risk. Where these are being undercut by the river it seems likely the risk is being realised. Proposed Methodology for Metal Mines Project ment Zone Description Priority (1 highest priority…3 lowest priority) Comments an Eroding bank passing through lead mining zone 1 The lead mining locations closest to the river bank can be assumed to pose the highest risk. Where these locations are being undercut by the river the risk it seems likely that the risk is being realised. Eroding bank undermining spoil heap 1 Eroding bank 100 m d/s of lead mining zone 2 Eroding bank u/s of lead mining zone 3
- 18. Floodplain Bare/un-vegetated soil in lead mining zone 1: > 50m2 2: 20 – 50m2 3: < 20m2 Lead mines, workings or spoil heaps present 1: if connected by surface flow to a watercourse as identified by SCIMAP 2: if not connected to a watercourse in SCIMAP Catchment Bare/un-vegetated soil within lead mining area connected to a watercourse as identified by SCIMAP 1: > 50m2 2: 20 – 50m2 3: < 20m2 Spoil heaps connected to a watercourse as identified by SCIMAP 1 Bare/un-vegetated soil in wider 3 Pollution sources in the floodplain will be impact rivers if connected and if they create patches of bare soil. Smaller patches of bare soil may suggest other issues, e.g. livestock erosion, larger patches could be due to heavy metal pollution. SCIMAP can describe which pollution sources are connected by surface flow.
- 19. Floodplain Lead mines, workings or spoil heaps present 1: if connected by surface flow to a watercourse as identified by SCIMAP 2: if not connected to a watercourse in SCIMAP Catchment Bare/un-vegetated soil within lead mining area connected to a watercourse as identified by SCIMAP 1: > 50m2 2: 20 – 50m2 3: < 20m2 Spoil heaps connected to a watercourse as identified by SCIMAP 1 Bare/un-vegetated soil in wider catchment that is not connected by surface flows and is located outside of any known lead mining zone 3 Notes: These methods are a proposed working route to identifying sources of heavy metal pollution, assessing their prior methods in data-poor catchments. Where data exists that suggests a diffuse pollution source any location can be assigneThe wider catchment poses less of a risk due to greater distance from a watercourse. However, SCIMAP can describe where pollution sources maybe connected to a watercourse by surface flow. These can then be assigned a higher risk rating.
- 20. Gully formation and erosion scars delivering direct to watercourse
- 21. Numerous seepages and dressing floor sediments delivering to watercourse
- 22. Bank erosion of contaminated soils
- 23. Car parking area is the main area of concern
- 24. Designed from dressing floor sediments, unconsolidated and highly erodible…abutting stream
- 25. 2nd area of main concern spoil heaps eroding into stream
- 26. Tees and Wear River Trusts Metal Mines Project Developing costed restoration plans
- 28. Key Area of mine spoil SCIMAP outputs, browns show high connectivity and eeeeeeeeee fine sediment delivery, blues moderate and whites very e low, or no, risk. Hudeshope Beck Map 1 Map 2 Map 3 Map 4 Map 5
- 29. The blue and brown zones within this spoil area require surveying. Again the blue and brown zones need surveying as does the area where the stream cuts through the spoil area. The same here, blue and brown zones as well as the locations where watercourses cut through the spoil area require surveying. Map 2
- 30. Aerial view of bare soils ©Google maps
- 31. Overview
Editor's Notes
- SCIMAP is a risk based modelling tool that relies on a flow of data in order to asses risk of diffusion pollution. The two main inputs are the DEM and a landcover map converted into risk categories with a risk value between 1 and 10. A rainfall map can be added or a constant grid created and then everything else can be calculated resulting in a map showing the risk of erosion of any point in the landscape and a network index. By multiplying these together we can get a risk map of the most probable locations that will result in diffused pollution. This has been carried out a 10 * 10 m scale.
- This farmer was the most negative. It was quite difficult explaining the concept of connected sediment sources. He concentrated on where standing water accumulated and argued against the model despite there being some relevance to the on-ground situation. The area of greatest risk didn’t appear to be realised because a drain (or a sinkhole in the limestone geology) was gathering surface flow and redirecting it through subterranean passages.
- Here the landowner accepted that without extensive drainage the model would represent the surface conditions.
- Again this landowner accepted that the model would be fairly accurate had his farming system been managed poorly.
- Again the model picks up the situation until drainage redirects surface flow.