SlideShare a Scribd company logo
1 of 32
Books on Politics Network-
2004
Objective: To analyse a graphical
representation of a network
Coral reef
food web,
Cuba
233 vertices
3,753 edges
Data: http://datadryad.org/resource/doi:10.5061/dryad.c213h
Objective: To analyse a graphical
representation of a network
CMT111
Students,
Cardiff
26 vertices
30 edges
Objective: To analyse a graphical
representation of a network
Purchase of political books,
USA
105 vertices
441 edges
Data courtesy of Valdis Kreb available at: http://www-personal.umich.edu/~mejn/netdata/
Limitations
• Number of purchases missing from database
• No weights : Number of buyers co-purchased the
books
Mathematica
• Importing data
• Will not read as wide a variety of CSV formats as Gephi
• Can read .gml, .gv, .dot, .graphml, .gxl, .col, .g6, .s6, .gw, .net, .tgf
• Use Map or create a rule to show links (->) from one column of a CSV onto
another
• Other attributes
• More difficult to show vertex/edge attributes than in Gephi but still ppssiblt to
highlight using HighlightGraph[g, x]
• Built-in functions
• Very intuitive and well documented:
https://reference.wolfram.com/language/guide/GraphsAndNetworks.html
Book
customer who
has purchased both
books (endpoints)
NODE
LINK
This graph is
unweighted: edges do not have associated weights
undirected: all edges travel in both directions
contains loops: no vertex is linked directly to itself
simple: undirected, unweighted, loop-free and lacks multiple edges
incomplete: each vertex is not connected to every other vertex
cyclic: contains at least one cycle
not bipartite: vertices cannot be divided into two disjoint sets
UndirectedGraphQ[books]
WeightedGraphQ[books]
CompleteGraphQ[books]
SimpleGraphQ[books]
BipartiteGraphQ[books]
LoopFreeGraphQ[books]
AcyclicGraphQ[books]
{6, 4, 4, 23, 8, 7, 11, 8, 25, 16, 15, 18, 25, 13, 9, 5, 3, 5, 3, 5, 10, 5, 7, 9, 9,
5, 9, 9, 3, 4, 20, 11, 5, 9, 5, 10, 5, 7, 7, 8, 18, 8, 6, 5, 5, 6, 4, 18, 4, 8, 3, 6,
5, 5, 6, 4, 4, 5, 13, 5, 6, 4, 6, 4, 9, 7, 21, 6, 4, 5, 7, 15, 22, 21, 16, 16, 13, 7,
5, 8, 4, 4, 9, 8, 23, 5, 14, 5, 5, 6, 5, 8, 3, 7, 7, 4, 6, 6, 5, 12, 12, 5, 4, 2, 3}
VertexDegree[books]
Vertex degrees:
Histogram[VertexDegree[books], ChartStyle -> Blue,
AxesLabel -> {HoldForm[Vertex degree], HoldForm[Frequency]},
PlotLabel -> None, LabelStyle -> {14, GrayLevel[0]}]
MatrixForm[GraphDistanceMatrix[books]]
Distance matrix
Array plot: distance matrix
ArrayPlot[GraphDistanceMatrix[books]]
Max[Flatten[GraphDistanceMatrix[books]]]
OR
GraphDiameter[books]
Diameter = 7
Radius = 4
GraphRadius[books]
Maximum and minimum eccentricities of any vertex:
Eccentricity Centrality
HighlightGraph[books, VertexList[books],
VertexSize ->
Thread[VertexList[books] ->
Rescale[EccentricityCentrality[books]]]]
Increases as maximum distances to every other reachable node increases
Closeness Centrality
HighlightGraph[books, VertexList[books],
VertexSize ->
Thread[VertexList[books] ->
Rescale[ClosenessCentrality[books]]]]
Increases as average distance to other nodes increases
Betweenness Centrality
HighlightGraph[books, VertexList[books],
VertexSize ->
Thread[VertexList[books] ->
Rescale[BetweennessCentrality[books]]]]
Increases as node lies on more shortest paths between other node-pairs
Degree Centrality
HighlightGraph[books, VertexList[books],
VertexSize ->
Thread[VertexList[books] ->
Rescale[DegreeCentrality[books]]]]
Increases as vertex degree increases
a = ListPlot[EccentricityCentrality[books], Filling -> Axis, PlotStyle -> Red]
b = ListPlot[ClosenessCentrality[books], Filling -> Axis, PlotStyle -> Magenta]
c = ListPlot[RadialityCentrality[books], Filling -> Axis, PlotStyle -> Cyan]
d = ListPlot[DegreeCentrality[books], Filling -> Axis]
gg = GraphicsGrid[{{a, b}, {c, d}}]
Export["CentralityGrid.png", gg]
Eccentricity Closeness
Radiality Degree
Dual Hub
HighlightGraph[books, GraphHub[books]]
Nodes with the highest vertex degree are returned
Hub Neighbours
HighlightGraph[books, NeighborhoodGraph[books, GraphHub[books]]]
CommunityGraphPlot[books]
Communities: Small world graph (Modular)
Graph partition:
minimises number of endpoints having edges in each part
HighlightGraph[books,FindGraphPartition[books]]
Graph communities:
maximises edges joining nodes within communities
with relatively fewer edges joining to nodes in other
communities
HighlightGraph[books, FindGraphCommunities[books]]
Cliques
Largest set of connected vertices
HighlightGraph[books, Subgraph[books, FindClique[books]]]
Cliques
Largest set of connected vertices within 2 edges of each other
HighlightGraph[books, Subgraph[books, FindKClique[books, 2]]]
Cliques
Largest set of connected vertices within 3 edges of each other
HighlightGraph[books, Subgraph[books, FindKClique[books, 3]]]
Cliques
Largest set of connected vertices within 4 edges of each other
HighlightGraph[books, Subgraph[books, FindKClique[books, 4]]]
Cliques
Largest set of connected vertices within 5 edges of each other
HighlightGraph[books, Subgraph[books, FindKClique[books, 5]]]
Cliques
Largest set of connected vertices within 6 edges of each other
HighlightGraph[books, Subgraph[books, FindKClique[books, 6]]]
Cliques
Largest set of connected vertices within 7 (=diameter)
edges of each other
HighlightGraph[books, Subgraph[books, FindKClique[books, 7]]]
Lessons & Conclusions
• Mathematica Vs Gephi on Data Visualization
• Gephi struggles with larger datasets, crashes on OS X, cannot ‘undo’
• Gephi good a pulling apart larger datasets for easier visualisation, takes a wider range of input
formats, can visualise ‘multiple graphs’ more easily
• All the other functions within Mathematica at your disposal to aid network analysis e.g. Plot
• Source of Data Sets
• Working with a dataset of sufficient size but not so big that it cannot be comprehended.
• Analysis of sub-networks

More Related Content

Similar to Book buyer network Graph Analysis

Duarte ms template_download
Duarte ms template_downloadDuarte ms template_download
Duarte ms template_download
artecxt
 
Aed1222 lesson 6
Aed1222 lesson 6Aed1222 lesson 6
Aed1222 lesson 6
nurun2010
 
Aed1222 lesson 6 2nd part
Aed1222 lesson 6 2nd partAed1222 lesson 6 2nd part
Aed1222 lesson 6 2nd part
nurun2010
 

Similar to Book buyer network Graph Analysis (20)

GraphDatabases
GraphDatabasesGraphDatabases
GraphDatabases
 
Introduction to graph databases in term of neo4j
Introduction to graph databases in term of neo4jIntroduction to graph databases in term of neo4j
Introduction to graph databases in term of neo4j
 
Data Modeling with Neo4j
Data Modeling with Neo4jData Modeling with Neo4j
Data Modeling with Neo4j
 
Network analysis lecture
Network analysis lectureNetwork analysis lecture
Network analysis lecture
 
graph aditya.pptx
graph aditya.pptxgraph aditya.pptx
graph aditya.pptx
 
Session 04 communicating results
Session 04 communicating resultsSession 04 communicating results
Session 04 communicating results
 
Session 04 communicating results
Session 04 communicating resultsSession 04 communicating results
Session 04 communicating results
 
Clustering on DSS
Clustering on DSSClustering on DSS
Clustering on DSS
 
Engineering Data Science Objectives for Social Network Analysis
Engineering Data Science Objectives for Social Network AnalysisEngineering Data Science Objectives for Social Network Analysis
Engineering Data Science Objectives for Social Network Analysis
 
Datascape Introduction
Datascape IntroductionDatascape Introduction
Datascape Introduction
 
Leveraging Multiple GPUs and CPUs for Graphlet Counting in Large Networks
Leveraging Multiple GPUs and CPUs for  Graphlet Counting in Large Networks Leveraging Multiple GPUs and CPUs for  Graphlet Counting in Large Networks
Leveraging Multiple GPUs and CPUs for Graphlet Counting in Large Networks
 
Start From A MapReduce Graph Pattern-recognize Algorithm
Start From A MapReduce Graph Pattern-recognize AlgorithmStart From A MapReduce Graph Pattern-recognize Algorithm
Start From A MapReduce Graph Pattern-recognize Algorithm
 
Duarte ms template_download
Duarte ms template_downloadDuarte ms template_download
Duarte ms template_download
 
Bba 2001
Bba 2001Bba 2001
Bba 2001
 
The Power of Motif Counting Theory, Algorithms, and Applications for Large Gr...
The Power of Motif Counting Theory, Algorithms, and Applications for Large Gr...The Power of Motif Counting Theory, Algorithms, and Applications for Large Gr...
The Power of Motif Counting Theory, Algorithms, and Applications for Large Gr...
 
Gradoop: Scalable Graph Analytics with Apache Flink @ FOSDEM 2016
Gradoop: Scalable Graph Analytics with Apache Flink @ FOSDEM 2016Gradoop: Scalable Graph Analytics with Apache Flink @ FOSDEM 2016
Gradoop: Scalable Graph Analytics with Apache Flink @ FOSDEM 2016
 
Ling liu part 01:big graph processing
Ling liu part 01:big graph processingLing liu part 01:big graph processing
Ling liu part 01:big graph processing
 
105575916 maths-edit-new
105575916 maths-edit-new105575916 maths-edit-new
105575916 maths-edit-new
 
Aed1222 lesson 6
Aed1222 lesson 6Aed1222 lesson 6
Aed1222 lesson 6
 
Aed1222 lesson 6 2nd part
Aed1222 lesson 6 2nd partAed1222 lesson 6 2nd part
Aed1222 lesson 6 2nd part
 

Recently uploaded

會考英聽會考英聽會考英聽會考英聽會考英聽會考英聽會考英聽會考英聽會考英聽會考英聽
會考英聽會考英聽會考英聽會考英聽會考英聽會考英聽會考英聽會考英聽會考英聽會考英聽會考英聽會考英聽會考英聽會考英聽會考英聽會考英聽會考英聽會考英聽會考英聽會考英聽
會考英聽會考英聽會考英聽會考英聽會考英聽會考英聽會考英聽會考英聽會考英聽會考英聽
中 央社
 
SPLICE Working Group: Reusable Code Examples
SPLICE Working Group:Reusable Code ExamplesSPLICE Working Group:Reusable Code Examples
SPLICE Working Group: Reusable Code Examples
Peter Brusilovsky
 

Recently uploaded (20)

MOOD STABLIZERS DRUGS.pptx
MOOD     STABLIZERS           DRUGS.pptxMOOD     STABLIZERS           DRUGS.pptx
MOOD STABLIZERS DRUGS.pptx
 
Mattingly "AI & Prompt Design: Named Entity Recognition"
Mattingly "AI & Prompt Design: Named Entity Recognition"Mattingly "AI & Prompt Design: Named Entity Recognition"
Mattingly "AI & Prompt Design: Named Entity Recognition"
 
會考英聽會考英聽會考英聽會考英聽會考英聽會考英聽會考英聽會考英聽會考英聽會考英聽
會考英聽會考英聽會考英聽會考英聽會考英聽會考英聽會考英聽會考英聽會考英聽會考英聽會考英聽會考英聽會考英聽會考英聽會考英聽會考英聽會考英聽會考英聽會考英聽會考英聽
會考英聽會考英聽會考英聽會考英聽會考英聽會考英聽會考英聽會考英聽會考英聽會考英聽
 
Andreas Schleicher presents at the launch of What does child empowerment mean...
Andreas Schleicher presents at the launch of What does child empowerment mean...Andreas Schleicher presents at the launch of What does child empowerment mean...
Andreas Schleicher presents at the launch of What does child empowerment mean...
 
Analyzing and resolving a communication crisis in Dhaka textiles LTD.pptx
Analyzing and resolving a communication crisis in Dhaka textiles LTD.pptxAnalyzing and resolving a communication crisis in Dhaka textiles LTD.pptx
Analyzing and resolving a communication crisis in Dhaka textiles LTD.pptx
 
Observing-Correct-Grammar-in-Making-Definitions.pptx
Observing-Correct-Grammar-in-Making-Definitions.pptxObserving-Correct-Grammar-in-Making-Definitions.pptx
Observing-Correct-Grammar-in-Making-Definitions.pptx
 
Book Review of Run For Your Life Powerpoint
Book Review of Run For Your Life PowerpointBook Review of Run For Your Life Powerpoint
Book Review of Run For Your Life Powerpoint
 
ĐỀ THAM KHẢO KÌ THI TUYỂN SINH VÀO LỚP 10 MÔN TIẾNG ANH FORM 50 CÂU TRẮC NGHI...
ĐỀ THAM KHẢO KÌ THI TUYỂN SINH VÀO LỚP 10 MÔN TIẾNG ANH FORM 50 CÂU TRẮC NGHI...ĐỀ THAM KHẢO KÌ THI TUYỂN SINH VÀO LỚP 10 MÔN TIẾNG ANH FORM 50 CÂU TRẮC NGHI...
ĐỀ THAM KHẢO KÌ THI TUYỂN SINH VÀO LỚP 10 MÔN TIẾNG ANH FORM 50 CÂU TRẮC NGHI...
 
OS-operating systems- ch05 (CPU Scheduling) ...
OS-operating systems- ch05 (CPU Scheduling) ...OS-operating systems- ch05 (CPU Scheduling) ...
OS-operating systems- ch05 (CPU Scheduling) ...
 
How To Create Editable Tree View in Odoo 17
How To Create Editable Tree View in Odoo 17How To Create Editable Tree View in Odoo 17
How To Create Editable Tree View in Odoo 17
 
An Overview of the Odoo 17 Knowledge App
An Overview of the Odoo 17 Knowledge AppAn Overview of the Odoo 17 Knowledge App
An Overview of the Odoo 17 Knowledge App
 
VAMOS CUIDAR DO NOSSO PLANETA! .
VAMOS CUIDAR DO NOSSO PLANETA!                    .VAMOS CUIDAR DO NOSSO PLANETA!                    .
VAMOS CUIDAR DO NOSSO PLANETA! .
 
male presentation...pdf.................
male presentation...pdf.................male presentation...pdf.................
male presentation...pdf.................
 
Improved Approval Flow in Odoo 17 Studio App
Improved Approval Flow in Odoo 17 Studio AppImproved Approval Flow in Odoo 17 Studio App
Improved Approval Flow in Odoo 17 Studio App
 
FICTIONAL SALESMAN/SALESMAN SNSW 2024.pdf
FICTIONAL SALESMAN/SALESMAN SNSW 2024.pdfFICTIONAL SALESMAN/SALESMAN SNSW 2024.pdf
FICTIONAL SALESMAN/SALESMAN SNSW 2024.pdf
 
24 ĐỀ THAM KHẢO KÌ THI TUYỂN SINH VÀO LỚP 10 MÔN TIẾNG ANH SỞ GIÁO DỤC HẢI DƯ...
24 ĐỀ THAM KHẢO KÌ THI TUYỂN SINH VÀO LỚP 10 MÔN TIẾNG ANH SỞ GIÁO DỤC HẢI DƯ...24 ĐỀ THAM KHẢO KÌ THI TUYỂN SINH VÀO LỚP 10 MÔN TIẾNG ANH SỞ GIÁO DỤC HẢI DƯ...
24 ĐỀ THAM KHẢO KÌ THI TUYỂN SINH VÀO LỚP 10 MÔN TIẾNG ANH SỞ GIÁO DỤC HẢI DƯ...
 
Đề tieng anh thpt 2024 danh cho cac ban hoc sinh
Đề tieng anh thpt 2024 danh cho cac ban hoc sinhĐề tieng anh thpt 2024 danh cho cac ban hoc sinh
Đề tieng anh thpt 2024 danh cho cac ban hoc sinh
 
Trauma-Informed Leadership - Five Practical Principles
Trauma-Informed Leadership - Five Practical PrinciplesTrauma-Informed Leadership - Five Practical Principles
Trauma-Informed Leadership - Five Practical Principles
 
SPLICE Working Group: Reusable Code Examples
SPLICE Working Group:Reusable Code ExamplesSPLICE Working Group:Reusable Code Examples
SPLICE Working Group: Reusable Code Examples
 
e-Sealing at EADTU by Kamakshi Rajagopal
e-Sealing at EADTU by Kamakshi Rajagopale-Sealing at EADTU by Kamakshi Rajagopal
e-Sealing at EADTU by Kamakshi Rajagopal
 

Book buyer network Graph Analysis

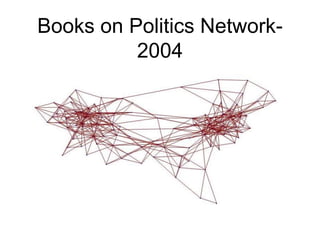
  • 1. Books on Politics Network- 2004
  • 2. Objective: To analyse a graphical representation of a network Coral reef food web, Cuba 233 vertices 3,753 edges Data: http://datadryad.org/resource/doi:10.5061/dryad.c213h
  • 3. Objective: To analyse a graphical representation of a network CMT111 Students, Cardiff 26 vertices 30 edges
  • 4. Objective: To analyse a graphical representation of a network Purchase of political books, USA 105 vertices 441 edges Data courtesy of Valdis Kreb available at: http://www-personal.umich.edu/~mejn/netdata/
  • 5. Limitations • Number of purchases missing from database • No weights : Number of buyers co-purchased the books
  • 6. Mathematica • Importing data • Will not read as wide a variety of CSV formats as Gephi • Can read .gml, .gv, .dot, .graphml, .gxl, .col, .g6, .s6, .gw, .net, .tgf • Use Map or create a rule to show links (->) from one column of a CSV onto another • Other attributes • More difficult to show vertex/edge attributes than in Gephi but still ppssiblt to highlight using HighlightGraph[g, x] • Built-in functions • Very intuitive and well documented: https://reference.wolfram.com/language/guide/GraphsAndNetworks.html
  • 7. Book customer who has purchased both books (endpoints) NODE LINK
  • 8. This graph is unweighted: edges do not have associated weights undirected: all edges travel in both directions contains loops: no vertex is linked directly to itself simple: undirected, unweighted, loop-free and lacks multiple edges incomplete: each vertex is not connected to every other vertex cyclic: contains at least one cycle not bipartite: vertices cannot be divided into two disjoint sets UndirectedGraphQ[books] WeightedGraphQ[books] CompleteGraphQ[books] SimpleGraphQ[books] BipartiteGraphQ[books] LoopFreeGraphQ[books] AcyclicGraphQ[books]
  • 9. {6, 4, 4, 23, 8, 7, 11, 8, 25, 16, 15, 18, 25, 13, 9, 5, 3, 5, 3, 5, 10, 5, 7, 9, 9, 5, 9, 9, 3, 4, 20, 11, 5, 9, 5, 10, 5, 7, 7, 8, 18, 8, 6, 5, 5, 6, 4, 18, 4, 8, 3, 6, 5, 5, 6, 4, 4, 5, 13, 5, 6, 4, 6, 4, 9, 7, 21, 6, 4, 5, 7, 15, 22, 21, 16, 16, 13, 7, 5, 8, 4, 4, 9, 8, 23, 5, 14, 5, 5, 6, 5, 8, 3, 7, 7, 4, 6, 6, 5, 12, 12, 5, 4, 2, 3} VertexDegree[books] Vertex degrees: Histogram[VertexDegree[books], ChartStyle -> Blue, AxesLabel -> {HoldForm[Vertex degree], HoldForm[Frequency]}, PlotLabel -> None, LabelStyle -> {14, GrayLevel[0]}]
  • 11. Array plot: distance matrix ArrayPlot[GraphDistanceMatrix[books]]
  • 12. Max[Flatten[GraphDistanceMatrix[books]]] OR GraphDiameter[books] Diameter = 7 Radius = 4 GraphRadius[books] Maximum and minimum eccentricities of any vertex:
  • 13. Eccentricity Centrality HighlightGraph[books, VertexList[books], VertexSize -> Thread[VertexList[books] -> Rescale[EccentricityCentrality[books]]]] Increases as maximum distances to every other reachable node increases
  • 14. Closeness Centrality HighlightGraph[books, VertexList[books], VertexSize -> Thread[VertexList[books] -> Rescale[ClosenessCentrality[books]]]] Increases as average distance to other nodes increases
  • 15. Betweenness Centrality HighlightGraph[books, VertexList[books], VertexSize -> Thread[VertexList[books] -> Rescale[BetweennessCentrality[books]]]] Increases as node lies on more shortest paths between other node-pairs
  • 16. Degree Centrality HighlightGraph[books, VertexList[books], VertexSize -> Thread[VertexList[books] -> Rescale[DegreeCentrality[books]]]] Increases as vertex degree increases
  • 17. a = ListPlot[EccentricityCentrality[books], Filling -> Axis, PlotStyle -> Red] b = ListPlot[ClosenessCentrality[books], Filling -> Axis, PlotStyle -> Magenta] c = ListPlot[RadialityCentrality[books], Filling -> Axis, PlotStyle -> Cyan] d = ListPlot[DegreeCentrality[books], Filling -> Axis] gg = GraphicsGrid[{{a, b}, {c, d}}] Export["CentralityGrid.png", gg] Eccentricity Closeness Radiality Degree
  • 18. Dual Hub HighlightGraph[books, GraphHub[books]] Nodes with the highest vertex degree are returned
  • 21. Graph partition: minimises number of endpoints having edges in each part HighlightGraph[books,FindGraphPartition[books]]
  • 22. Graph communities: maximises edges joining nodes within communities with relatively fewer edges joining to nodes in other communities HighlightGraph[books, FindGraphCommunities[books]]
  • 23.
  • 24.
  • 25. Cliques Largest set of connected vertices HighlightGraph[books, Subgraph[books, FindClique[books]]]
  • 26. Cliques Largest set of connected vertices within 2 edges of each other HighlightGraph[books, Subgraph[books, FindKClique[books, 2]]]
  • 27. Cliques Largest set of connected vertices within 3 edges of each other HighlightGraph[books, Subgraph[books, FindKClique[books, 3]]]
  • 28. Cliques Largest set of connected vertices within 4 edges of each other HighlightGraph[books, Subgraph[books, FindKClique[books, 4]]]
  • 29. Cliques Largest set of connected vertices within 5 edges of each other HighlightGraph[books, Subgraph[books, FindKClique[books, 5]]]
  • 30. Cliques Largest set of connected vertices within 6 edges of each other HighlightGraph[books, Subgraph[books, FindKClique[books, 6]]]
  • 31. Cliques Largest set of connected vertices within 7 (=diameter) edges of each other HighlightGraph[books, Subgraph[books, FindKClique[books, 7]]]
  • 32. Lessons & Conclusions • Mathematica Vs Gephi on Data Visualization • Gephi struggles with larger datasets, crashes on OS X, cannot ‘undo’ • Gephi good a pulling apart larger datasets for easier visualisation, takes a wider range of input formats, can visualise ‘multiple graphs’ more easily • All the other functions within Mathematica at your disposal to aid network analysis e.g. Plot • Source of Data Sets • Working with a dataset of sufficient size but not so big that it cannot be comprehended. • Analysis of sub-networks