
Recommended
Recommended
More Related Content
What's hot
What's hot (18)
Viewers also liked
Viewers also liked (16)
Similar to St. Louis Employment Update | October 2015
Similar to St. Louis Employment Update | October 2015 (20)
More from Blaise Tomazic
More from Blaise Tomazic (20)
Recently uploaded
Recently uploaded (20)
St. Louis Employment Update | October 2015
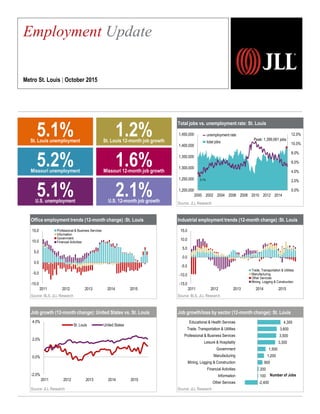
- 1. Total jobs vs. unemployment rate: St. Louis Source: JLL Research Industrial employment trends (12-month change) :St. Louis Source: BLS, JLL Research Job growth/loss by sector (12-month change): St. Louis Source: JLL Research Employment Update Metro St. Louis | October 2015 0.0% 2.0% 4.0% 6.0% 8.0% 10.0% 12.0% 1,200,000 1,250,000 1,300,000 1,350,000 1,400,000 1,450,000 2000 2002 2004 2006 2008 2010 2012 2014 Peak: 1,399,061 jobs 3.1% unemployment rate total jobs -15.0 -10.0 -5.0 0.0 5.0 10.0 15.0 2011 2012 2013 2014 2015 Trade, Transportation & Utilities Manufacturing Other Services Mining, Logging & Construction -2,400 100 200 900 1,200 1,500 3,300 3,500 3,600 4,300 Other Services Information Financial Activities Mining, Logging & Construction Manufacturing Government Leisure & Hospitality Professional & Business Services Trade, Transportation & Utilities Educational & Health Services Number of Jobs Office employment trends (12-month change) :St. Louis Source: BLS, JLL Research Job growth (12-month change): United States vs. St. Louis Source: JLL Research -10.0 -5.0 0.0 5.0 10.0 15.0 2011 2012 2013 2014 2015 Professional & Business Services Information Government Financial Activities -2.0% 0.0% 2.0% 4.0% 2011 2012 2013 2014 2015 St. Louis United States 5.1%U.S. unemployment 2.1%U.S. 12-month job growth 5.1%St. Louis unemployment 1.2%St. Louis 12-month job growth 5.2%Missouri unemployment 1.6%Missouri 12-month job growth
- 2. News on the street St. Louis businesses expanding, contracting, etc. American Electric Power | Logistics: contracting Chesterfield-based American Electric Power is selling its barge line, AEP River Operations, to American Commercial Lines owned by Platinum Equity for $550 million. Potentially affected by the acquisition are 102 AEP River Operations employees who work on the fourth floor of Central Park Square I at 16150 Main Circle Drive, a Class A office building of 100,600 square feet. The deal is expected to close by the end of 2015, subject to regulatory approval. Novolex | Manufacturing: contracting Novolex, a paper and plastics manufacturer, is laying off 92 workers and closing its plant at 1780 Belt Way Drive in Overland, Missouri, by the end of October. The Class B, 100,000 square-foot industrial facility is owned by Whitehawk Investment Co., LLC, and Hilex, Novolex’s parent company, was the only tenant. Novolex is based in Hartsville, South Carolina, and has 36 plants across the US. Perficient | IT: expanding St. Louis-based consulting and IT company, Perficient (NASDAQ: PRFT) just acquired competitor in Chattanooga, Tennessee, Market Street Solutions Inc. for $5.3 million in cash and common stock. The acquisition will create 30 new hires to expand Perficient’s IBM analytics and move the company into Tennessee. Square | Technology: expanding Square mobile payment technology company is filling 200 jobs in IT development, support and compliance and moving into a $850,000 expansion on @4240 in the Cortex innovation district. The new space is 17,000 square feet, 14,000 square feet larger than Square’s previous secret location in CIC@CET under the name Balbis. @4240’s average asking rate is $19.00 per square-foot. It was chosen over two downtown candidate locations, and it is Square’s eighth office worldwide. SunEdison | Energy: contracting In an effort to consolidate worldwide, solar developer SunEdison Inc. (NYSE: SUNE) is downsizing its workforce by 15 percent and cutting 20 percent of non-labor expenses. SunEdison’s corporate headquarters occupies the top three floors of Riverport Tower, a Class A office tower at 13736 Riverport Drive in Maryland Heights. It is unclear how many St. Louis employees will be affected by the layoffs. Industry employment stratification St. Louis Source: JLL Research ©2015 Jones Lang LaSalle IP, Inc. All rights reserved.For more information, contact: Blaise Tomazic | blaise.tomazic@am.jll.com Employment statistics St. Louis Aug 2013 Aug 2014 Aug 2015 Total Non-farm Employment 1,301,000 0.9% 1,315,100 1.1% 1,331,330 1.2% Unemployment Rate 7.3% 6.4% 5.1% St. Louis Supersectors Aug 2013 Aug 2014 Aug 2015 Mining, Logging & Construction 62,200 3.7% 62,200 0.0% 63,100 1.4% Manufacturing 110,800 -0.4% 113,400 2.3% 114,600 1.1% Trade, Transportation, & Utilities 245,900 0.7% 250,000 1.7% 253,600 1.4% Information 29,200 -3.0% 29,300 0.3% 29,400 0.3% Financial Activities 85,800 0.8% 86,100 0.3% 86,300 0.2% Professional & Business Services 200,600 5.0% 204,900 2.1% 208,400 1.7% Educational & Health Services 225,000 -1.6% 227,500 1.1% 231,800 1.9% Leisure & Hospitality 147,600 1.3% 151,500 2.6% 154,800 2.2% Other Services 45,800 -0.4% 46,200 0.9% 43,800 -5.2% Government 148,100 0.1% 144,000 -2.8% 145,500 1.0% 19% 17% 16%12% 11% 9% 6% 5% 3% 2% Trade, transportation and Utilities Educational and Health Services Professional and Business Services Leisure and Hospitality Government Manufacturing Financial Activities Mining, Logging and construction Other Services Information