SlideShare a Scribd company logo
1 of 41
Download to read offline
Module
2 Measures of Central Tendency
OUTLINE ( Teaching Hours - 5)
1. Introduction
1
1. Introduction
2. Mean
3. Median
4. Mode
By Tushar Bhatt, Assistant Professor in Mathematics, Atmiya University, Rajkot. 2/28/2020
Types of Data
Here we are study mainly 3-types of data (observations) :
2By Tushar Bhatt, Assistant Professor in Mathematics,
Atmiya University, Rajkot.
2/28/2020
Measure of Central Tendency
A single expression, representing the whole group , is selected which may
convey a fairly enough idea about the whole group . This single expression in
statistics is known as the average .
The average are generally the central part of the distribution and therefore
they are also called the measure of central tendency.
3
Now there are five types of measure of central tendency which are
commonly used . These are ,
1. ARITHMATIC MEAN
2. GEOMETRIC MEAN
3. HARMONIC MEAN
4. MEDIAN
5. MODE
By Tushar Bhatt, Assistant Professor in Mathematics,
Atmiya University, Rajkot.
2/28/2020
Measure of Central Tendency
4By Tushar Bhatt, Assistant Professor in Mathematics,
Atmiya University, Rajkot.
2/28/2020
Arithmetic Mean
There are three ways to obtain A.M for the given data :
1. A.M for Individual Observations :
Let
5By Tushar Bhatt, Assistant Professor in Mathematics,
Atmiya University, Rajkot.
2/28/2020
2. A.M for Discrete Observations :
Let
; , -
f di iX A A Assumed Mean d X Ai ifi
∑
= + = =
∑
Arithmetic Mean
There are three ways to obtain A.M for the given data :
3. A.M for Continuous Observations :
In this type of observations we have class and their
corresponding frequency are given then the A.M of
the given data is defined as :
6By Tushar Bhatt, Assistant Professor in Mathematics,
Atmiya University, Rajkot.
2/28/2020
the given data is defined as :
Arithmetic Mean
Ex-1 : Find the A.M of the marks obtained by 10 students of class X in
mathematics in a certain examination. The marks obtained are :
25,30,21,55,47,10,15,17,45,35.
Solu : Here the given observations are individual then
A.M =
7By Tushar Bhatt, Assistant Professor in Mathematics,
Atmiya University, Rajkot.
2/28/2020
A.M =
Therefore A.M is
Arithmetic Mean
Ex-2 : Find the A.M from the following frequency table:
Solu : Here the given observations are discrete then
Marks 52 58 60 65 68 70 75
No. Of
students
7 5 4 6 3 3 2
8By Tushar Bhatt, Assistant Professor in Mathematics,
Atmiya University, Rajkot.
2/28/2020
Solu : Here the given observations are discrete then
A.M = ; , -
f di iX A A Assumed Mean d X Ai ifi
∑
= + = =
∑
Arithmetic Mean
Marks(x) f d = x-A fd
52 7 -13 -91
58 5 -7 -35
60 4 -5 -20
65=A 6 0 0
9By Tushar Bhatt, Assistant Professor in Mathematics,
Atmiya University, Rajkot.
2/28/2020
65=A 6 0 0
68 3 3 9
70 3 5 15
75 2 10 20
Total 30 -7 -102
Arithmetic Mean
102
65 3.4 61.6
30
65
f d
i iX A
f
i
= − =
∑
= + = −
∑
10By Tushar Bhatt, Assistant Professor in Mathematics,
Atmiya University, Rajkot.
2/28/2020
Arithmetic Mean
Ex-3 : Find the A.M from the following data :
Class 0-30 30-60 60-90 90-120 120-150 150-180
Frequency 8 13 22 27 18 7
Solu : Here given data is continuous therefore,
11By Tushar Bhatt, Assistant Professor in Mathematics,
Atmiya University, Rajkot.
2/28/2020
Solu : Here given data is continuous therefore,
Where,
Arithmetic Mean
Class f Mid Value(X) d = X- A/ i fd
0-30 8 15 -2 -16
30-60 13 45 -1 -13
60-90 22 75 = A 0 0
12By Tushar Bhatt, Assistant Professor in Mathematics,
Atmiya University, Rajkot.
2/28/2020
60-90 22 75 = A 0 0
90-120 27 105 1 27
120-150 18 135 2 36
150-180 7 165 3 21
Total 95 55
Arithmetic Mean
55
75 30
95
75 17.36
= + ×
= +
13By Tushar Bhatt, Assistant Professor in Mathematics,
Atmiya University, Rajkot.
2/28/2020
75 17.36
92.36
= +
=
Arithmetic Mean
Ex-4 : Find the A.M from the following data :
Class < 10 < 20 < 30 < 40 < 50
Frequency 2 18 30 17 3
Solu : Here given data is continuous therefore,
14By Tushar Bhatt, Assistant Professor in Mathematics,
Atmiya University, Rajkot.
2/28/2020
Where,
Arithmetic Mean
Class f Mid
Value(X)
d = X- A/ i fd
0-10 2 5 -2 -4
10-20 18 15 -1 -18
20-30 30 25=A 0 0
15By Tushar Bhatt, Assistant Professor in Mathematics,
Atmiya University, Rajkot.
2/28/2020
30-40 17 35 1 17
40-50 3 45 2 6
Total 70 1
1
25 10 25 0.14 25.14
70
X
 
= + × = + = 
 
Geometric Mean
16By Tushar Bhatt, Assistant Professor in Mathematics,
Atmiya University, Rajkot.
2/28/2020
Ex – 1 : Find the Geometric mean of the numbers
50,100,200.
Solu : 3
. 50 100 200 100G M = × × =
Harmonic Mean
17By Tushar Bhatt, Assistant Professor in Mathematics,
Atmiya University, Rajkot.
2/28/2020
Ex – 1 : Find the Harmonic mean of 3 –observations
2,4 and 8.
Solu : 3 3
. 3.429
1 1 1 0.5 0.25 0.125
2 4 8
H M = = =
+ ++ +
Median
18By Tushar Bhatt, Assistant Professor in Mathematics,
Atmiya University, Rajkot.
2/28/2020
Median
19By Tushar Bhatt, Assistant Professor in Mathematics,
Atmiya University, Rajkot.
2/28/2020
Median
20By Tushar Bhatt, Assistant Professor in Mathematics,
Atmiya University, Rajkot.
2/28/2020
• M is near to the those cumulative frequency then their
corresponding value of observation is required median.
Median
21By Tushar Bhatt, Assistant Professor in Mathematics,
Atmiya University, Rajkot.
2/28/2020
Median
Ex- 1 : Find the median of the data
10, 18, 23, 40, 58, 65, 92,38
Solu : Arranging the data in ascending order, we get
10, 18, 23, 38, 40, 58, 65, 92
22By Tushar Bhatt, Assistant Professor in Mathematics,
Atmiya University, Rajkot.
2/28/2020
.
1
2 2
2
4 5
2
38 40
39
2
th th
th th
Here no of observations are even
n n
Value of observation Value of observation
Median
value of observation value of observation
   
+ +   
   ∴ =
+
=
+
= =
Median
Ex- 2 : Find the median of the data
6,20,43,50,19,53,0,37,78,1,15
Solu : Arranging the data in ascending order, we get
0,1,6,15,19,20,37,43,50,53,78
23By Tushar Bhatt, Assistant Professor in Mathematics,
Atmiya University, Rajkot.
2/28/2020
.
11 1
2
6
20
th
th
Here no of observations are odd
Median Value of observation
Value of observation
+ 
∴ =  
 
=
=
Median
Ex- 3 : Find the median of the following data
Solu : Here given data is discrete therefore we are using
the formula :
X 20 9 25 50 40 80
f 6 4 16 7 8 2
24By Tushar Bhatt, Assistant Professor in Mathematics,
Atmiya University, Rajkot.
2/28/2020
the formula :
Median
First arrange the data into ascending order :
X f Cumulative frequency
9 4 4
20 6 10
25By Tushar Bhatt, Assistant Professor in Mathematics,
Atmiya University, Rajkot.
2/28/2020
25 16 26
40 8 34
50 7 41
80 2 43
Median
1
; 43
2
22 ; 26
25, . 26
th
n
M observation n total of frequencies
whichis near tothecumulative frequency
whichis a corressponding observation of c f
+ 
= = = 
 
=
=
26By Tushar Bhatt, Assistant Professor in Mathematics,
Atmiya University, Rajkot.
2/28/2020
Median
Ex- 4: Find the median from the following data :
Class 0-30 30-60 60-90 90-120 120-150 150-180
Frequency 8 13 22 27 18 7
Solu : Here given observations are continuous therefore
27By Tushar Bhatt, Assistant Professor in Mathematics,
Atmiya University, Rajkot.
2/28/2020
Solu : Here given observations are continuous therefore
we will use the formula :
2
n
c
M L i
f
 
− 
= + × 
 
 
Median
Class f c.f
0-30 8 8
30-60 13 21
60-90 22 43
90-120 27 70
120-150 18 88
95
, 47.5 islies in the class 90 120
2 2
The median class 90 120
90
43
27
n
now
L
c
f
= = −
∴ = −
=
=
=
28By Tushar Bhatt, Assistant Professor in Mathematics,
Atmiya University, Rajkot.
2/28/2020
150-180 7 95
Total 95
27
30
f
i
=
=
47.5 43 4.5 30
90 30 90 90 5 95
27 27
M
− ×   
∴ = + × = + = + =     
29By Tushar Bhatt, Assistant Professor in Mathematics,
Atmiya University, Rajkot.
2/28/2020
Mode
30By Tushar Bhatt, Assistant Professor in Mathematics,
Atmiya University, Rajkot.
2/28/2020
Mode
31By Tushar Bhatt, Assistant Professor in Mathematics,
Atmiya University, Rajkot.
2/28/2020
Mode
32By Tushar Bhatt, Assistant Professor in Mathematics,
Atmiya University, Rajkot.
2/28/2020
Mode
Solu -1 : (i) Here the number 45 is repeated therefore
Mode = 45.
(ii) Here no number is repeat therefore the
given series has no mode.
(iii) Here two numbers 10 and 18 are repeated
33By Tushar Bhatt, Assistant Professor in Mathematics,
Atmiya University, Rajkot.
2/28/2020
(iii) Here two numbers 10 and 18 are repeated
therefore the given series has two mode
10 and 18.
Mode
2:Solu -2:
Class Frequency
0-10 10
10-20 14
34By Tushar Bhatt, Assistant Professor in Mathematics,
Atmiya University, Rajkot.
2/28/2020
20-30 19 Max. Frequency
30-40 17
40-50 13
Mode
Solu -2:
1
Modelclass is 20 30 becauseit has max.frequency
L= 20
f 14
= −
=
35By Tushar Bhatt, Assistant Professor in Mathematics,
Atmiya University, Rajkot.
2/28/2020
2 17
19
10
19 14 50
20 10 20 20 7.14 27.14
2(19) 14 17 7
m
f
f
i
Mode
=
=
=
 −
= + × = + = + = 
− − 
Mode
Solu -:3
Here 25 20
Mode 3 2 3(20) 2(25) 10
X and M
Z M X
= =
∴ = − = − =
36By Tushar Bhatt, Assistant Professor in Mathematics,
Atmiya University, Rajkot.
2/28/2020
Merits, Demerits and uses of Mean
Merits :
It can be easily calculated
Its calculations are based on all the observations
It is easy to understand
it is the average obtained by calculations and it does
37By Tushar Bhatt, Assistant Professor in Mathematics,
Atmiya University, Rajkot.
2/28/2020
it is the average obtained by calculations and it does
not depend upon any position.
It is rigidly defined by the mathematical formula
Demerits :
It may not be represented in actual data and so it is
theoretical.
The extreme values have greater effect on mean.
Merits, Demerits and uses of Mean
Demerits :
It can not be calculated if all the values are not
known.
It can not be determined for the qualitative data like
beauty, honesty etc.,.
38By Tushar Bhatt, Assistant Professor in Mathematics,
Atmiya University, Rajkot.
2/28/2020
beauty, honesty etc.,.
Uses of Mean :
It is extensively used in practical statistics
Estimates are always obtained by mean
Merits, Demerits and uses of Median
Merits :
It is easily understood.
It is not affected by extreme values
It can be located graphically
It is the best measure for qualitative data like beauty,
39By Tushar Bhatt, Assistant Professor in Mathematics,
Atmiya University, Rajkot.
2/28/2020
It is the best measure for qualitative data like beauty,
honesty etc.,.
Demerits :
It is not subject to algebraic treatments
It can not represent the irregular distribution series
It is a positional average and is based on the middle
item.
Merits, Demerits and uses of Median
Uses of Median :
It is useful in those cases where numerical
measurements are not possible.
It is generally used in studying phenomena like skill,
honesty, intelligence, etc.
40By Tushar Bhatt, Assistant Professor in Mathematics,
Atmiya University, Rajkot.
2/28/2020
honesty, intelligence, etc.
Thank
You
41By Tushar Bhatt, Assistant Professor in Mathematics,
Atmiya University, Rajkot.
2/28/2020
You

More Related Content

What's hot

Statistical Measures of Location: Mathematical Formulas versus Geometric Appr...
Statistical Measures of Location: Mathematical Formulas versus Geometric Appr...Statistical Measures of Location: Mathematical Formulas versus Geometric Appr...
Statistical Measures of Location: Mathematical Formulas versus Geometric Appr...BRNSS Publication Hub
 
Measures of central tendency - STATISTICS
Measures of central tendency - STATISTICSMeasures of central tendency - STATISTICS
Measures of central tendency - STATISTICSindianeducation
 
Presentation of data
Presentation of dataPresentation of data
Presentation of dataRuby Ocenar
 
An Introduction to Statistics
An Introduction to StatisticsAn Introduction to Statistics
An Introduction to StatisticsNazrul Islam
 
Lesson 1 05 measuring central tendency
Lesson 1 05 measuring central tendencyLesson 1 05 measuring central tendency
Lesson 1 05 measuring central tendencyPerla Pelicano Corpez
 
Lesson Plan- Measures of Central tendency of Data
Lesson Plan- Measures of Central tendency of DataLesson Plan- Measures of Central tendency of Data
Lesson Plan- Measures of Central tendency of DataElton John Embodo
 
Statistics Based On Ncert X Class
Statistics Based On Ncert X ClassStatistics Based On Ncert X Class
Statistics Based On Ncert X ClassRanveer Kumar
 
MEASURES OF DISPERSION OF UNGROUPED DATA
MEASURES OF DISPERSION OF UNGROUPED DATAMEASURES OF DISPERSION OF UNGROUPED DATA
MEASURES OF DISPERSION OF UNGROUPED DATAMISS ESTHER
 
Graphical Representation of Data
Graphical Representation of DataGraphical Representation of Data
Graphical Representation of Dataforgetfulmailer
 
Measures of Central Tendencies
Measures of Central TendenciesMeasures of Central Tendencies
Measures of Central TendenciesAngel Mae Longakit
 
NOTE STATISTIC BA301
NOTE STATISTIC BA301NOTE STATISTIC BA301
NOTE STATISTIC BA301faijmsk
 
Central tendency and dispersion
Central tendency and dispersionCentral tendency and dispersion
Central tendency and dispersionAnisur Rahman
 
Statistics in nursing research
Statistics in nursing researchStatistics in nursing research
Statistics in nursing researchNursing Path
 
analytical representation of data
 analytical representation of data analytical representation of data
analytical representation of dataUnsa Shakir
 
Revisionf2
Revisionf2Revisionf2
Revisionf2wind12
 
Data and their representations - statistics
Data and their representations - statisticsData and their representations - statistics
Data and their representations - statisticsindianeducation
 
Measures of central tendency (ungrouped data)
Measures of central tendency (ungrouped data)Measures of central tendency (ungrouped data)
Measures of central tendency (ungrouped data)LilianneSoriano
 
Assessment of Learning 1: Chapter 5 - Utilization of Assessment Data
Assessment of Learning 1: Chapter 5 - Utilization of Assessment DataAssessment of Learning 1: Chapter 5 - Utilization of Assessment Data
Assessment of Learning 1: Chapter 5 - Utilization of Assessment DataDonna Domulot
 
Statistik Chapter 2
Statistik Chapter 2Statistik Chapter 2
Statistik Chapter 2WanBK Leo
 

What's hot (20)

Statistical Measures of Location: Mathematical Formulas versus Geometric Appr...
Statistical Measures of Location: Mathematical Formulas versus Geometric Appr...Statistical Measures of Location: Mathematical Formulas versus Geometric Appr...
Statistical Measures of Location: Mathematical Formulas versus Geometric Appr...
 
Measures of central tendency - STATISTICS
Measures of central tendency - STATISTICSMeasures of central tendency - STATISTICS
Measures of central tendency - STATISTICS
 
Presentation of data
Presentation of dataPresentation of data
Presentation of data
 
An Introduction to Statistics
An Introduction to StatisticsAn Introduction to Statistics
An Introduction to Statistics
 
Lesson 1 05 measuring central tendency
Lesson 1 05 measuring central tendencyLesson 1 05 measuring central tendency
Lesson 1 05 measuring central tendency
 
Lesson Plan- Measures of Central tendency of Data
Lesson Plan- Measures of Central tendency of DataLesson Plan- Measures of Central tendency of Data
Lesson Plan- Measures of Central tendency of Data
 
Statistics Based On Ncert X Class
Statistics Based On Ncert X ClassStatistics Based On Ncert X Class
Statistics Based On Ncert X Class
 
MEASURES OF DISPERSION OF UNGROUPED DATA
MEASURES OF DISPERSION OF UNGROUPED DATAMEASURES OF DISPERSION OF UNGROUPED DATA
MEASURES OF DISPERSION OF UNGROUPED DATA
 
Graphical Representation of Data
Graphical Representation of DataGraphical Representation of Data
Graphical Representation of Data
 
Measures of Central Tendencies
Measures of Central TendenciesMeasures of Central Tendencies
Measures of Central Tendencies
 
NOTE STATISTIC BA301
NOTE STATISTIC BA301NOTE STATISTIC BA301
NOTE STATISTIC BA301
 
Central tendency and dispersion
Central tendency and dispersionCentral tendency and dispersion
Central tendency and dispersion
 
Statistics in nursing research
Statistics in nursing researchStatistics in nursing research
Statistics in nursing research
 
analytical representation of data
 analytical representation of data analytical representation of data
analytical representation of data
 
Revisionf2
Revisionf2Revisionf2
Revisionf2
 
Data and their representations - statistics
Data and their representations - statisticsData and their representations - statistics
Data and their representations - statistics
 
Measures of central tendency (ungrouped data)
Measures of central tendency (ungrouped data)Measures of central tendency (ungrouped data)
Measures of central tendency (ungrouped data)
 
Tabular and Graphical Representation of Data
Tabular and Graphical Representation of Data Tabular and Graphical Representation of Data
Tabular and Graphical Representation of Data
 
Assessment of Learning 1: Chapter 5 - Utilization of Assessment Data
Assessment of Learning 1: Chapter 5 - Utilization of Assessment DataAssessment of Learning 1: Chapter 5 - Utilization of Assessment Data
Assessment of Learning 1: Chapter 5 - Utilization of Assessment Data
 
Statistik Chapter 2
Statistik Chapter 2Statistik Chapter 2
Statistik Chapter 2
 

Similar to Central Tendency Measures

Standard deviation :grouped data/Continuous data
Standard deviation  :grouped data/Continuous dataStandard deviation  :grouped data/Continuous data
Standard deviation :grouped data/Continuous dataJanak Singh saud
 
Research Methodology
Research MethodologyResearch Methodology
Research MethodologyEvanNathan3
 
Measures of Central Tendency.pptx
Measures of Central Tendency.pptxMeasures of Central Tendency.pptx
Measures of Central Tendency.pptxMelba Shaya Sweety
 
Measures of Central Tendency
Measures of Central TendencyMeasures of Central Tendency
Measures of Central TendencySuresh Babu
 
B.Ed.104 unit 4.1-statistics
B.Ed.104 unit 4.1-statisticsB.Ed.104 unit 4.1-statistics
B.Ed.104 unit 4.1-statisticsGANGOTRIROKADE1
 
STANDARD DEVIATION (2018) (STATISTICS)
STANDARD DEVIATION (2018) (STATISTICS)STANDARD DEVIATION (2018) (STATISTICS)
STANDARD DEVIATION (2018) (STATISTICS)sumanmathews
 
Measures of central tendency
Measures of central tendencyMeasures of central tendency
Measures of central tendencyRaj Teotia
 
Bcs 040 Descriptive Statistics
Bcs 040 Descriptive StatisticsBcs 040 Descriptive Statistics
Bcs 040 Descriptive StatisticsNarayan Thapa
 
Percentile and percentile rank
Percentile and percentile rankPercentile and percentile rank
Percentile and percentile rankGautam Kumar
 
Mean deviation :individual and discrete data
Mean deviation  :individual and discrete dataMean deviation  :individual and discrete data
Mean deviation :individual and discrete dataJanak Singh saud
 
Lesson 27 using statistical techniques in analyzing data
Lesson 27 using statistical techniques in analyzing dataLesson 27 using statistical techniques in analyzing data
Lesson 27 using statistical techniques in analyzing datamjlobetos
 
Measures of variability
Measures of variabilityMeasures of variability
Measures of variabilityGautam Kumar
 
Histograms and polygons
Histograms and polygonsHistograms and polygons
Histograms and polygonsshivang1999
 
Calculation of Arithmetic Mean
Calculation of Arithmetic Mean Calculation of Arithmetic Mean
Calculation of Arithmetic Mean Dr. Sunita Ojha
 

Similar to Central Tendency Measures (20)

Standard deviation :grouped data/Continuous data
Standard deviation  :grouped data/Continuous dataStandard deviation  :grouped data/Continuous data
Standard deviation :grouped data/Continuous data
 
Research Methodology
Research MethodologyResearch Methodology
Research Methodology
 
S1 pn
S1 pnS1 pn
S1 pn
 
Measures of Central Tendency.pptx
Measures of Central Tendency.pptxMeasures of Central Tendency.pptx
Measures of Central Tendency.pptx
 
Measures of Central Tendency
Measures of Central TendencyMeasures of Central Tendency
Measures of Central Tendency
 
B.Ed.104 unit 4.1-statistics
B.Ed.104 unit 4.1-statisticsB.Ed.104 unit 4.1-statistics
B.Ed.104 unit 4.1-statistics
 
STANDARD DEVIATION (2018) (STATISTICS)
STANDARD DEVIATION (2018) (STATISTICS)STANDARD DEVIATION (2018) (STATISTICS)
STANDARD DEVIATION (2018) (STATISTICS)
 
Central Tendency & Dispersion
Central Tendency & DispersionCentral Tendency & Dispersion
Central Tendency & Dispersion
 
Measures of central tendency
Measures of central tendencyMeasures of central tendency
Measures of central tendency
 
5233777
52337775233777
5233777
 
Bcs 040 Descriptive Statistics
Bcs 040 Descriptive StatisticsBcs 040 Descriptive Statistics
Bcs 040 Descriptive Statistics
 
Percentile and percentile rank
Percentile and percentile rankPercentile and percentile rank
Percentile and percentile rank
 
Qt notes
Qt notesQt notes
Qt notes
 
Mean deviation :individual and discrete data
Mean deviation  :individual and discrete dataMean deviation  :individual and discrete data
Mean deviation :individual and discrete data
 
Lesson 27 using statistical techniques in analyzing data
Lesson 27 using statistical techniques in analyzing dataLesson 27 using statistical techniques in analyzing data
Lesson 27 using statistical techniques in analyzing data
 
Arithmetic mean
Arithmetic meanArithmetic mean
Arithmetic mean
 
Measures of variability
Measures of variabilityMeasures of variability
Measures of variability
 
Histograms and polygons
Histograms and polygonsHistograms and polygons
Histograms and polygons
 
Calculation of Arithmetic Mean
Calculation of Arithmetic Mean Calculation of Arithmetic Mean
Calculation of Arithmetic Mean
 
Arithematic mean
Arithematic meanArithematic mean
Arithematic mean
 

More from Dr. Tushar J Bhatt

SAMPLING THEORY AND TECHNIQUES.pdf
SAMPLING THEORY AND TECHNIQUES.pdfSAMPLING THEORY AND TECHNIQUES.pdf
SAMPLING THEORY AND TECHNIQUES.pdfDr. Tushar J Bhatt
 
Statistical Quality Control Lecture Notes.pdf
Statistical Quality Control Lecture Notes.pdfStatistical Quality Control Lecture Notes.pdf
Statistical Quality Control Lecture Notes.pdfDr. Tushar J Bhatt
 
Statistical Estimation and Testing Lecture Notes.pdf
Statistical Estimation and Testing Lecture Notes.pdfStatistical Estimation and Testing Lecture Notes.pdf
Statistical Estimation and Testing Lecture Notes.pdfDr. Tushar J Bhatt
 
Decision Theory Lecture Notes.pdf
Decision Theory Lecture Notes.pdfDecision Theory Lecture Notes.pdf
Decision Theory Lecture Notes.pdfDr. Tushar J Bhatt
 
OPERATION RESEARCH FOR BEGINNERS.pdf
OPERATION RESEARCH FOR BEGINNERS.pdfOPERATION RESEARCH FOR BEGINNERS.pdf
OPERATION RESEARCH FOR BEGINNERS.pdfDr. Tushar J Bhatt
 
Numerical Integration and Numerical Solution of Ordinary Differential Equatio...
Numerical Integration and Numerical Solution of Ordinary Differential Equatio...Numerical Integration and Numerical Solution of Ordinary Differential Equatio...
Numerical Integration and Numerical Solution of Ordinary Differential Equatio...Dr. Tushar J Bhatt
 
Random Variable and Probability Distribution
Random Variable and Probability Distribution Random Variable and Probability Distribution
Random Variable and Probability Distribution Dr. Tushar J Bhatt
 
Measure of Dispersion (statistics)
Measure of Dispersion (statistics)Measure of Dispersion (statistics)
Measure of Dispersion (statistics)Dr. Tushar J Bhatt
 
Arithmetic and Geometric Progressions
Arithmetic and Geometric Progressions Arithmetic and Geometric Progressions
Arithmetic and Geometric Progressions Dr. Tushar J Bhatt
 
Interpolation in Numerical Methods
Interpolation in Numerical Methods Interpolation in Numerical Methods
Interpolation in Numerical Methods Dr. Tushar J Bhatt
 
Numerical Methods(Roots of Equations)
Numerical Methods(Roots of Equations)Numerical Methods(Roots of Equations)
Numerical Methods(Roots of Equations)Dr. Tushar J Bhatt
 

More from Dr. Tushar J Bhatt (18)

Network_Analysis.pdf
Network_Analysis.pdfNetwork_Analysis.pdf
Network_Analysis.pdf
 
Linear_Programming.pdf
Linear_Programming.pdfLinear_Programming.pdf
Linear_Programming.pdf
 
Theory_of_Probability .pdf
Theory_of_Probability .pdfTheory_of_Probability .pdf
Theory_of_Probability .pdf
 
Number_System .pdf
Number_System .pdfNumber_System .pdf
Number_System .pdf
 
Error_Analysis.pdf
Error_Analysis.pdfError_Analysis.pdf
Error_Analysis.pdf
 
SAMPLING THEORY AND TECHNIQUES.pdf
SAMPLING THEORY AND TECHNIQUES.pdfSAMPLING THEORY AND TECHNIQUES.pdf
SAMPLING THEORY AND TECHNIQUES.pdf
 
Statistical Quality Control Lecture Notes.pdf
Statistical Quality Control Lecture Notes.pdfStatistical Quality Control Lecture Notes.pdf
Statistical Quality Control Lecture Notes.pdf
 
Statistical Estimation and Testing Lecture Notes.pdf
Statistical Estimation and Testing Lecture Notes.pdfStatistical Estimation and Testing Lecture Notes.pdf
Statistical Estimation and Testing Lecture Notes.pdf
 
Decision Theory Lecture Notes.pdf
Decision Theory Lecture Notes.pdfDecision Theory Lecture Notes.pdf
Decision Theory Lecture Notes.pdf
 
OPERATION RESEARCH FOR BEGINNERS.pdf
OPERATION RESEARCH FOR BEGINNERS.pdfOPERATION RESEARCH FOR BEGINNERS.pdf
OPERATION RESEARCH FOR BEGINNERS.pdf
 
MATRIX ALGEBRA
MATRIX ALGEBRA MATRIX ALGEBRA
MATRIX ALGEBRA
 
Numerical Integration and Numerical Solution of Ordinary Differential Equatio...
Numerical Integration and Numerical Solution of Ordinary Differential Equatio...Numerical Integration and Numerical Solution of Ordinary Differential Equatio...
Numerical Integration and Numerical Solution of Ordinary Differential Equatio...
 
Random Variable and Probability Distribution
Random Variable and Probability Distribution Random Variable and Probability Distribution
Random Variable and Probability Distribution
 
Correlation and Regression
Correlation and Regression Correlation and Regression
Correlation and Regression
 
Measure of Dispersion (statistics)
Measure of Dispersion (statistics)Measure of Dispersion (statistics)
Measure of Dispersion (statistics)
 
Arithmetic and Geometric Progressions
Arithmetic and Geometric Progressions Arithmetic and Geometric Progressions
Arithmetic and Geometric Progressions
 
Interpolation in Numerical Methods
Interpolation in Numerical Methods Interpolation in Numerical Methods
Interpolation in Numerical Methods
 
Numerical Methods(Roots of Equations)
Numerical Methods(Roots of Equations)Numerical Methods(Roots of Equations)
Numerical Methods(Roots of Equations)
 

Recently uploaded

Incoming and Outgoing Shipments in 1 STEP Using Odoo 17
Incoming and Outgoing Shipments in 1 STEP Using Odoo 17Incoming and Outgoing Shipments in 1 STEP Using Odoo 17
Incoming and Outgoing Shipments in 1 STEP Using Odoo 17Celine George
 
“Oh GOSH! Reflecting on Hackteria's Collaborative Practices in a Global Do-It...
“Oh GOSH! Reflecting on Hackteria's Collaborative Practices in a Global Do-It...“Oh GOSH! Reflecting on Hackteria's Collaborative Practices in a Global Do-It...
“Oh GOSH! Reflecting on Hackteria's Collaborative Practices in a Global Do-It...Marc Dusseiller Dusjagr
 
Computed Fields and api Depends in the Odoo 17
Computed Fields and api Depends in the Odoo 17Computed Fields and api Depends in the Odoo 17
Computed Fields and api Depends in the Odoo 17Celine George
 
Hierarchy of management that covers different levels of management
Hierarchy of management that covers different levels of managementHierarchy of management that covers different levels of management
Hierarchy of management that covers different levels of managementmkooblal
 
MARGINALIZATION (Different learners in Marginalized Group
MARGINALIZATION (Different learners in Marginalized GroupMARGINALIZATION (Different learners in Marginalized Group
MARGINALIZATION (Different learners in Marginalized GroupJonathanParaisoCruz
 
call girls in Kamla Market (DELHI) 🔝 >༒9953330565🔝 genuine Escort Service 🔝✔️✔️
call girls in Kamla Market (DELHI) 🔝 >༒9953330565🔝 genuine Escort Service 🔝✔️✔️call girls in Kamla Market (DELHI) 🔝 >༒9953330565🔝 genuine Escort Service 🔝✔️✔️
call girls in Kamla Market (DELHI) 🔝 >༒9953330565🔝 genuine Escort Service 🔝✔️✔️9953056974 Low Rate Call Girls In Saket, Delhi NCR
 
Historical philosophical, theoretical, and legal foundations of special and i...
Historical philosophical, theoretical, and legal foundations of special and i...Historical philosophical, theoretical, and legal foundations of special and i...
Historical philosophical, theoretical, and legal foundations of special and i...jaredbarbolino94
 
Presiding Officer Training module 2024 lok sabha elections
Presiding Officer Training module 2024 lok sabha electionsPresiding Officer Training module 2024 lok sabha elections
Presiding Officer Training module 2024 lok sabha electionsanshu789521
 
POINT- BIOCHEMISTRY SEM 2 ENZYMES UNIT 5.pptx
POINT- BIOCHEMISTRY SEM 2 ENZYMES UNIT 5.pptxPOINT- BIOCHEMISTRY SEM 2 ENZYMES UNIT 5.pptx
POINT- BIOCHEMISTRY SEM 2 ENZYMES UNIT 5.pptxSayali Powar
 
Painted Grey Ware.pptx, PGW Culture of India
Painted Grey Ware.pptx, PGW Culture of IndiaPainted Grey Ware.pptx, PGW Culture of India
Painted Grey Ware.pptx, PGW Culture of IndiaVirag Sontakke
 
Crayon Activity Handout For the Crayon A
Crayon Activity Handout For the Crayon ACrayon Activity Handout For the Crayon A
Crayon Activity Handout For the Crayon AUnboundStockton
 
Employee wellbeing at the workplace.pptx
Employee wellbeing at the workplace.pptxEmployee wellbeing at the workplace.pptx
Employee wellbeing at the workplace.pptxNirmalaLoungPoorunde1
 
EPANDING THE CONTENT OF AN OUTLINE using notes.pptx
EPANDING THE CONTENT OF AN OUTLINE using notes.pptxEPANDING THE CONTENT OF AN OUTLINE using notes.pptx
EPANDING THE CONTENT OF AN OUTLINE using notes.pptxRaymartEstabillo3
 
How to Make a Pirate ship Primary Education.pptx
How to Make a Pirate ship Primary Education.pptxHow to Make a Pirate ship Primary Education.pptx
How to Make a Pirate ship Primary Education.pptxmanuelaromero2013
 
Biting mechanism of poisonous snakes.pdf
Biting mechanism of poisonous snakes.pdfBiting mechanism of poisonous snakes.pdf
Biting mechanism of poisonous snakes.pdfadityarao40181
 
Introduction to AI in Higher Education_draft.pptx
Introduction to AI in Higher Education_draft.pptxIntroduction to AI in Higher Education_draft.pptx
Introduction to AI in Higher Education_draft.pptxpboyjonauth
 

Recently uploaded (20)

Incoming and Outgoing Shipments in 1 STEP Using Odoo 17
Incoming and Outgoing Shipments in 1 STEP Using Odoo 17Incoming and Outgoing Shipments in 1 STEP Using Odoo 17
Incoming and Outgoing Shipments in 1 STEP Using Odoo 17
 
“Oh GOSH! Reflecting on Hackteria's Collaborative Practices in a Global Do-It...
“Oh GOSH! Reflecting on Hackteria's Collaborative Practices in a Global Do-It...“Oh GOSH! Reflecting on Hackteria's Collaborative Practices in a Global Do-It...
“Oh GOSH! Reflecting on Hackteria's Collaborative Practices in a Global Do-It...
 
Computed Fields and api Depends in the Odoo 17
Computed Fields and api Depends in the Odoo 17Computed Fields and api Depends in the Odoo 17
Computed Fields and api Depends in the Odoo 17
 
Model Call Girl in Bikash Puri Delhi reach out to us at 🔝9953056974🔝
Model Call Girl in Bikash Puri  Delhi reach out to us at 🔝9953056974🔝Model Call Girl in Bikash Puri  Delhi reach out to us at 🔝9953056974🔝
Model Call Girl in Bikash Puri Delhi reach out to us at 🔝9953056974🔝
 
Hierarchy of management that covers different levels of management
Hierarchy of management that covers different levels of managementHierarchy of management that covers different levels of management
Hierarchy of management that covers different levels of management
 
MARGINALIZATION (Different learners in Marginalized Group
MARGINALIZATION (Different learners in Marginalized GroupMARGINALIZATION (Different learners in Marginalized Group
MARGINALIZATION (Different learners in Marginalized Group
 
call girls in Kamla Market (DELHI) 🔝 >༒9953330565🔝 genuine Escort Service 🔝✔️✔️
call girls in Kamla Market (DELHI) 🔝 >༒9953330565🔝 genuine Escort Service 🔝✔️✔️call girls in Kamla Market (DELHI) 🔝 >༒9953330565🔝 genuine Escort Service 🔝✔️✔️
call girls in Kamla Market (DELHI) 🔝 >༒9953330565🔝 genuine Escort Service 🔝✔️✔️
 
9953330565 Low Rate Call Girls In Rohini Delhi NCR
9953330565 Low Rate Call Girls In Rohini  Delhi NCR9953330565 Low Rate Call Girls In Rohini  Delhi NCR
9953330565 Low Rate Call Girls In Rohini Delhi NCR
 
Historical philosophical, theoretical, and legal foundations of special and i...
Historical philosophical, theoretical, and legal foundations of special and i...Historical philosophical, theoretical, and legal foundations of special and i...
Historical philosophical, theoretical, and legal foundations of special and i...
 
Presiding Officer Training module 2024 lok sabha elections
Presiding Officer Training module 2024 lok sabha electionsPresiding Officer Training module 2024 lok sabha elections
Presiding Officer Training module 2024 lok sabha elections
 
POINT- BIOCHEMISTRY SEM 2 ENZYMES UNIT 5.pptx
POINT- BIOCHEMISTRY SEM 2 ENZYMES UNIT 5.pptxPOINT- BIOCHEMISTRY SEM 2 ENZYMES UNIT 5.pptx
POINT- BIOCHEMISTRY SEM 2 ENZYMES UNIT 5.pptx
 
Painted Grey Ware.pptx, PGW Culture of India
Painted Grey Ware.pptx, PGW Culture of IndiaPainted Grey Ware.pptx, PGW Culture of India
Painted Grey Ware.pptx, PGW Culture of India
 
Crayon Activity Handout For the Crayon A
Crayon Activity Handout For the Crayon ACrayon Activity Handout For the Crayon A
Crayon Activity Handout For the Crayon A
 
Employee wellbeing at the workplace.pptx
Employee wellbeing at the workplace.pptxEmployee wellbeing at the workplace.pptx
Employee wellbeing at the workplace.pptx
 
ESSENTIAL of (CS/IT/IS) class 06 (database)
ESSENTIAL of (CS/IT/IS) class 06 (database)ESSENTIAL of (CS/IT/IS) class 06 (database)
ESSENTIAL of (CS/IT/IS) class 06 (database)
 
EPANDING THE CONTENT OF AN OUTLINE using notes.pptx
EPANDING THE CONTENT OF AN OUTLINE using notes.pptxEPANDING THE CONTENT OF AN OUTLINE using notes.pptx
EPANDING THE CONTENT OF AN OUTLINE using notes.pptx
 
How to Make a Pirate ship Primary Education.pptx
How to Make a Pirate ship Primary Education.pptxHow to Make a Pirate ship Primary Education.pptx
How to Make a Pirate ship Primary Education.pptx
 
Biting mechanism of poisonous snakes.pdf
Biting mechanism of poisonous snakes.pdfBiting mechanism of poisonous snakes.pdf
Biting mechanism of poisonous snakes.pdf
 
Introduction to AI in Higher Education_draft.pptx
Introduction to AI in Higher Education_draft.pptxIntroduction to AI in Higher Education_draft.pptx
Introduction to AI in Higher Education_draft.pptx
 
Model Call Girl in Tilak Nagar Delhi reach out to us at 🔝9953056974🔝
Model Call Girl in Tilak Nagar Delhi reach out to us at 🔝9953056974🔝Model Call Girl in Tilak Nagar Delhi reach out to us at 🔝9953056974🔝
Model Call Girl in Tilak Nagar Delhi reach out to us at 🔝9953056974🔝
 

Central Tendency Measures

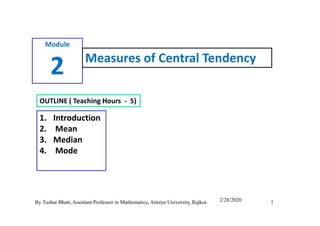
  • 1. Module 2 Measures of Central Tendency OUTLINE ( Teaching Hours - 5) 1. Introduction 1 1. Introduction 2. Mean 3. Median 4. Mode By Tushar Bhatt, Assistant Professor in Mathematics, Atmiya University, Rajkot. 2/28/2020
  • 2. Types of Data Here we are study mainly 3-types of data (observations) : 2By Tushar Bhatt, Assistant Professor in Mathematics, Atmiya University, Rajkot. 2/28/2020
  • 3. Measure of Central Tendency A single expression, representing the whole group , is selected which may convey a fairly enough idea about the whole group . This single expression in statistics is known as the average . The average are generally the central part of the distribution and therefore they are also called the measure of central tendency. 3 Now there are five types of measure of central tendency which are commonly used . These are , 1. ARITHMATIC MEAN 2. GEOMETRIC MEAN 3. HARMONIC MEAN 4. MEDIAN 5. MODE By Tushar Bhatt, Assistant Professor in Mathematics, Atmiya University, Rajkot. 2/28/2020
  • 4. Measure of Central Tendency 4By Tushar Bhatt, Assistant Professor in Mathematics, Atmiya University, Rajkot. 2/28/2020
  • 5. Arithmetic Mean There are three ways to obtain A.M for the given data : 1. A.M for Individual Observations : Let 5By Tushar Bhatt, Assistant Professor in Mathematics, Atmiya University, Rajkot. 2/28/2020 2. A.M for Discrete Observations : Let ; , - f di iX A A Assumed Mean d X Ai ifi ∑ = + = = ∑
  • 6. Arithmetic Mean There are three ways to obtain A.M for the given data : 3. A.M for Continuous Observations : In this type of observations we have class and their corresponding frequency are given then the A.M of the given data is defined as : 6By Tushar Bhatt, Assistant Professor in Mathematics, Atmiya University, Rajkot. 2/28/2020 the given data is defined as :
  • 7. Arithmetic Mean Ex-1 : Find the A.M of the marks obtained by 10 students of class X in mathematics in a certain examination. The marks obtained are : 25,30,21,55,47,10,15,17,45,35. Solu : Here the given observations are individual then A.M = 7By Tushar Bhatt, Assistant Professor in Mathematics, Atmiya University, Rajkot. 2/28/2020 A.M = Therefore A.M is
  • 8. Arithmetic Mean Ex-2 : Find the A.M from the following frequency table: Solu : Here the given observations are discrete then Marks 52 58 60 65 68 70 75 No. Of students 7 5 4 6 3 3 2 8By Tushar Bhatt, Assistant Professor in Mathematics, Atmiya University, Rajkot. 2/28/2020 Solu : Here the given observations are discrete then A.M = ; , - f di iX A A Assumed Mean d X Ai ifi ∑ = + = = ∑
  • 9. Arithmetic Mean Marks(x) f d = x-A fd 52 7 -13 -91 58 5 -7 -35 60 4 -5 -20 65=A 6 0 0 9By Tushar Bhatt, Assistant Professor in Mathematics, Atmiya University, Rajkot. 2/28/2020 65=A 6 0 0 68 3 3 9 70 3 5 15 75 2 10 20 Total 30 -7 -102
  • 10. Arithmetic Mean 102 65 3.4 61.6 30 65 f d i iX A f i = − = ∑ = + = − ∑ 10By Tushar Bhatt, Assistant Professor in Mathematics, Atmiya University, Rajkot. 2/28/2020
  • 11. Arithmetic Mean Ex-3 : Find the A.M from the following data : Class 0-30 30-60 60-90 90-120 120-150 150-180 Frequency 8 13 22 27 18 7 Solu : Here given data is continuous therefore, 11By Tushar Bhatt, Assistant Professor in Mathematics, Atmiya University, Rajkot. 2/28/2020 Solu : Here given data is continuous therefore, Where,
  • 12. Arithmetic Mean Class f Mid Value(X) d = X- A/ i fd 0-30 8 15 -2 -16 30-60 13 45 -1 -13 60-90 22 75 = A 0 0 12By Tushar Bhatt, Assistant Professor in Mathematics, Atmiya University, Rajkot. 2/28/2020 60-90 22 75 = A 0 0 90-120 27 105 1 27 120-150 18 135 2 36 150-180 7 165 3 21 Total 95 55
  • 13. Arithmetic Mean 55 75 30 95 75 17.36 = + × = + 13By Tushar Bhatt, Assistant Professor in Mathematics, Atmiya University, Rajkot. 2/28/2020 75 17.36 92.36 = + =
  • 14. Arithmetic Mean Ex-4 : Find the A.M from the following data : Class < 10 < 20 < 30 < 40 < 50 Frequency 2 18 30 17 3 Solu : Here given data is continuous therefore, 14By Tushar Bhatt, Assistant Professor in Mathematics, Atmiya University, Rajkot. 2/28/2020 Where,
  • 15. Arithmetic Mean Class f Mid Value(X) d = X- A/ i fd 0-10 2 5 -2 -4 10-20 18 15 -1 -18 20-30 30 25=A 0 0 15By Tushar Bhatt, Assistant Professor in Mathematics, Atmiya University, Rajkot. 2/28/2020 30-40 17 35 1 17 40-50 3 45 2 6 Total 70 1 1 25 10 25 0.14 25.14 70 X   = + × = + =   
  • 16. Geometric Mean 16By Tushar Bhatt, Assistant Professor in Mathematics, Atmiya University, Rajkot. 2/28/2020 Ex – 1 : Find the Geometric mean of the numbers 50,100,200. Solu : 3 . 50 100 200 100G M = × × =
  • 17. Harmonic Mean 17By Tushar Bhatt, Assistant Professor in Mathematics, Atmiya University, Rajkot. 2/28/2020 Ex – 1 : Find the Harmonic mean of 3 –observations 2,4 and 8. Solu : 3 3 . 3.429 1 1 1 0.5 0.25 0.125 2 4 8 H M = = = + ++ +
  • 18. Median 18By Tushar Bhatt, Assistant Professor in Mathematics, Atmiya University, Rajkot. 2/28/2020
  • 19. Median 19By Tushar Bhatt, Assistant Professor in Mathematics, Atmiya University, Rajkot. 2/28/2020
  • 20. Median 20By Tushar Bhatt, Assistant Professor in Mathematics, Atmiya University, Rajkot. 2/28/2020 • M is near to the those cumulative frequency then their corresponding value of observation is required median.
  • 21. Median 21By Tushar Bhatt, Assistant Professor in Mathematics, Atmiya University, Rajkot. 2/28/2020
  • 22. Median Ex- 1 : Find the median of the data 10, 18, 23, 40, 58, 65, 92,38 Solu : Arranging the data in ascending order, we get 10, 18, 23, 38, 40, 58, 65, 92 22By Tushar Bhatt, Assistant Professor in Mathematics, Atmiya University, Rajkot. 2/28/2020 . 1 2 2 2 4 5 2 38 40 39 2 th th th th Here no of observations are even n n Value of observation Value of observation Median value of observation value of observation     + +       ∴ = + = + = =
  • 23. Median Ex- 2 : Find the median of the data 6,20,43,50,19,53,0,37,78,1,15 Solu : Arranging the data in ascending order, we get 0,1,6,15,19,20,37,43,50,53,78 23By Tushar Bhatt, Assistant Professor in Mathematics, Atmiya University, Rajkot. 2/28/2020 . 11 1 2 6 20 th th Here no of observations are odd Median Value of observation Value of observation +  ∴ =     = =
  • 24. Median Ex- 3 : Find the median of the following data Solu : Here given data is discrete therefore we are using the formula : X 20 9 25 50 40 80 f 6 4 16 7 8 2 24By Tushar Bhatt, Assistant Professor in Mathematics, Atmiya University, Rajkot. 2/28/2020 the formula :
  • 25. Median First arrange the data into ascending order : X f Cumulative frequency 9 4 4 20 6 10 25By Tushar Bhatt, Assistant Professor in Mathematics, Atmiya University, Rajkot. 2/28/2020 25 16 26 40 8 34 50 7 41 80 2 43
  • 26. Median 1 ; 43 2 22 ; 26 25, . 26 th n M observation n total of frequencies whichis near tothecumulative frequency whichis a corressponding observation of c f +  = = =    = = 26By Tushar Bhatt, Assistant Professor in Mathematics, Atmiya University, Rajkot. 2/28/2020
  • 27. Median Ex- 4: Find the median from the following data : Class 0-30 30-60 60-90 90-120 120-150 150-180 Frequency 8 13 22 27 18 7 Solu : Here given observations are continuous therefore 27By Tushar Bhatt, Assistant Professor in Mathematics, Atmiya University, Rajkot. 2/28/2020 Solu : Here given observations are continuous therefore we will use the formula : 2 n c M L i f   −  = + ×     
  • 28. Median Class f c.f 0-30 8 8 30-60 13 21 60-90 22 43 90-120 27 70 120-150 18 88 95 , 47.5 islies in the class 90 120 2 2 The median class 90 120 90 43 27 n now L c f = = − ∴ = − = = = 28By Tushar Bhatt, Assistant Professor in Mathematics, Atmiya University, Rajkot. 2/28/2020 150-180 7 95 Total 95 27 30 f i = = 47.5 43 4.5 30 90 30 90 90 5 95 27 27 M − ×    ∴ = + × = + = + =     
  • 29. 29By Tushar Bhatt, Assistant Professor in Mathematics, Atmiya University, Rajkot. 2/28/2020
  • 30. Mode 30By Tushar Bhatt, Assistant Professor in Mathematics, Atmiya University, Rajkot. 2/28/2020
  • 31. Mode 31By Tushar Bhatt, Assistant Professor in Mathematics, Atmiya University, Rajkot. 2/28/2020
  • 32. Mode 32By Tushar Bhatt, Assistant Professor in Mathematics, Atmiya University, Rajkot. 2/28/2020
  • 33. Mode Solu -1 : (i) Here the number 45 is repeated therefore Mode = 45. (ii) Here no number is repeat therefore the given series has no mode. (iii) Here two numbers 10 and 18 are repeated 33By Tushar Bhatt, Assistant Professor in Mathematics, Atmiya University, Rajkot. 2/28/2020 (iii) Here two numbers 10 and 18 are repeated therefore the given series has two mode 10 and 18.
  • 34. Mode 2:Solu -2: Class Frequency 0-10 10 10-20 14 34By Tushar Bhatt, Assistant Professor in Mathematics, Atmiya University, Rajkot. 2/28/2020 20-30 19 Max. Frequency 30-40 17 40-50 13
  • 35. Mode Solu -2: 1 Modelclass is 20 30 becauseit has max.frequency L= 20 f 14 = − = 35By Tushar Bhatt, Assistant Professor in Mathematics, Atmiya University, Rajkot. 2/28/2020 2 17 19 10 19 14 50 20 10 20 20 7.14 27.14 2(19) 14 17 7 m f f i Mode = = =  − = + × = + = + =  − − 
  • 36. Mode Solu -:3 Here 25 20 Mode 3 2 3(20) 2(25) 10 X and M Z M X = = ∴ = − = − = 36By Tushar Bhatt, Assistant Professor in Mathematics, Atmiya University, Rajkot. 2/28/2020
  • 37. Merits, Demerits and uses of Mean Merits : It can be easily calculated Its calculations are based on all the observations It is easy to understand it is the average obtained by calculations and it does 37By Tushar Bhatt, Assistant Professor in Mathematics, Atmiya University, Rajkot. 2/28/2020 it is the average obtained by calculations and it does not depend upon any position. It is rigidly defined by the mathematical formula Demerits : It may not be represented in actual data and so it is theoretical. The extreme values have greater effect on mean.
  • 38. Merits, Demerits and uses of Mean Demerits : It can not be calculated if all the values are not known. It can not be determined for the qualitative data like beauty, honesty etc.,. 38By Tushar Bhatt, Assistant Professor in Mathematics, Atmiya University, Rajkot. 2/28/2020 beauty, honesty etc.,. Uses of Mean : It is extensively used in practical statistics Estimates are always obtained by mean
  • 39. Merits, Demerits and uses of Median Merits : It is easily understood. It is not affected by extreme values It can be located graphically It is the best measure for qualitative data like beauty, 39By Tushar Bhatt, Assistant Professor in Mathematics, Atmiya University, Rajkot. 2/28/2020 It is the best measure for qualitative data like beauty, honesty etc.,. Demerits : It is not subject to algebraic treatments It can not represent the irregular distribution series It is a positional average and is based on the middle item.
  • 40. Merits, Demerits and uses of Median Uses of Median : It is useful in those cases where numerical measurements are not possible. It is generally used in studying phenomena like skill, honesty, intelligence, etc. 40By Tushar Bhatt, Assistant Professor in Mathematics, Atmiya University, Rajkot. 2/28/2020 honesty, intelligence, etc.
  • 41. Thank You 41By Tushar Bhatt, Assistant Professor in Mathematics, Atmiya University, Rajkot. 2/28/2020 You