October 2015 Greater Boston Real Estate Market Trends Report

Here’s October 2015’s Monthly Indicators report from the Greater Boston Association of Realtors® October closed home sales up on strong buyer activity over the late summer/early fall. Low supply in October and ongoing buyer demand pushed home prices higher. Seven straight months of new listings added to the market are giving buyers more options. • September single-family home sales – UP +13.0% over last year September Single-family median prices were UP +1.1% at $440,000 • September condo sales DOWN -7.3% and median prices were UP +15.5% at $454,950 • Inventory in September DOWN -12.1% to 3,688 and Condominiums DOWN -10.0% to 1,773 • SF listings added to the market in September UP +2.6% over last year. (1,586 from 1,546 in 2014) • Condo listings added to the market UP +5.3% over last year. (1,137 from 1,080 in 2014)

Recommended
Recommended
More Related Content
What's hot
What's hot (19)
Similar to October 2015 Greater Boston Real Estate Market Trends Report
Similar to October 2015 Greater Boston Real Estate Market Trends Report (20)
More from Unit Realty Group
More from Unit Realty Group (19)
Recently uploaded
Recently uploaded (20)
October 2015 Greater Boston Real Estate Market Trends Report
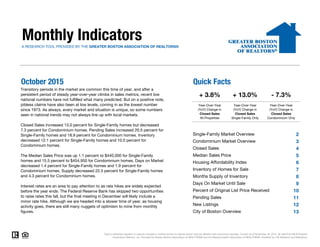
- 1. Monthly IndicatorsA RESEARCH TOOL PROVIDED BY THE GREATER BOSTON ASSOCIATION OF REALTORS® October 2015 Quick Facts 2 3 4 5 6 7 8 9 10 11 12 13 Housing Affordability Index Inventory of Homes for Sale Months Supply of Inventory Days On Market Until Sale Percent of Original List Price Received City of Boston Overview Pending Sales New Listings Data is refreshed regularly to capture changes in market activity so figures shown may be different than previously reported. Current as of November 16, 2015. All data from MLS Property Information Network, Inc. Provided by Greater Boston Association of REALTORS® and the Massachusetts Association of REALTORS®. Powered by 10K Research and Marketing. + 13.0% Year-Over-Year (YoY) Change in Closed Sales Single-Family Only - 7.3% Year-Over-Year (YoY) Change in Closed Sales Condominium Only + 3.8% Year-Over-Year (YoY) Change in Closed Sales All Properties Single-Family Market Overview Condominium Market Overview Closed Sales Median Sales Price Transitory periods in the market are common this time of year, and after a persistent period of steady year-over-year climbs in sales metrics, recent low national numbers have not fulfilled what many predicted. But on a positive note, jobless claims have also been at low levels, coming in as the lowest number since 1973. As always, every market and situation is unique, so some numbers seen in national trends may not always line up with local markets. Closed Sales increased 13.0 percent for Single-Family homes but decreased 7.3 percent for Condominium homes. Pending Sales increased 20.5 percent for Single-Family homes and 18.9 percent for Condominium homes. Inventory decreased 12.1 percent for Single-Family homes and 10.0 percent for Condominium homes. The Median Sales Price was up 1.1 percent to $440,000 for Single-Family homes and 15.5 percent to $454,950 for Condominium homes. Days on Market decreased 1.4 percent for Single-Family homes and 1.9 percent for Condominium homes. Supply decreased 22.5 percent for Single-Family homes and 4.3 percent for Condominium homes. Interest rates are an area to pay attention to as rate hikes are widely expected before the year ends. The Federal Reserve Bank has skipped two opportunities to raise rates this fall, but the final meeting in December will likely include a minor rate hike. Although we are headed into a slower time of year, as housing activity goes, there are still many nuggets of optimism to mine from monthly figures.
- 2. Single-Family Market Overview Key market metrics for the current month and year-to-date figures for Single-Family Homes Only. Key Metrics Historical Sparklines Oct-2014 Oct-2015 + / – YTD 2014 YTD 2015 + / – 11,825 + 6.7% All data from MLS Property Information Network, Inc. Provided by the Greater Boston Association of REALTORS® and the Massachusetts Association of REALTORS®. Powered by 10K Research and Marketing. | 2 New Listings 1,546 1,586 + 2.6% 16,724 17,381 + 3.9% Closed Sales 1,048 1,184 + 13.0% 11,084 $480,000 + 4.1% 71 102 103 70 -- -- -- 4,195 3,688 3.1 - 22.5% $440,000 + 1.1% $460,900 68 Housing Affordability Index Inventory of Homes for Sale Months Supply of Inventory 4.0 $435,000 Pending Sales Median Sales Price + 10.8%12,9651,170 1,410 + 20.5% 11,706 - 12.1% -- -- + 1.0% 97 94 - 3.1% -- 97.4% 97.9% + 2.9% + 0.5% Percent of Original List Price Received Days on Market Until Sale 96.5% - 1.4% + 0.3% 70 96.8% 10-2012 10-2013 10-2014 10-2015 10-2012 10-2013 10-2014 10-2015 10-2012 10-2013 10-2014 10-2015 10-2012 10-2013 10-2014 10-2015 10-2012 10-2013 10-2014 10-2015 10-2012 10-2013 10-2014 10-2015 10-2012 10-2013 10-2014 10-2015 10-2012 10-2013 10-2014 10-2015 10-2012 10-2013 10-2014 10-2015
- 3. Condominium Market Overview Key market metrics for the current month and year-to-date figures for Condominium Properties Only. Key Metrics Historical Sparklines Oct-2014 Oct-2015 + / – YTD 2014 YTD 2015 + / – + 3.9% All data from MLS Property Information Network, Inc. Provided by the Greater Boston Association of REALTORS® and the Massachusetts Association of REALTORS®. Powered by 10K Research and Marketing. | 3 New Listings 1,080 1,137 + 5.3% 11,592 12,047 + 0.8% Pending Sales 822 977 + 18.9% 9,226 9,609 + 4.2% Percent of Original List Price Received 98.5% 99.6% + 1.1% 99.4% 100.2% -- Days on Market Until Sale 53 52 - 1.9% 55 51 - 7.3% Months Supply of Inventory 2.3 2.2 - 4.3% -- -- - 6.5% Inventory of Homes for Sale 1,970 1,773 - 10.0% -- -- -- Housing Affordability Index 113 99 - 12.4% 107 100 - 1.4% Median Sales Price $394,000 $454,950 + 15.5% $415,000 $450,000 + 8.4% Closed Sales 865 802 - 7.3% 8,906 8,777 10-2012 10-2013 10-2014 10-2015 10-2012 10-2013 10-2014 10-2015 10-2012 10-2013 10-2014 10-2015 10-2012 10-2013 10-2014 10-2015 10-2012 10-2013 10-2014 10-2015 10-2012 10-2013 10-2014 10-2015 10-2012 10-2013 10-2014 10-2015 10-2012 10-2013 10-2014 10-2015 10-2012 10-2013 10-2014 10-2015
- 4. Closed Sales A count of the actual sales that have closed in a given month. Single-Family YoY Change Condominium YoY Change Nov-2014 960 - 7.8% 651 - 14.2% Dec-2014 1,116 + 3.2% 811 - 2.9% Jan-2015 742 + 1.4% 481 - 15.3% Feb-2015 554 + 6.5% 449 - 0.2% Mar-2015 711 - 0.1% 581 - 16.0% Apr-2015 787 - 8.7% 677 - 21.9% May-2015 1,085 - 10.0% 949 - 5.0% Jun-2015 1,872 + 11.2% 1,376 + 8.4% Jul-2015 1,913 + 10.0% 1,346 + 12.5% Aug-2015 1,736 + 14.5% 1,211 + 6.4% Sep-2015 1,241 + 16.4% 905 + 5.0% Oct-2015 1,184 + 13.0% 802 - 7.3% Total 13,901 + 5.3% 10,239 - 2.5% All data from MLS Property Information Network, Inc. Provided by the Greater Boston Association of REALTORS® and the Massachusetts Association of REALTORS®. Powered by 10K Research and Marketing. | 4 1,089 808 1,048 865 1,184 802 Single-Family Condominium October 200 400 600 800 1,000 1,200 1,400 1,600 1,800 2,000 Jan-2003 Jan-2004 Jan-2005 Jan-2006 Jan-2007 Jan-2008 Jan-2009 Jan-2010 Jan-2011 Jan-2012 Jan-2013 Jan-2014 Jan-2015 Historical Closed Sales Activity Single-Family Condominium -7.3%+7.1%-3.8% 20152014 20152014 11,767 9,332 11,084 8,906 11,825 8,777 Single-Family Condominium Year to Date -1.4%-4.6%-5.8% 20152014 20152014 +13.0% +6.7% 2013 2013 2013 2013
- 5. Median Sales Price Median price point for all closed sales, not accounting for seller concessions, in a given month. Single-Family YoY Change Condominium YoY Change Nov-2014 $450,000 + 8.4% $415,000 + 5.1% Dec-2014 $443,500 + 2.0% $425,000 + 4.9% Jan-2015 $446,000 + 6.7% $443,000 + 10.9% Feb-2015 $438,500 + 7.6% $407,135 + 4.4% Mar-2015 $432,500 + 1.3% $447,670 + 6.6% Apr-2015 $470,000 + 6.8% $438,500 + 10.5% May-2015 $480,000 + 3.4% $455,750 + 9.2% Jun-2015 $526,655 + 3.3% $459,500 + 4.5% Jul-2015 $525,000 + 4.0% $460,000 + 9.8% Aug-2015 $498,700 + 1.8% $460,000 + 9.8% Sep-2015 $455,000 + 7.5% $428,500 + 3.4% Oct-2015 $440,000 + 1.1% $454,950 + 15.5% Median $475,000 + 4.4% $445,000 + 8.1% All data from MLS Property Information Network, Inc. Provided by the Greater Boston Association of REALTORS® and the Massachusetts Association of REALTORS®. Powered by 10K Research and Marketing. | 5 $420,000 $396,500 $435,000 $394,000 $440,000 $454,950 Single-Family Condominium October $250,000 $300,000 $350,000 $400,000 $450,000 $500,000 $550,000 $600,000 Jan-2003 Jan-2004 Jan-2005 Jan-2006 Jan-2007 Jan-2008 Jan-2009 Jan-2010 Jan-2011 Jan-2012 Jan-2013 Jan-2014 Jan-2015 Historical Median Sales Price Single-Family Condominium +15.5%-0.6%+3.6% 20152014 20152014 $439,000 $390,000 $460,900 $415,000 $480,000 $450,000 Single-Family Condominium Year to Date +8.4%+6.4%+5.0% 20152014 20152014 +1.1% +4.1% 2013 2013 2013 2013
- 6. Housing Affordability Index Single-Family YoY Change Condominium YoY Change Nov-2014 99 - 12.4% 108 - 9.2% Dec-2014 101 - 1.9% 106 - 4.5% Jan-2015 103 + 1.0% 103 - 2.8% Feb-2015 105 - 0.9% 113 + 2.7% Mar-2015 105 + 4.0% 101 - 1.9% Apr-2015 97 - 1.0% 104 - 3.7% May-2015 96 + 1.1% 101 - 4.7% Jun-2015 86 - 1.1% 98 - 2.0% Jul-2015 84 - 3.4% 96 - 8.6% Aug-2015 90 0.0% 97 - 8.5% Sep-2015 99 - 3.9% 105 - 0.9% Oct-2015 103 + 1.0% 99 - 12.4% Average 97 -1.5% 103 -4.7% This index measures housing affordability for the region. An index of 120 means the median household income was 120% of what is necessary to qualify for the median-priced home under prevailing interest rates. A higher number means greater affordability. All data from MLS Property Information Network, Inc. Provided by the Greater Boston Association of REALTORS® and the Massachusetts Association of REALTORS®. Powered by 10K Research and Marketing. | 6 106 112 102 113 103 99 Single-Family Condominium October 50 60 70 80 90 100 110 120 130 140 150 Jan-2004 Jan-2005 Jan-2006 Jan-2007 Jan-2008 Jan-2009 Jan-2010 Jan-2011 Jan-2012 Jan-2013 Jan-2014 Jan-2015 Historical Housing Affordability Index Single-Family Condominium -12.4%+0.9%-3.8% 101 114 97 107 94 100 Single-Family Condominium Year to Date -6.5%-6.1%-4.0% 20152014 20152014 20152014 20152014 +1.0% -3.1% 2013 2013 2013 2013
- 7. Inventory of Homes for Sale The number of properties available for sale in active status at the end of a given month. Single-Family YoY Change Condominium YoY Change Nov-2014 3,514 + 4.1% 1,649 - 10.2% Dec-2014 2,788 + 3.1% 1,298 - 13.5% Jan-2015 2,655 - 1.2% 1,311 - 13.2% Feb-2015 2,449 - 13.6% 1,250 - 20.8% Mar-2015 2,622 - 15.2% 1,397 - 17.0% Apr-2015 3,353 - 7.1% 1,769 - 5.7% May-2015 3,900 - 6.6% 1,951 - 4.4% Jun-2015 4,044 - 4.6% 1,936 - 3.6% Jul-2015 4,017 - 3.6% 1,840 - 4.7% Aug-2015 3,850 - 4.5% 1,707 - 3.3% Sep-2015 4,057 - 5.9% 1,952 - 0.4% Oct-2015 3,688 - 12.1% 1,773 - 10.0% Average 3,411 - 5.7% 1,653 - 8.4% All data from MLS Property Information Network, Inc. Provided by the Greater Boston Association of REALTORS® and the Massachusetts Association of REALTORS®. Powered by 10K Research and Marketing. | 7 3,895 2,159 4,195 1,970 3,688 1,773 Single-Family Condominium October 1,000 2,000 3,000 4,000 5,000 6,000 7,000 8,000 9,000 10,000 Jan-2003 Jan-2004 Jan-2005 Jan-2006 Jan-2007 Jan-2008 Jan-2009 Jan-2010 Jan-2011 Jan-2012 Jan-2013 Jan-2014 Jan-2015 Historical Inventory of Homes for Sale Single-Family Condominium -10.0%-8.8%+7.7% 20152014 20152014 -12.1% 2013 2013
- 8. Months Supply of Inventory The inventory of homes for sale at the end of a given month, divided by the average monthly pending sales from the last 12 months. Single-Family YoY Change Condominium YoY Change Nov-2014 3.7 + 15.6% 2.5 + 4.2% Dec-2014 2.5 0.0% 1.6 - 11.1% Jan-2015 3.6 - 2.7% 2.7 0.0% Feb-2015 4.4 - 20.0% 2.8 - 20.0% Mar-2015 3.7 - 14.0% 2.4 0.0% Apr-2015 4.3 + 2.4% 2.6 + 18.2% May-2015 3.6 + 2.9% 2.1 + 5.0% Jun-2015 2.2 - 12.0% 1.4 - 12.5% Jul-2015 2.1 - 12.5% 1.4 - 12.5% Aug-2015 2.2 - 18.5% 1.4 - 12.5% Sep-2015 3.3 - 17.5% 2.2 - 4.3% Oct-2015 3.1 - 22.5% 2.2 - 4.3% Average 3.1 - 4.1% 1.9 - 3.1% All data from MLS Property Information Network, Inc. Provided by the Greater Boston Association of REALTORS® and the Massachusetts Association of REALTORS®. Powered by 10K Research and Marketing. | 8 3.6 2.7 4.0 2.3 3.1 2.2 Single-Family Condominium October 0 2 4 6 8 10 12 14 16 Jan-2004 Jan-2005 Jan-2006 Jan-2007 Jan-2008 Jan-2009 Jan-2010 Jan-2011 Jan-2012 Jan-2013 Jan-2014 Jan-2015 Historical Months Supply of Inventory Single-Family Condominium -4.3%-14.8%+11.1% 20152014 20152014 -22.5% 2013 2013
- 9. Days on Market Until Sale Average number of days between when a property is listed and when an offer is accepted in a given month. Single-Family YoY Change Condominium YoY Change Nov-2014 75 + 7.1% 57 0.0% Dec-2014 79 + 11.3% 55 - 3.5% Jan-2015 90 + 9.8% 63 - 3.1% Feb-2015 105 + 11.7% 78 - 2.5% Mar-2015 100 + 12.4% 69 0.0% Apr-2015 90 + 4.7% 59 + 1.7% May-2015 71 + 9.2% 47 - 7.8% Jun-2015 60 + 1.7% 42 - 8.7% Jul-2015 54 - 3.6% 41 - 18.0% Aug-2015 61 + 1.7% 46 - 11.5% Sep-2015 64 - 4.5% 52 - 1.9% Oct-2015 70 - 1.4% 52 - 1.9% Total 71 + 3.6% 50 - 6.6% All data from MLS Property Information Network, Inc. Provided by the Greater Boston Association of REALTORS® and the Massachusetts Association of REALTORS®. Powered by 10K Research and Marketing. | 9 63 48 71 53 70 52 Single-Family Condominium October 30 50 70 90 110 130 150 170 Jan-2003 Jan-2004 Jan-2005 Jan-2006 Jan-2007 Jan-2008 Jan-2009 Jan-2010 Jan-2011 Jan-2012 Jan-2013 Jan-2014 Jan-2015 Historical Days on Market Until Sale Single-Family Condominium -1.9%+10.4%+12.7% 72 55 68 55 70 51 Single-Family Condominium Year to Date -7.3%0.0%-5.6% 20152014 20152014 20152014 20152014 -1.4% +2.9% 2013 2013 2013 2013
- 10. Percent of Original List Price Received Single-Family YoY Change Condominium YoY Change Nov-2014 96.3% + 0.2% 98.2% - 0.4% Dec-2014 95.3% - 0.5% 97.9% + 0.1% Jan-2015 95.6% + 0.3% 97.8% + 0.7% Feb-2015 95.1% - 0.7% 97.9% - 0.1% Mar-2015 96.2% - 0.2% 98.6% - 0.1% Apr-2015 97.2% - 0.2% 100.3% + 0.9% May-2015 98.8% + 0.6% 100.8% + 0.2% Jun-2015 99.2% + 0.5% 101.6% + 0.9% Jul-2015 99.1% + 0.9% 101.1% + 1.3% Aug-2015 98.2% + 0.4% 100.5% + 0.6% Sep-2015 97.5% + 0.8% 99.4% + 0.4% Oct-2015 96.8% + 0.3% 99.6% + 1.1% Average 97.5% + 0.4% 99.9% + 0.6% All data from MLS Property Information Network, Inc. Provided by the Greater Boston Association of REALTORS® and the Massachusetts Association of REALTORS®. Powered by 10K Research and Marketing. | 10 Percentage found when dividing a property’s sales price by its original list price, then taking the average for all properties sold in a given month, not accounting for seller concessions. 96.8% 98.6%96.5% 98.5%96.8% 99.6% Single-Family Condominium October 86% 88% 90% 92% 94% 96% 98% 100% 102% 104% Jan-2003 Jan-2004 Jan-2005 Jan-2006 Jan-2007 Jan-2008 Jan-2009 Jan-2010 Jan-2011 Jan-2012 Jan-2013 Jan-2014 Jan-2015 Historical Percent of Original List Price Received Single-Family Condominium +1.1%-0.1%-0.3% 96.8% 98.8%97.4% 99.4%97.9% 100.2% Single-Family Condominium Year to Date +0.8%+0.6%+0.6% 20152014 20152014 20152014 20152014 +0.3% +0.5% 2013 2013 2013 2013
- 11. Pending Sales A count of the properties in UAG status between the first and last day in a given month, regardless of current status (based on Off Market Date). Single-Family YoY Change Condominium YoY Change Nov-2014 916 + 3.9% 653 - 2.7% Dec-2014 650 + 9.4% 447 + 1.8% Jan-2015 716 + 11.0% 558 - 11.7% Feb-2015 667 - 15.9% 567 - 24.0% Mar-2015 1,153 - 8.0% 980 - 6.8% Apr-2015 1,581 + 7.3% 1,265 + 3.3% May-2015 1,765 + 9.4% 1,277 + 13.2% Jun-2015 1,822 + 20.3% 1,358 + 19.0% Jul-2015 1,348 + 13.1% 952 + 2.8% Aug-2015 1,207 + 21.6% 808 + 12.5% Sep-2015 1,296 + 22.5% 867 + 3.7% Oct-2015 1,410 + 20.5% 977 + 18.9% Total 14,531 + 10.2% 10,709 + 3.6% All data from MLS Property Information Network, Inc. Provided by the Greater Boston Association of REALTORS® and the Massachusetts Association of REALTORS®. Powered by 10K Research and Marketing. | 11 1,139 862 1,170 822 1,410 977 Single-Family Condominium October 200 400 600 800 1,000 1,200 1,400 1,600 1,800 2,000 Jan-2003 Jan-2004 Jan-2005 Jan-2006 Jan-2007 Jan-2008 Jan-2009 Jan-2010 Jan-2011 Jan-2012 Jan-2013 Jan-2014 Jan-2015 Historical Pending Sales Activity Single-Family Condominium +18.9%-4.6%+2.7% 12,453 9,904 11,706 9,226 12,965 9,609 Single-Family Condominium Year to Date +4.2%-6.8%-6.0% 20152014 20152014 20152014 20152014 +20.5% +10.8% 2013 2013 2013 2013
- 12. New Listings A count of the properties that have been newly listed on the market in a given month. Single-Family YoY Change Condominium YoY Change Nov-2014 797 - 9.7% 598 + 0.2% Dec-2014 591 + 9.9% 395 + 0.5% Jan-2015 894 - 4.6% 709 - 10.5% Feb-2015 697 - 38.9% 616 - 33.5% Mar-2015 1,545 - 13.0% 1,253 - 4.0% Apr-2015 2,525 + 12.6% 1,746 + 11.4% May-2015 2,585 + 4.3% 1,618 + 9.5% Jun-2015 2,362 + 18.2% 1,544 + 16.6% Jul-2015 1,715 + 14.5% 1,078 + 1.3% Aug-2015 1,439 + 13.6% 914 + 17.6% Sep-2015 2,033 + 10.5% 1,432 + 12.1% Oct-2015 1,586 + 2.6% 1,137 + 5.3% Total 18,769 + 3.4% 13,040 + 3.6% All data from MLS Property Information Network, Inc. Provided by the Greater Boston Association of REALTORS® and the Massachusetts Association of REALTORS®. Powered by 10K Research and Marketing. | 12 1,468 1,078 1,546 1,080 1,586 1,137 Single-Family Condominium October 0 250 500 750 1,000 1,250 1,500 1,750 2,000 2,250 2,500 2,750 3,000 3,250 Jan-2003 Jan-2004 Jan-2005 Jan-2006 Jan-2007 Jan-2008 Jan-2009 Jan-2010 Jan-2011 Jan-2012 Jan-2013 Jan-2014 Jan-2015 Historical New Listing Activity Single-Family Condominium +5.3%+0.2%+5.3% 16,721 12,437 16,724 11,592 17,381 12,047 Single-Family Condominium Year to Date +3.9%-6.8%+0.0% 20152014 20152014 20152014 20152014 +2.6% +3.9% 2013 2013 2013 2013
- 13. City of Boston – Market Overview Key market metrics for the current month and year-to-date figures for the City of Boston. Key Metrics Historical Sparklines Oct-2014 Oct-2015 + / – YTD 2014 YTD 2015 + / – + 2.5% All data from MLS Property Information Network, Inc. Provided by the Greater Boston Association of REALTORS® and the Massachusetts Association of REALTORS®. Powered by 10K Research and Marketing. | 13 New Listings 575 627 + 9.0% 6,056 6,209 + 0.4% Pending Sales 415 528 + 27.2% 4,702 4,908 + 4.4% Percent of Original List Price Received 98.8% 99.3% + 0.5% 99.4% 99.8% -- Days on Market Until Sale 48 47 - 2.1% 49 48 - 2.0% Months Supply of Inventory 2.5 2.5 0.0% -- -- - 3.1% Inventory of Homes for Sale 1,015 934 - 8.0% -- -- -- Housing Affordability Index 102 103 + 1.0% 97 94 - 1.8% Median Sales Price $462,000 $532,000 + 15.2% $469,000 $515,000 + 9.8% Closed Sales 414 373 - 9.9% 4,536 4,453 10-2012 10-2013 10-2014 10-2015 10-2012 10-2013 10-2014 10-2015 10-2012 10-2013 10-2014 10-2015 10-2012 10-2013 10-2014 10-2015 10-2012 10-2013 10-2014 10-2015 10-2012 10-2013 10-2014 10-2015 10-2012 10-2013 10-2014 10-2015 10-2012 10-2013 10-2014 10-2015 10-2012 10-2013 10-2014 10-2015