Q1 2014 Fixed Income Outlook Fed Tapering, Growth, Inflation
•
1 like•11,113 views

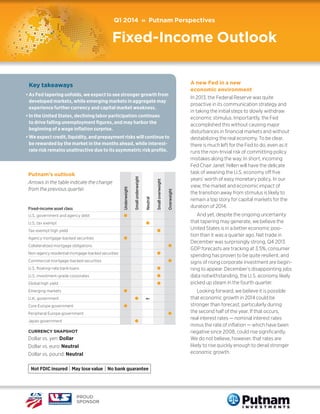
As Fed tapering unfolds, we expect to see stronger growth from developed markets, while emerging markets in aggregate may experience further currency and capital market weakness. In the United States, declining labor participation continues to drive falling unemployment figures, and may harbor the beginning of a wage inflation surprise. • We expect credit, liquidity, and prepayment risks will continue to be rewarded by the market in the months ahead, while interestrate risk remains unattractive due to its asymmetric risk profile.

Recommended
Recommended
More Related Content
What's hot
What's hot (20)
Similar to Q1 2014 Fixed Income Outlook Fed Tapering, Growth, Inflation
Similar to Q1 2014 Fixed Income Outlook Fed Tapering, Growth, Inflation (20)
More from Putnam Investments
More from Putnam Investments (16)
Recently uploaded
Recently uploaded (20)
Q1 2014 Fixed Income Outlook Fed Tapering, Growth, Inflation
- 1. Q1 2014 » Putnam Perspectives Fixed-Income Outlook Key takeaways • As Fed tapering unfolds, we expect to see stronger growth from developed markets, while emerging markets in aggregate may experience further currency and capital market weakness. • In the United States, declining labor participation continues to drive falling unemployment figures, and may harbor the beginning of a wage inflation surprise. l U.S. tax exempt Overweight U.S. government and agency debt Neutral Fixed-income asset class Underweight Arrows in the table indicate the change from the previous quarter. Small overweight Putnam’s outlook Small underweight • We expect credit, liquidity, and prepayment risks will continue to be rewarded by the market in the months ahead, while interestrate risk remains unattractive due to its asymmetric risk profile. l Tax-exempt high yield l Agency mortgage-backed securities l Collateralized mortgage obligations l Non-agency residential mortgage-backed securities l Commercial mortgage-backed securities l U.S. floating-rate bank loans l U.S. investment-grade corporates l Global high yield l Emerging markets l U.K. government l Core Europe government l Peripheral Europe government Japan government l l CURRENCY SNAPSHOT Dollar vs. yen: Dollar Dollar vs. euro: Neutral Dollar vs. pound: Neutral PROUD SPONSOR A new Fed in a new economic environment In 2013, the Federal Reserve was quite proactive in its communication strategy and in taking the initial steps to slowly withdraw economic stimulus. Importantly, the Fed accomplished this without causing major disturbances in financial markets and without destabilizing the real economy. To be clear, there is much left for the Fed to do, even as it runs the non-trivial risk of committing policy mistakes along the way. In short, incoming Fed Chair Janet Yellen will have the delicate task of weaning the U.S. economy off five years’ worth of easy monetary policy. In our view, the market and economic impact of the transition away from stimulus is likely to remain a top story for capital markets for the duration of 2014. And yet, despite the ongoing uncertainty that tapering may generate, we believe the United States is in a better economic position than it was a quarter ago. Net trade in December was surprisingly strong, Q4 2013 GDP forecasts are tracking at 3.5%, consumer spending has proven to be quite resilient, and signs of rising corporate investment are beginning to appear. December’s disappointing jobs data notwithstanding, the U.S. economy likely picked up steam in the fourth quarter. Looking forward, we believe it is possible that economic growth in 2014 could be stronger than forecast, particularly during the second half of the year. If that occurs, real interest rates — nominal interest rates minus the rate of inflation — which have been negative since 2008, could rise significantly. We do not believe, however, that rates are likely to rise quickly enough to derail stronger economic growth.
- 2. Q1 2014 | Fixed-Income Outlook Falling labor participation remains a problem Generally speaking, investors believe wage inflation could become a problem sooner than expected. As the unemployment rate moves downward, if wage inflation develops earlier than the Fed is anticipating, we could see the central bank reduce its stimulus efforts much earlier than the markets are currently forecasting. We do not see this coming to pass this winter, but it could be a development that raises significant concerns for the Fed and the markets later in 2014. Unemployment continues to drop, primarily due to a declining labor participation rate. This remains a cause for concern. The Fed, under Chairman Ben Bernanke, believed that an easy money policy — which tapering will not eliminate this year, but only gradually reduce — would generate enough cyclical dynamism to counteract any negative effects of the prolonged downturn. Furthermore, the Fed continues to believe that the non-accelerating inflation rate of unemployment (NAIRU) — the rate to which unemployment can fall without triggering wage inflation — is around 5.6%. However, our research suggests, and some institutions share the opinion, that the NAIRU may be significantly higher than this, primarily because of various structural problems hampering the labor participation rate. Figure 1: ixed-income asset F class performance The fourth quarter of 2013 continued to be a favorable environment for credit and liquidity risk. 3% 3Q 13 4Q 13 2% 1% 0% -1% -2% -3% U.S. government U.S. tax exempt Taxexempt high yield Agency Commercial U.S. U.S. mortgage- mortgage- floating- investmentbacked backed rate grade securities securities bank loans corporate debt Global high yield Emergingmarket debt U.K. gov’t Source: Putnam research, as of 12/31/13. Past performance is not indicative of future results. See page 10 for index definitions. 2 Eurozone gov’t Japan gov’t
- 3. PUTNAM INVESTMENTS | putnam.com We continue to favor defensive positions with respect to duration and the yield curve. Credit, liquidity, and prepayment: three risks we favor Asset class views Against the backdrop of soon-to-be scaled-back stimulus, the fourth quarter of 2013 continued to be a favorable environment for credit and liquidity risk — two of the four major risks that Putnam’s fixed-income teams see as fundamental to market dynamics. In addition, strategies oriented toward a third type of risk — prepayment risk, which includes investments in interest-only collateralized mortgage obligations — generally performed well. As we will describe in the asset class views that follow, we continue to see these risks as offering attractive reward potential as 2014 gets under way. Securitized sectors: continued strength outside the index Our mortgage credit holdings — both commercial mortgage-backed securities (CMBS) and non-agency residential mortgage-backed securities (RMBS) — aided our portfolios in the fourth quarter of 2013. Within CMBS, we focused our security selection efforts on “mezzanine” bonds rated BBB/Baa, which offered higher yields and what we believe are acceptable risks. By way of background, mezzanine CMBS are lower in the capital structure of a securitized deal backed by commercial mortgage loans, and provide a yield advantage over higher-rated bonds along with meaningful principal protection. Our non-agency RMBS investments rebounded from undervalued levels prior to the quarter, buoyed by investor demand for higher-yielding securities. Interest-rate risk: a risk to de-emphasize in long positions where possible The fourth major fixed-income risk we analyze — interestrate risk — has become less attractive for long positions in a context of rising interest rates. Viewing this risk as an opportunity to short, however, puts it in a better light. Prepayment push and pull While we continue to find prepayment strategies attractive, we are mindful of the leadership transition at the Federal Housing Finance Agency, the independent regulator overseeing Fannie Mae and Freddie Mac. Investors are concerned that President Obama’s selection to head the agency may be in favor of expanding the number of homeowners who would be eligible to reduce their mortgage principal balances, which could negatively affect certain prepayment strategies. However, this concern has been mitigated by rising interest rates, which have dampened homeowners’ incentive to refinance, and also by higher home prices, which have diminished the need to reduce mortgage principal balances. In accordance with portfolio mandates, we have thus tended and continue to favor defensive positions with respect to duration and the yield curve — in some cases, we have taken portfolio duration to negative on a net basis — particularly in the intermediate, 5- to 10-year portion of the curve. This strategy worked well in December, as the Fed’s announcement that it would begin tapering its bond buying caused rates in the 5- to 7-year portion of the curve to rise. High yield and bank loans: positive outlook amid recovery For the year ended December 31, 2013, issuance of new high-yield bonds reached a record of more than $398 billion, with a majority of the new-issue activity being used to refinance older, higher-coupon debt. Leveraged-loan new-issue activity totaled $669 billion, far surpassing the previous annual high of $388 billion in 2007. Like issuance in the high-yield market, leveraged-loan issuance was dominated by repricing and refinancing of existing debt. By credit rating, CCC/Caa-rated bonds and loans outperformed higher-rated bonds and loans by a sizable margin. 3
- 4. Q1 2014 | Fixed-Income Outlook Figure 2. Rates moved higher as the Fed discussed winding down its bond-buying programs We do not believe that rates are likely to rise quickly enough to derail stronger economic growth in 2014. 3% 12/31/13 9/30/13 2% 1% s ye ar 30 ye 10 ye 7 ar s s ar s 5 ye ar s ar ye 3 1m o 1 nth ye ar 0% Source: U.S. Department of the Treasury, as of 12/31/13. Default rate at pre-crisis lows At period-end, the high-yield default rate stood at 0.66%, its lowest level since December 2007, and considerably below the long-term average of 4.0%. The leveragedloan credit default rate, which combines bonds and loans, was at 1.03%, its lowest level since October 2011. From an industry perspective within the high-yield market, transportation was the best-performing group while cable and satellite was the weakest-performing group. Solid fundamentals for high-yield and bank loan markets We continue to view the fundamental backdrop for high-yield bonds and bank loans as solid: U.S. economic growth could strengthen in 2014, issuers appear to be in reasonably good financial shape, and default rates may remain near historically low levels. Specifically, we believe the high-yield default rate could remain below 2% through 2014 and possibly longer. While high-yield and bank-loan spreads compressed during the fourth quarter of 2013, they were still well above the euphorically tight levels that we saw in 2007 and remained closer to their historical averages. Consequently, in light of our default forecast, we believe spreads are fairly attractive. We believe the high-yield default rate could remain below 2% through 2014 and possibly longer. 4
- 5. PUTNAM INVESTMENTS | putnam.com Investment-grade credit below their 10-year average, we see the sector as offering some potential for investors to benefit from narrowing spreads given strong credit fundamentals. This is especially the case in financials, where many of the recent regulatory changes tend to be beneficial for bondholders. During the fourth quarter, we continued to see strong fundamentals among investment-grade bond issuers. Profit margins have remained high, and balance sheets tend to be in good shape. In addition, where companies are becoming increasingly leveraged, they are generally issuing debt at low cost with long-dated maturities. Although investment-grade credit has rallied significantly since the 2008 financial crisis and spreads have tightened Spreads generally compressed, but in many cases remained close to their historical averages. Figure 3. urrent spreads relative C to historical norms 1000 n verage excess yield over Treasuries 1000 A (OAS, 1/1/98–12/31/07) 950 950 C n urrent excess yield over Treasuries 800 800 (OAS as of 12/31/13) 600 600 650 650 573 573 425 425 437 437 400 400 298 298 200 200 114 130130 114 0 0 34 34 3737 Agencies Agencies 56 56 3535 89 89 123123 175 175 112112 150 150 100 100 Agency Agency Investment-grade AAA CMBS Investment-grade AAA CMBS MBS MBS corporates corporates High yield High yield Non-agency Non-agency RMBS RMBS Agency IO IO Agency EmergingEmergingmarket debt market debt Sources: Barclays, Bloomberg, Putnam, as of 12/31/13. Data are provided for informational use only. Past performance is no guarantee of future results. All spreads are in basis points and measure optionadjusted yield spread relative to comparable maturity U.S. Treasuries with the exception of non-agency RMBS, which are loss-adjusted spreads to swaps calculated using Putnam’s projected assumptions on defaults and severities, and agency IO, which is calculated using assumptions derived from Putnam’s proprietary prepayment model. Agencies are represented by Barclays U.S. Agency Index. Agency MBS are represented by Barclays U.S. Mortgage Backed Securities Index. Investment-grade corporates are represented by Barclays U.S. Corporate Index. High yield is represented by Barclays U.S. Corporate High Yield Index. AAA CMBS are represented by the Aaa portion of Barclays Investment Grade CMBS Index. EMD is represented by Barclays Global Emerging Markets Index. Non-agency is estimated using average market level of a sample of below-investment-grade securities backed by Alt-A collateral. Agency IO is estimated from a basket of Putnam-monitored interest-only securities. Option-adjusted spread (OAS) measures the yield spread over duration equivalent Treasuries for securities with different embedded options. 5
- 6. Q1 2014 | Fixed-Income Outlook Bond returns gained ground versus Treasuries amid central bank policy uncertainty and change. Figure 4. Spread sectors’ excess returns relative to Treasuries 2.5% 2.0% 1.5% 1.0% 0.5% 0.0% ABS CMBS Corporates MBS U.S. agency Source: Barclays, as of 12/31/13. Past performance is not indicative of future results. Tailwinds for developed markets, obstacles for emerging-market debt Rate volatility may not derail credit opportunities Higher rate volatility, which markets have been grappling with since the second quarter, affects most fixed-income assets negatively, including longer duration corporate credit. However, when rising rates are associated with an economic recovery, it often bodes well for corporate spreads; consequently, we believe spreads may continue to tighten modestly in 2014. From a sector perspective, securities issued by financial institutions, particularly large, money center banks, continued to perform well through the end of 2013. Regulation has transformed the banking industry by limiting risky activities and increasing capital requirements, which has resulted in a sustained improvement in credit spreads. In concert with improving economic data in the United States, Japan’s economy strongly rebounded through the end of 2013, while core European economies performed better than we expected and the outlook for peripheral Europe improved. During the fourth quarter, our overweight allocations to peripheral European government bonds in Portugal, Italy, Ireland, Spain, and Greece, which were held against a net short position in Germany, aided portfolio results. All told, a supportive economic backdrop encouraged investors to put capital to work in the global sovereign credit markets. We believe the Bank of Japan may need to engineer a further burst of inflation via the exchange rate this spring. 6
- 7. PUTNAM INVESTMENTS | putnam.com Japan’s reflation strategy One of the most dramatic policy-driven stories for non-U.S. markets has been unfolding in Japan. We do, however, see reasons to be wary of the efficacy of Japan’s reflation strategy. Much of the current rise in inflation is due to exchange-rate dynamics, and we believe the Bank of Japan (BoJ) may need to engineer a further burst of inflation via the exchange rate this spring. In the near term, as well, Japan’s consumption tax hike will be a risk for the Japanese economy — indeed, its timing could prompt additional monetary easing by the BoJ. Japanese officials are sensitive to the Group of Ten (G10) countries’ views on the exchange rate, and it is clear that governments in both South Korea and Europe are unhappy with a dramatically weaker yen. The United States, by contrast, does not appear all that concerned, and instead appears sympathetic to the argument that Japan is using policy to create a path out of deflation. In our view, the yen could drop another 5% from year-end 2013 levels before the Japanese provoke the United States to lend political support to Japan’s disgruntled regional and global competitors. Figure 5. igh-yield spreads and defaults generally H move in tandem over credit cycles High-yield default rate Spread to worst Current spread: 437 bps (as of 12/31/13) 20-year median spread: 523 bps Average default rate: 4.0% Default rate 1990–91 recession 2000 1600 2001 recession 1200 800 8 400 4 0 0 ’87 ’88 ’89 ’90 ’91 ’92 ’93 ’94 ’95 ’96 ’97 ’98 ’99 ’00 ’01 ’02 ’03 ’04 ’05 ’06 ’07 ’08 ’09 ’10 ’11 ’12 12/31/13 Source: JPMorgan, High Yield Market Monitor, 12/31/13. A basis point (bp) is one-hundredth of a percent. One hundred basis points equals one percent. Spread to worst measures the difference between the best- and worst-performing yields in two securities or asset classes. 7 Spreads (bps) 12 Today, the gap between spreads and defaults remains wide, signaling opportunity for investors 2007–09 recession 20% 16 High-yield spreads dropped below their long-term average; defaults remain low.
- 8. Q1 2014 | Fixed-Income Outlook European equilibrium, smoke, and mirrors In Europe, we believe slow growth will continue. Having said that, some regional differentiation will be apparent. Spain is doing much better than it had been just 18 months ago, and even Italy looks somewhat healthy now that its political crisis has passed. Importantly, fiscal pressure in the form of austerity programs is slated to ease somewhat this year. In a positive scenario, this could boost GDP growth, improve revenue growth for corporations, and result in better margins for companies that streamlined their operations during the period of austerity. In a dourer scenario, growth may remain too weak to pull up inflation, which is uncomfortably low. This puts the European Central Bank (ECB) in a tight spot: Essentially at the threshold of instituting negative rates, it has very limited monetary policy ammunition left to help mitigate disflationary or deflationary pressures. In the meantime, however, tightening peripheral European spreads represent a form of financial easing, for which the ECB is quite grateful. Policy in Europe remains a game of smoke and mirrors. In his press conference on January 9, 2014, ECB President Mario Draghi beat the stronger-forward-guidance drum and reiterated an old and untried promise to do more if circumstances require. The OMT (Outright Monetary Transactions), through which the ECB might purchase European sovereign debt in the secondary market, is such a promise. In the eyes of many policymakers, it has thankfully never had to be utilized. Figure 6: unicipal bond credit spreads M have narrowed from historical wides The most attractive relative values continue to populate in the BBB-rated segment of the muni market. Municipal bond spreads by quality rating 500 AA A BBB 400 300 200 100 0 1999 2000 2001 2002 2003 2004 2005 2006 Sources: Putnam, as of 12/31/13. Credit ratings are as determined by Putnam. 8 2007 2008 2009 2010 2011 2012 12/31/13
- 9. PUTNAM INVESTMENTS | putnam.com Essentially at the threshold of instituting negative rates, the ECB has very limited monetary policy ammunition left. Emerging markets under pressure By contrast, emerging markets have come off a rough quarter, both in terms of deteriorating growth data and in response to the rise in developed-market rates. Indeed, a large wave of investors took tapering as their signal to move money out of emerging-market sovereign and corporate debt (EMD), as these were perceived to be too risky relative to “safer” developed-market debt securities offering higher-trending yields. Also, many investors moved out of emerging-market equities in the fourth quarter of 2013, which put downward pressure on emerging-market currencies and amplified the decline in EMD. A productive emphasis on revenue bonds For example, we have found improving fundamentals and still-attractive spreads among revenue credits, which are typically issued by state and local government entities to finance specific revenue-generating projects. We have also maintained an overweight exposure to municipal bonds rated A and BBB. While we believed that the budget challenges faced by many municipalities were significant in the final months of 2013, we were confident that conditions would improve as long as the broader economy did not stall. Our overweight position in essential service revenue bonds was offset by our underweight positioning in local G.O. (general obligation) bonds — securities issued at the city or county level. In terms of sectors, we tended to favor airlines, higher education, utility, and health-care bonds. Looking forward, we see opportunities in select areas of higher-yielding sovereign debt. While these positions may be perceived as riskier in terms of credit risk, they are generally short-term bonds, which are less exposed to the negative effects of rising interest rates. Technicals and tax policy may raise concerns Technical factors in the market will likely continue to be a source of uncertainty. Tax-exempt municipal fund outflows for 2013 topped $60 billion — the most in 20 years — and have put downward pressure on prices. Although we have seen some value-conscious retail and institutional buyers come into the market to help support prices, we think it is unlikely that we will see volatility subside until outflows and rate volatility diminish. Municipal bonds: strong fundamentals despite rate headwinds and headline risks The past quarter, and most of 2013 for that matter, proved to be a volatile time for municipal bonds, and market conditions remain turbulent. Uncertainty about interest rates and the headline risk from a few isolated credit situations diverted investor attention from the overall health of the municipal bond market. However, we believe that the underlying fundamentals in the municipal bond market are quite strong. With regard to tax policy, many issues remain unresolved, including the debt ceiling and the potential for broader tax reform — both of which could affect the value of municipal bonds. Although these conditions could contribute to volatility, that in itself may offer attractive buying opportunities to investors focused on the fundamentals. 9
- 10. Q1 2014 | Fixed-Income Outlook Among currencies, the dollar and euro find support After a considerable run, the Japanese yen position has been all but flattened in the portfolio. Over the medium term, it is expected that the BoJ will have to do much more than is currently slated and should provide further impetus for USD/JPY to move higher. Our U.S. dollar position is moderate long. Labor market data have been consistent with the Fed’s intention to taper asset purchases in January. However, with Janet Yellen leading the Fed, the market expects forward guidance to be strengthened to ensure that when tapering does occur, the front end will remain anchored. Short-term rates are likely to come under pressure as the U.S. economy continues to outperform and the market begins to challenge the FOMC forward guidance, and this should be supportive of the U.S. dollar. Tapering expectations continue to have an impact on the Australian dollar and other current account deficit countries that had been supported by safe-haven fixedincome flows. This should keep the Australian dollar biased to the downside, but the carry associated with being short does not make it the most attractive short. We also favor an underweight to the Canadian dollar. As Canada suffers from a widening in its current account and basis balance, the Canadian dollar will likely continue to lose ground against the U.S. dollar over the medium term. We modestly favor the euro as the surprise rate cut by the ECB was not the beginning of more aggressive policy, but rather a statement that the council has done enough given its expectations for growth and inflation. The risk of the euro weakening remains somewhat limited as the eurozone is set to run a current account surplus exceeding 2% of GDP this year, eurozone banks continue to shed and repatriate overseas assets, and economic data slowly improve. In emerging markets, the environment has changed substantially and our positioning is much more neutral. The surprise by the FOMC and arrival of Yellen at the helm of the FOMC increase the chance of a much more benign change to U.S. monetary policy, although with the plan for tapering, conviction for emerging-market currencies is lower than before. Those currencies with weak external balances, such as those of Indonesia, India, Turkey, and South Africa, are less likely to participate in any rallies as fixed-income flows dry up and start to reverse course. The British pound sterling positioning remains modest. Growth data remain strong and are challenging the forward guidance as laid out by the Bank of England, but the pound has been the strongest currency over the past several months, reflecting this strength. The pound should be supported over the medium term, but positioning could be a challenge in the short term. Agency mortgage-backed securities are represented by the Barclays U.S. Mortgage Backed Securities Index, which covers agency mortgage-backed pass-through securities (both fixed-rate and hybrid ARM) issued by Ginnie Mae (GNMA), Fannie Mae (FNMA), and Freddie Mac (FHLMC). Japan government is represented by the Barclays Japanese Aggregate Bond Index, a broad-based investment-grade benchmark consisting of fixed-rate Japanese yen-denominated securities. Tax-exempt high yield is represented by the Barclays Municipal Bond High Yield Index, which consists of below-investment-grade or unrated bonds with outstanding par values of at least $3 million and at least one year remaining until their maturity dates. Commercial mortgage-backed securities are represented by the Barclays U.S. CMBS Investment Grade Index, which measures the market of commercial mortgagebacked securities with a minimum deal size of $500 million. The two subcomponents of the U.S. CMBS Investment Grade Index are U.S. aggregate-eligible securities and non-eligible securities. To be included in the U.S. Aggregate Index, the securities must meet the guidelines for ERISA eligibility. U.K. government is represented by the Barclays Sterling Aggregate Bond Index, which contains fixed-rate, investment-grade, sterling-denominated securities, including gilt and non-gilt bonds. U.S. floating-rate bank loans are represented by the SP/LSTA Leveraged Loan Index, an unmanaged index of U.S. leveraged loans. Emerging-market debt is represented by the JPMorgan Emerging Markets Global Diversified Index, which is composed of U.S. dollar-denominated Brady bonds, eurobonds, traded loans, and local market debt instruments issued by sovereign and quasi-sovereign entities. U.S. government and agency debt is represented by the Barclays U.S. Aggregate Bond Index, an unmanaged index of U.S. investment-grade fixed-income securities. U.S. investment-grade corporate debt is represented by the Barclays U.S. Corporate Index, a broad-based benchmark that measures the U.S. taxable investment-grade corporate bond market. Eurozone government is represented by the Barclays European Aggregate Bond Index, which tracks fixed-rate, investment-grade securities issued in the following European currencies: euro, Norwegian krone, Danish krone, Swedish krona, Czech koruna, Hungarian forint, Polish zloty, and Swiss franc. U.S. tax exempt is represented by the Barclays Municipal Bond Index, an unmanaged index of long-term fixed-rate investment-grade tax-exempt bonds. Global high yield is represented by the BofA Merrill Lynch Global High Yield Constrained Index, an unmanaged index of global high-yield fixed-income securities. You cannot invest directly in an index. 10
- 11. PUTNAM INVESTMENTS | putnam.com This material is provided for limited purposes. It is not intended as an offer or solicitation for the purchase or sale of any financial instrument, or any Putnam product or strategy. References to specific securities, asset classes, and financial markets are for illustrative purposes only and are not intended to be, and should not be interpreted as, recommendations or investment advice. The opinions expressed in this article represent the current, good-faith views of the author(s) at the time of publication. The views are provided for informational purposes only and are subject to change. This material does not take into account any investor’s particular investment objectives, strategies, tax status, or investment horizon. The views and strategies described herein may not be suitable for all investors. Investors should consult a financial advisor for advice suited to their individual financial needs. Putnam Investments cannot guarantee the accuracy or completeness of any statements or data contained in the article. Predictions, opinions, and other information contained in this article are subject to change. Any forward-looking statements speak only as of the date they are made, and Putnam assumes no duty to update them. Forward-looking statements are subject to numerous assumptions, risks, and uncertainties. Actual results could differ materially from those anticipated. Past performance is not a guarantee of future results. As with any investment, there is a potential for profit as well as the possibility of loss. Putnam’s veteran fixed-income team offers a depth and breadth of insight Successful investing in today’s markets requires a broad-based approach, the flexibility to exploit a range of sectors and investment opportunities, and a keen understanding of the complex global interrelationships that drive the markets. That is why Putnam has more than 70 fixedincome professionals focusing on delivering comprehensive coverage of every aspect of the fixed-income markets, based not only on sector, but also on the broad sources of risk — and opportunities — most likely to drive returns. D. William Kohli Co-Head of Fixed Income Global Strategies Investing since 1987 Joined Putnam in 1994 Michael V. Salm Co-Head of Fixed Income Liquid Markets and Securitized Products Investing since 1989 Joined Putnam in 1997 The information provided relates to Putnam Investments and its affiliates, which include The Putnam Advisory Company, LLC and Putnam Investments Limited®. Prepared for use in Canada by Putnam Investments Inc. [Investissements Putnam Inc.] (o/a Putnam Management in Manitoba). Where permitted, advisory services are provided in Canada by Putnam Investments Inc. [Investissements Putnam Inc.] (o/a Putnam Management in Manitoba) and its affiliate, The Putnam Advisory Company, LLC. Paul D. Scanlon, CFA® Co-Head of Fixed Income Global Credit Investing since 1986 Joined Putnam in 1999 11
- 12. Consider these risks before investing: International investing involves certain risks, such as currency fluctuations, economic instability, and political developments. Additional risks may be associated with emerging-market securities, including illiquidity and volatility. Lower-rated bonds may offer higher yields in return for more risk. Funds that invest in government securities are not guaranteed. Mortgage-backed securities are subject to prepayment risk. Derivatives also involve the risk, in the case of many over-the-counter instruments, of the potential inability to terminate or sell derivatives positions and the potential failure of the other party to the instrument to meet its obligations. Bond investments are subject to interest-rate risk, which means the prices of the fund’s bond investments are likely to fall if interest rates rise. Bond investments also are subject to credit risk, which is the risk that the issuer of the bond may default on payment of interest or principal. Interest-rate risk is generally greater for longer-term bonds, and credit risk is generally greater for below-investment-grade bonds, which may be considered speculative. Unlike bonds, funds that invest in bonds have ongoing fees and expenses. You can lose money by investing in a mutual fund. If you are a U.S. retail investor, please request a prospectus, or a summary prospectus if available, from your financial representative or by calling Putnam at 1-800-225-1581. The prospectus includes investment objectives, risks, fees, expenses, and other information that you should read and consider carefully before investing. In the United States, mutual funds are distributed by Putnam Retail Management. PUTNAM INVESTMENTS | putnam.com CM0200 283529 1/14