
Recommended
Recommended
More Related Content
Similar to Capsaicin and Sugar estimation in vegetables .pptx
Similar to Capsaicin and Sugar estimation in vegetables .pptx (20)
More from Baban Jeet
More from Baban Jeet (19)
Recently uploaded
Recently uploaded (20)
Capsaicin and Sugar estimation in vegetables .pptx
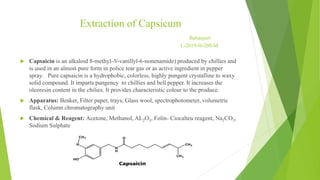
- 1. Extraction of Capsicum Babanjeet L-2019-H-208-M Capsaicin is an alkaloid 8-methyl-N-vanillyl-6-nonenamide) produced by chillies and is used in an almost pure form in police tear gas or as active ingredient in pepper spray. Pure capsaicin is a hydrophobic, colorless, highly pungent crystalline to waxy solid compound. It imparts pungency to chillies and bell pepper. It increases the oleoresin content in the chilies. It provides characteristic colour to the produce. Apparatus: Beaker, Filter paper, trays, Glass wool, spectrophotometer, volumetric flask, Column chromatography unit Chemical & Reagent: Acetone, Methanol, AL2O3, Folin- Ciocalteu reagent, Na2CO3, Sodium Sulphate
- 2. Procedure: Take 0.5g of red chilli powder, add 25 ml of Acetone shake well and Keep it in dark place Using Decant filter extract the solution and repeat this step atleast twice. Collect the crude extract for further estimation By using Column Chromatography (absorption followed by elution). Place glass wool at the base of column. Add AL2O3 1.5g and add Sodium Sulphate 1 cm layer at the top. Add 2 ml of sample in the column and Wash the column with 5 ml Acetone (3 times). Capsaicin is eluted by using solution of Acetone: Methanol in 75:25 ratio . Make up the volume to 50 ml. Allow the capsaicin to the elute from the column. After this allow the solution to evaporate up to 10 ml. Add 0.5 ml of FC reagent (1 N) Add 6 ml of distilled water and wait for 3 minutes. Add 1 ml of Na2CO3 Sodium carbonate and make the volume to 10 ml with distilled water. Keep in dark for 1 hour. The OD is taken at 760nm. Multiply the obtained value with 12.5 and we will get the capsaicin percentage of given sample. Optimum range of capsaicin content is 0.6-1.1%
- 3. Estimation of Sugars in Vegetables Babanjeet L-2019-H-208-M Sugars play important role in Vegetables. They add texture, taste, and color to processed products. Estimation of sugars is very important in fruits and vegetables as they are indicators of: Flavor/Acceptance of product Sugar/acidity which ratio is an indicator of flavor Shelf life of product (Sugar content is inversely proportional to shelf life) Sweetness (taste) Sugars are indicators of maturity. Apparatus: Conical flasks, Funnel, Whatmen number 1 Filter paper, Reflux system with water bath, Spectrophotometer, Test tubes, Volumetric flask Colorimetric tests for reducing sugars and polysaccharides have been known for a considerable time.
- 4. Reagents: Phenol (5%), Concentrated Sulphuric acid, Solvent-Ethanol (70%), Ethanol (80%), Glucose, Saturated solution of lead acetate, Sodium oxalate. Procedure: Take 0.5 g sample and reflux with about 20 ml of 80 % ethanol for 2 hrs, maintaining the volume of solvent. Filter through Whatman number 1 filter paper. Repeat the extraction twice with the residue, using 70% ethanol in subsequent extractions, 20 minutes each time. Pool the filtrates and add 5 ml saturated solution of lead acetated, in order to precipitate the proteins in the extract. If not removed, proteins will interfere with the estimation. Keep one hour and filter through Whatman number 1 filter paper. Add few crystals of sodium oxalate to the filtrate , keep one hour and again filter as before. This is done to remove excess of lead acetate. Make volume of the filtrate up to 100 ml with distilled water. Estimation: Take 0.2 ml of the extract , add 0.8 ml distilled water. Add one ml of 5% phenol, mix well. Add 4.0 ml of conc. H2SO4, mix and cool the test tubes. Read optical density at 490 nm in the spectrophotometer.
- 5. Preparation of standard curve: For standard curve, make a stock solution of glucose(100 μg/ml). Take 12 test tubes and mark them B1, B2,20A, 20 B, 40A, 40B, 60A, 60B, 80A, 80B, 100A, 100B. From the stock solution, pipette out 0.2 ml in 20A and 20B, 0.4 ml in 40A and 40B, 0.6 ml in 60A and 60B, 0.8 ml in 80A and 80B, 1.0 ml in 100A and 100B. Take 1 ml distilled water in tubes marked B1 and B2. Add distilled water in all the tubes so as to make 1.0 ml volume. Proceed for color development as for the sample, using phenol-sulphuric acid. Calculation: On a graph paper, plot the concentrations(0-100 μg/ml) along X-axis and OD values along Y-axis. The graph will be more or less a straight line, as OD is directly proportional to concentration. Plot the value of sample OD on graph and calculate the sugar concentration.
- 7. References: Dubois M, Giles A, Hamelton JK and Reber PA (1956) Colorimetric method for the determination of sugar and related substances. Anal Chem 28: 350-6 Alothman ZA, Rafi M Y, Ahmed A Y, and Usmaan M G (2014) Capsaicin and dihydrocapsaicin determination in chilli pepper genotypes using ultra fast liquid chromatography. Mol 19: 6474-88