
Recommended
Recommended
More Related Content
What's hot
What's hot (19)
Similar to Comparative between global threshold and adaptative threshold concepts in image processing
Similar to Comparative between global threshold and adaptative threshold concepts in image processing (20)
Recently uploaded
Recently uploaded (20)
Comparative between global threshold and adaptative threshold concepts in image processing
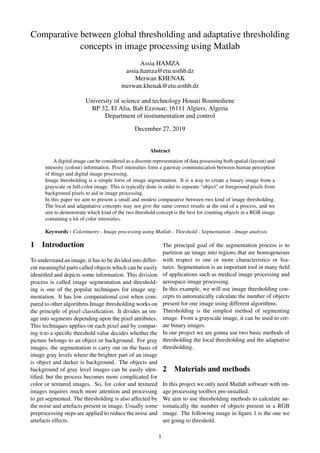
- 1. Comparative between global thresholding and adaptative thresholding concepts in image processing using Matlab Assia HAMZA assia.hamza@etu.usthb.dz Merwan KHENAK merwan.khenak@etu.usthb.dz University of science and technology Houari Boumediene BP 32, El Alia, Bab Ezzouar, 16111 Algiers, Algeria Department of instrumentation and control December 27, 2019 Abstract A digital image can be considered as a discrete representation of data possessing both spatial (layout) and intensity (colour) information. Pixel intensities form a gateway communication between human perception of things and digital image processing. Image thresholding is a simple form of image segmentation. It is a way to create a binary image from a grayscale or full-color image. This is typically done in order to separate "object" or foreground pixels from background pixels to aid in image processing. In this paper we aim to present a small and modest comparative between two kind of image thresholding. The local and adapatative concepts may not give the same correct results at the end of a process, and we aim to demonstrate which kind of the two threshold concept is the best for counting objects in a RGB image containing a lot of color intensities. Keywords : Colorimetry - Image processing using Matlab - Threshold - Segmentation - Image analysis 1 Introduction To understand an image, it has to be divided into differ- ent meaningful parts called objects which can be easily identified and depicts some information. This division process is called image segmentation and threshold- ing is one of the popular techniques for image seg- mentation. It has low computational cost when com- pared to other algorithms Image thresholding works on the principle of pixel classification. It divides an im- age into segments depending upon the pixel attributes. This techniques applies on each pixel and by compar- ing it to a specific threshold value decides whether the picture belongs to an object or background. For gray images, the segmentation is carry out on the basis of image gray levels where the brighter part of an image is object and darker is background. The objects and background of gray level images can be easily iden- tified, but the process becomes more complicated for color or textured images. So, for color and textured images requires much more attention and processing to get segmented. The thresholding is also affected by the noise and artefacts present in image. Usually some preprocessing steps are applied to reduce the noise and artefacts effects. The principal goal of the segmentation process is to partition an image into regions that are homogeneous with respect to one or more characteristics or fea- tures. Segmentation is an important tool in many field of applications such as medical image processing and aerospace image processing. In this example, we will use image thresholding con- cepts to automatically calculate the number of objects present for one image using different algorithms. Thresholding is the simplest method of segmenting image. From a grayscale image, it can be used to cre- ate binary images. In our project we are gonna use two basic methods of thresholding the local thresholding and the adaptative thresholding. 2 Materials and methods In this project we only need Matlab software with im- age processing toolbox pre-installed. We aim to use thresholding methods to calculate au- tomatically the number of objects present in a RGB image. The following image in figure 1 is the one we are going to threshold. 1
- 2. Figure 1: The base image for the case of study This image includes plenty of objects in different shapes, and different colors. The second step is to process the base image into a gray scale image, the results is in figure ?? And the histogram of the gray scale image is shown below in figure 3. Figure 2: Processing result of the base image into gray scale Figure 3: The histogram of the gray scale image Now that we have the histogram of the image in gray scale, we can start our thresholding. Just notice that the histogram of our image contains only one peak, we are gonna explain this remark later. 2.1 Global thresholding : Global threshold is totally dependent on the histogram of the image. The histograms of images may be af- fected with noise, contrast, hue, saturation, shadow and more. The aim of global threshold is to select a pixel intensity value from the histogram and set all the greater inten- sities from that value to the value 1, and the smaller intensities to 0. We got then a binary image. In our project we use the local center method on his- togram to chose the value of threshold. We devise the number center repeated of intensity (11000) on the value of intensity repeated (210) we got then a threshold value equal to 0.6. We apply then a thresholding with 0.6 value on our image and we got the segmented image in figure 4. Figure 4: The result of global threshold We notice that the global threshold with local cen- ter method made a loss of details in the image, the two yellow balls disappeared. 2.2 Adaptative thresholding : Like global thresholding, adaptive thresholding is used to separate desirable foreground image objects from the background based on the difference in pixel inten- sities of each region. There is a lot of algorithms to calculate the adaptative threshold value, the most well know is the Otsu algorithm. But in our project we use a general methode based on thresholding the image for each RGB intensity. First, we process the base image to a grey scaled image 2
- 3. for each basic color, so we have Red gray scale his- togram shown in figure 5 , Green gray scale histogram shown in figure 6 and Blue gray scale histogram shown in figure 7. Figure 5: Processing result of Red gray scale his- togram Figure 6: Processing result of the Green gray scale his- togram Figure 7: Processing result of the Blue gray scale his- togram Now we do the same steps of global threshold for each grey scale image for red, green and blue. The result are shown below : Figure 8: Global threshold of the Red gray scale Figure 9: Global threshold of the Green gray scale Figure 10: Global threshold of the Blue gray scale Now to achieve the adaptative threshold to our base image, all we need to do is to sum the Red gray scale threshold, the Green gray scale threshold and the 3
- 4. Blue gray scale threshold image. The result of adapta- tive threshold is shown in figure 11. Figure 11: The result of adaptative threshold We notice that in contrary of the global threshold, adaptative threshold have not lost objects in the image. 3 Results Now after we did the global and adaptative threshold- ing, we procede to the main objective of our applica- tion that is to make a program capable of detecting how many objects we have in the image. To compute how many objects we have in the image we display an algorithm that does these steps : - Measure properties of image regions using ’region- props’ then ’stats.area’ then ’stats.Eccentricity’ matlab commands. - Find Eccentricity of the Image. - Make a Bounding box to every object of the image and show the result of how many objects we have. The result of the global threshold is shown if figure 12 Figure 12: The result of global threshold computing The result of computing gives as that there is 16 objects in the image which is false. The two missing objects are the two balls lost in the global threshold. The result of the adaptative threshold is shown if fig- ure 13 Figure 13: The result of adaptative threshold comput- ing The result of computing gives as that there is 18 objects in the image which is correct. 4 Conclusion The computing error in global threshold is due to the lost of information during thresholding. The global thresholding is note intersting for use when the histogram of the image we work on contains only one peak. This cause the loss of important details and informations we need in the image. The global thresholding could be more for use on histogram that contains two peaks. The adaptative approach of threshold has shown sat- isfying results, because we adapted the threshold for every RGB scale in the image so we don’t lose details and informations. 4
- 5. References Gaurav Sharma 2003, Electrical engineering and applied signal processing series, Digital Color Imaging Hand- book Andreas Koschan, Mongi Abidi 2008, Digital color image processing Christine Fernandez - Maloigne 2013, Advanced Color Image Processing and Analysis Wilson, David, Laxminarayan, Swamy 2005, Handbook of Biomedical Image Analysis Volume 1: Segmenta- tion Models Uvais Qidwai and C. H. Chen 2009, DIGITAL IMAGE PROCESSING An Algorithmic Approach with MAT- LAB Chris Solomon and Toby Breckon 2011, Fundamentals of Digital Image Processing A Practical Approach with Examples in Matlab 5