APPLYING R-SPATIOGRAM IN OBJECT TRACKING FOR OCCLUSION HANDLING
Project 2
1. Object Detection Using Image Processing Techniques
Aditya Rayan Aranha
Dept. of Industrial & Systems Engineering
University at Buffalo, The State University of New York
Buffalo, NY 14228 USA
aaranha@buffalo.edu
Emmanuel Dylan Devotta
Dept. of Industrial & Systems Engineering
University at Buffalo, The State University of New York
Buffalo, NY 14228 USA
edevotta@buffalo.edu
Abstract—This paper describes a technique for detection of
multiple objects of different colors and shapes against a
background. The code is written in Matlab using the image
processing toolbox for object detection. The proposed approach
uses techniques such as obtaining a threshold from inspecting
histograms of RGB and Grayscale images and applying adaptive,
global & local threshold to isolate objects from the background.
Noise is filtered out and a complement of the image is used.
Bounding box methodology is used to find the center and
boundary of objects. The number of circular objects are found by
detecting centers and radii of circles. Simple counting program is
used to count the number of Images. Objects of different color
are isolated by identifying RGB pixel values for particular color
and mask is applied by specifying a range of pixel values.
Index Terms—Threshold, Object Detection, Pixel, Cluster ,
Circular, RGB(key words)
I. INTRODUCTION
Figure 1
The objective of the problem is to identify all objects and trace
their edges in the image by using various image processing
techniques. Once we have identified all objects the next step
would be to count all of them. After counting objects, we
would like to identify all circular objects and their centers in
the image and count them. The last step of the problem
involves identifying and segregating green circular objects
from the rest of the image.
II. PROCEDURE
The first step of the process if to convert the image to greyscale
and manually find a threshold value to separate objects from
background. For the image shown in Figure 1 after we convert
to greyscale and inspect the histogram. We choose a threshold
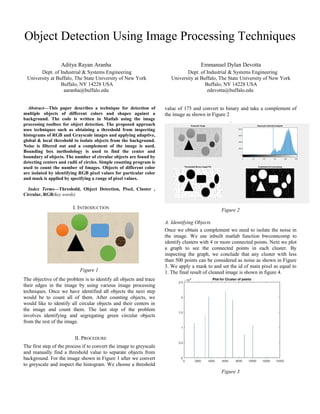
value of 175 and convert to binary and take a complement of
the image as shown in Figure 2
.
Figure 2
A. Identifying Objects
Once we obtain a complement we need to isolate the noise in
the image. We use inbuilt matlab function bwconncomp to
identify clusters with 4 or more connected points. Next we plot
a graph to see the connected points in each cluster. By
inspecting the graph, we conclude that any cluster with less
than 500 points can be considered as noise as shown in Figure
3. We apply a mask to and set the id of main pixel as equal to
1. The final result of cleaned image is shown in figure 4.
Figure 3
2. Figure 3
B. Tracing Boundaries and Identifying Circles
We use the mesh grid system to make a coordinate
system on the picture. For each cluster of pixels in an
objects we plot the maximum, minimum and mean
values in both horizontal and vertical directions for
each objects. After obtaining the bounding box we can
easily plot the mid-point of the objects.
To distinguish circles from other objects in the image
we use the logic that the distance in both the horizontal
and vertical direction for a circle show be zero. To
account for distortion at edges we use the condition
that if abs(d1-d2)<5 then the object is circular. (Note:
This logic would also apply to a square object, but the
figure does not contain any square objects)
To count the objects in the image, we have the object
clusters and pixel id. We use a simple counter to count
for all the objects. This logic is also applied separately
to count the circular objects as well.
The final results are shown in Figure 4.
Figure 4
C. Identification of Green Circular Objects
The procedure used to find green objects in the image uses the
inbuilt function in mathlab called impixel to find the individual
RGB pixels for the green shaded objects. Once we compare the
minimum and maximum pixel value for each RGB element in
the green shaded object we can use these parameters to set a
mask within a certain range of red>96 & red<=130 &
green>160 & green<185 & blue>=53 & blue<100 so that only
green shaded objects are isolated. The results of segregating the
green objects is shown in Figure 5
Figure 5
The procedure for trying to isolate the green objects based on
threshold values for each individual RGB plot of image by
inspecting the histograms proved unsuccessful as it was not
possible to find a specific threshold value to separate green
objects from rest of the objects.
III. REFERENCES
[1] Color Based Segmentation Procedures- www.mathworks.com
[2] Matlab Code for image processing on UB Learns-Dr
Ehsan Tarkesh Esfahani
![Figure 3
B. Tracing Boundaries and Identifying Circles
We use the mesh grid system to make a coordinate
system on the picture. For each cluster of pixels in an
objects we plot the maximum, minimum and mean
values in both horizontal and vertical directions for
each objects. After obtaining the bounding box we can
easily plot the mid-point of the objects.
To distinguish circles from other objects in the image
we use the logic that the distance in both the horizontal
and vertical direction for a circle show be zero. To
account for distortion at edges we use the condition
that if abs(d1-d2)<5 then the object is circular. (Note:
This logic would also apply to a square object, but the
figure does not contain any square objects)
To count the objects in the image, we have the object
clusters and pixel id. We use a simple counter to count
for all the objects. This logic is also applied separately
to count the circular objects as well.
The final results are shown in Figure 4.
Figure 4
C. Identification of Green Circular Objects
The procedure used to find green objects in the image uses the
inbuilt function in mathlab called impixel to find the individual
RGB pixels for the green shaded objects. Once we compare the
minimum and maximum pixel value for each RGB element in
the green shaded object we can use these parameters to set a
mask within a certain range of red>96 & red<=130 &
green>160 & green<185 & blue>=53 & blue<100 so that only
green shaded objects are isolated. The results of segregating the
green objects is shown in Figure 5
Figure 5
The procedure for trying to isolate the green objects based on
threshold values for each individual RGB plot of image by
inspecting the histograms proved unsuccessful as it was not
possible to find a specific threshold value to separate green
objects from rest of the objects.
III. REFERENCES
[1] Color Based Segmentation Procedures- www.mathworks.com
[2] Matlab Code for image processing on UB Learns-Dr
Ehsan Tarkesh Esfahani](data:image/gif;base64,R0lGODlhAQABAIAAAAAAAP///yH5BAEAAAAALAAAAAABAAEAAAIBRAA7)