March 2019 Investment Commentary & Performance
•
0 likes•70 views

First Quarter 2019 Market & LCV Portfolio Review

Recommended
Recommended
More Related Content
What's hot
What's hot (20)
Similar to March 2019 Investment Commentary & Performance
Similar to March 2019 Investment Commentary & Performance (20)
More from Anthony A. Lombardi, CFA
More from Anthony A. Lombardi, CFA (20)
Recently uploaded
Recently uploaded (20)
March 2019 Investment Commentary & Performance
- 1. ¹Comments and opinions expressed reflect solely the personal views of Anthony Lombardi as of 3/29/19, and not any other individual or firm. Such views are not a recommendation to buy or sell any security, fund or portfolio. Any investment decision should be made in consultation with a financial advisor. MARCH 2019 INVESTMENT COMMENTARY1
- 2. ¹Comments and opinions expressed reflect solely the personal views of Anthony Lombardi as of 3/29/19, and not any other individual or firm. Such views are not a recommendation to buy or sell any security, fund or portfolio. Any investment decision should be made in consultation with a financial advisor. MARCH 2019 INVESTMENT COMMENTARY1 Guns, Roses & The Madness of a March Quarter That Went Out With a Lyft “Said woman Powell take it slow, and it'll work itself out fine All we need is just a little patience Said sugar Powell make it slow and we'll come together fine All we need is just a little patience” In a basket case market, complete with a swinging pendulum of emotions, process and conviction are key to following the ultimate direction of the bouncing ball. The emotional temper tantrum thrown by the market in the fourth quarter was turned on its head, led in part by a “pivot-to-patience” signaled by the Fed Chair. Apparently, the dinner bell was rung a little too quickly by Father Powell, perhaps due to a lapse in the changeover to daylight savings time. Whatever the case, brackets and forecasts were busted, and playtime for the kids of the market was extended, and their appreciation was graciously returned in the form of one of the strongest quarters for the stock market in nearly 10 years. The quarter was complete with a reopened, yet viciously bipartisan Capital, several weak global economic reports including a light (yet distorted) February US jobs report, churning yet unfinalized US-China trade negotiations, conclusion of a 2-year old Mueller investigation into 2016 elections, full-fledged Brexit chaos overseas, yield curve inversion across parts of the US term structure, black swan events impacting the largest industrial company in the S&P (Boeing) and, as the time
- 3. ¹Comments and opinions expressed reflect solely the personal views of Anthony Lombardi as of 3/29/19, and not any other individual or firm. Such views are not a recommendation to buy or sell any security, fund or portfolio. Any investment decision should be made in consultation with a financial advisor. MARCH 2019 INVESTMENT COMMENTARY1 clock on the first quarter was expiring, administration calls for Fed to execute a 50bp cut and two buzzer-beating IPOs. Could there be a more fitting way to capture the past 180-day swing than have a 165-year old blue jeans company and a new economy ride-sharing company close out the quarter by setting the table for a 2019 calendar expected to generate nearly $1 trillion in new market value? Yeah, it’s definitely still playtime kids, but be mindful of the ringing bell, and time on the shot clock. At the core, the market is a discounting mechanism, and we remain vigilant as to where the pendulum swings at any given point. As noted in the past, cumulatively, such swings serve as building blocks in our constant assault seeking out opportunities for entry into, and exit from, investment positions. Most importantly, as inoculated value investors, we place a premium on staying true to our investment process with an unrelenting focus on MOS (margin of safety). As we have for three decades in this business, we vigilantly listen--to the market, the macro backdrop, sector and company news flow, and the corresponding swings in investor psychology. With our typical investment horizon targeted at ~3-5 years, implicit in such a holding period is not simply low turnover (and low cost), but a time-period integral to an investment discipline undeterred by short-term events and emotions. Given our large cap value process is contrarian, high-conviction, and concentrated, we need not scramble adjusting our long-standing views, or portfolio positioning, due to weekly, monthly or quarterly events. As part of our disciplined implementation, we overlay longer-term secular views pertaining to the broader macroeconomic and market backdrop, resulting in active sector and stock exposures. The foundation of our disciplined investment process and philosophy does not allow for it to be radically altered, nor portfolio stock selection and sector allocation be impacted in the same vein. Given investment backdrops do not formulate overnight, portfolio construction, in our opinion, should be the result of a broader mosaic that does not succumb to near-term emotions and current events. Whether a function of near- or intermediate-term fundamentals, and/or investor psychology, our focus remains on recognizing, assessing and seizing upon valuations that potentially present opportunities, be they BUY or SELL. We like how our portfolio positioning has migrated over the past three years, unwavering on process discipline, and always mindful of the ever-evolving mosaic. Portfolio Positioning & Review With liquidity in hand by having kept our guard up during previous quarters, we deployed capital advantageously during 1Q19 while also further solidifying MOS through a combination of active changes. Recall, during 4Q17, 1Q18, 2Q18, 3Q18 such actions led to consecutively, yet methodically, higher portfolio liquidity at the end of each period. Notably, in 3Q18, we made an active decision to increase our cash target +100bps, to 2.50% from 1.50%, in combination with an active decision to reduce allocations to TECH, IND, and CD, while increasing allocations to HC and CS (Staples). While our cash target of 2.50% was not raised during 4Q18, we believed it prudent to maintain, while also acting to incrementally desensitize cyclical exposures by further reducing ENE and correspondingly increasing CS sector target weights. The latter continuing our nibbling in a defensive sector that had, at the time, only recently become somewhat compelling. Our contrarian genes and available opportunity set aided in keeping our hand steady in the aftermath of the market’s emotional gyrations in 4Q18, leading us to take additional actions during 1Q19. Notably, we reduced our target Cash level 150bps, eliminated our exposure to the Real Estate sector, while increasing our target weights in CS and Comm Services sectors. As we have noted in prior commentaries during 2018, we chose not to ignore strong performance in our portfolio, coincided against broader equity market appreciation, select underlying valuation multiple expansion, upward traction in interest rates and potentially more challenging forward earnings comparisons during the next two
- 4. ¹Comments and opinions expressed reflect solely the personal views of Anthony Lombardi as of 3/29/19, and not any other individual or firm. Such views are not a recommendation to buy or sell any security, fund or portfolio. Any investment decision should be made in consultation with a financial advisor. MARCH 2019 INVESTMENT COMMENTARY1 years. All along, we believe our actions have served to reinforce a protective mindset, while still maintaining an optimistic long-term posture in our portfolio positioning. By prudently underscoring our focus on overall MOS, the portfolio’s performance was served well during a volatile 2018 and, following our actions in the first-quarter, we believe is positioned well for 2019. Our LCV portfolio exposure was trimmed to 10 of 11 sectors, but maintained an emphasis on issues possessing compelling valuations, financial statement strength, and where near-term psychology serves to compensate for risk, providing the inherent MOS we seek when investing over a 3- to 5-year time horizon. Straying to own safety at any price has never been an acceptable paradigm as our value conscious and investment process simply will not allow us to pay any multiple for quality. While conscious of risk factors, we are investors viewing through a risk/reward prism, in active pursuit of opportunities providing the right balance. We seek companies offering a combination of cheapness, a contrarian view, possessing stable long-term balance sheets and attractive FCF characteristics. That said, we are never married to one view as valuations, sentiment and process drive our decision-making. Such patience paid dividends during 3Q18, 4Q18 & 1Q19 as we felt the combination of our long-term time horizon and valuation compression in certain defensive areas hit risk/reward levels that became appealing. As opportunities present themselves, we have increasingly nibbled and reallocated our portfolio with a contrarian mindset. Despite having maintained a higher cash target during the past few quarters, we are still finding, buying and remaining owners of cheapness, MOS and compelling free cash flow (FCF), while at the same time we are sellers when valuation criteria or process constraints are breached. As to the latter, our decision to fully exit the Real Estate sector during the first quarter reflected such discipline. Not only has deployment of investable capital in this manner been more acceptable to our contrarian, value-based discipline, but also in recognition that forward long-term returns are typically related to point-of-entry valuation multiples. When juxtaposed against our belief favorable operating leverage opportunities still exist in the economy, and amongst companies we target, we remain steadfast in how we aim to position our LCV portfolio. Key Trades & Attribution We seeded a concentrated LCV strategy during the first quarter 2016. Since inception, as opportunities have been presented, we have made several active portfolio decisions, at both the stock and sector level. During 1Q19, notable actions included: Sector Target Weighting Changes: o Consumer Staples (+) o Communication Services (+) o Real Estate (-) Position Target Weighting Changes & Rebalance Trades across several sectors: o Technology o Consumer Staples o Consumer Discretionary o Communication Services o Real Estate o Utilities
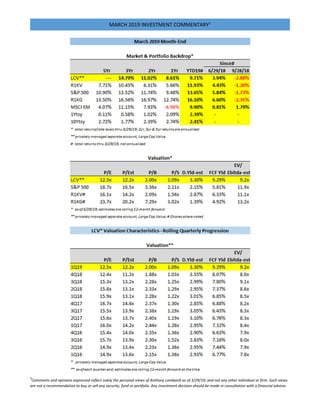
- 5. ¹Comments and opinions expressed reflect solely the personal views of Anthony Lombardi as of 3/29/19, and not any other individual or firm. Such views are not a recommendation to buy or sell any security, fund or portfolio. Any investment decision should be made in consultation with a financial advisor. MARCH 2019 INVESTMENT COMMENTARY1 One FULL SALE, two new FULL positions via deals and three sector weight changes. Our activity level remained high in the first quarter (1Q19) as the backdrop presented continued opportunities, allowing us to underscore our convictions and remain steadfast in executing our investment process. While our investment discipline is generally characterized by low turnover, when action is dictated by process, we execute accordingly—there is never hesitation with a stated process. We neither date, nor fall in love with any stock or sector, nor attempt to justify going beyond embedded process constraints as reasons for portfolio exposures. Our target sector weightings are influenced by top-down and bottom-up views, while fundamentals, valuation and psychology drive stock level decisions. For the first time since 3Q18, we executed full position SALEs and BUYs, amongst other activity which included changes to three (3) sector target weightings and numerous rebalance (up and down) trades to position target weightings, cumulatively touching six (6) sectors. Having had a bias for higher Cash target weighting during the past few quarters, we fully utilized this cushion by quarter-end. Recall we had taken actions in 2018 to reduce sector weightings in Technology, Industrials, & Consumer Discretionary, while also increasing sector weightings in Consumer Staples and Healthcare. During the March quarter, although we drew-down our Cash target, we did so in the context of further increases to our Staples sector weighting, while also increasing our target weighting in Communication Services sector. Additionally, we fully exited Real Estate by taking our target allocation to 0%, a contrarian move in a strong performing sector, yet one allowed by our investment process. We do not view portfolio actions taken during 2018-2019 as wholesale changes, but continuation of measured and timely modification to our long-standing optimistic stance, founded upon our investment process and which we had long pre-telegraphed. Indicative of this migration is the combined underweight allocation to HC and CS, which stood at -290bps at quarter-end, compared to nearly -1,200bps at the end of 3Q16; a shift that occurred through a combination of valuation compression and active portfolio allocation decisions. On a weighted average basis, the market capitalization of our holdings increased 16.3% compared to the prior quarter, to $144.5 billion, compared to the portfolio’s total return of 9.7% during the same time period. The greater increase in capitalization versus returns reflects portfolio changes we made in sector and target holding weightings during 1Q19. MOS remains our principal guide for which we are compelled by process to follow. Quarter-end target and market value weights for our LCV portfolio are detailed below.
- 6. ¹Comments and opinions expressed reflect solely the personal views of Anthony Lombardi as of 3/29/19, and not any other individual or firm. Such views are not a recommendation to buy or sell any security, fund or portfolio. Any investment decision should be made in consultation with a financial advisor. MARCH 2019 INVESTMENT COMMENTARY1 On a market value basis, we ended 1Q19 with 1.0% cash, significantly lower compared to 3.1% in 4Q18. Our cash target weighting had been raised to 2.5% from 1.5% during 3Q18, remain unchanged in 4Q18, and was reduced during 1Q19 to 1.0%. Recall, from a process perspective, our targeted cash range is designed to provide flexibility, to allow for repositioning within a highly concentrated, yet diversified portfolio. While we are long- term investors, we have a stated preference to monetize winners, and/or sell-down positions based on discipline, in so doing avoid placing capital at risk by simply holding investments as place-markers or allowing exposures to become excessive when selective rebalance is more appropriate. MOS is paramount for us and is critical in limiting potential downside. Holding a position that has attained valuation levels no longer representative of attractive risk/reward only serves to create undo diversification risk and is simply an unacceptable practice. With protection of capital a covenant we are unwilling to break, we firmly believe in utilizing process-permitted cash level when situations dictate, to adhere to this core investment principle. Similarly, significant rebalancing trades we have executed serve to protect capital in very much the same way. And, when process and valuation present opportunity, we look to not only reallocate capital but deploy excess cash levels accordingly. Such discipline is among several key distinguishing characteristics in our process. We simply have no penchant to manage a portfolio structured with individual positions not representative of our high convictions, and firmly believe in a concentrated list of holdings, yet one diversified across market sectors. As we have noted previously, with our sector band targets at 0.5x to 1.5x respective S&P 500 capitalization weights, should a sector’s size fall materially below certain predefined thresholds our process further allows for optionality for a 0% sector target with redeployment of available capital into other sectors, or cash. During 1Q19, we utilized this 0% optionality regarding the Real Estate sector. At quarter-end, the only other sectors near, or within this 0% optionality range included Materials and Utilities. Investment Performance. For the March quarter, our LCV portfolio generated total return of 9.7% vs the Russell 1000 Value (R1KV) return of 11.9%, and broader S&P 500 return of 13.7%. For rolling one year-ended March 2019, our LCV portfolio generated total return of 8.6% vs R1KV return of 5.7% and broader S&P 500 return of 9.5%. On the heels of the weakest quarter (4Q18), the absolute total return of our LCV portfolio in 1Q19 marked the strongest since inception, eclipsing the +9.2% and +7.4% returns posted in 4Q17 and 4Q16, respectively. Ironically, despite the strongest absolute return, our portfolio’s relative underperformance of ~-220bps vs R1KV in 1Q19 was the weakest since inception, driven solely by Security Selection, and offset only partially by Allocation. Compared to the broader market (S&P 500), where underperformance of ~-395bps in the quarter was also the weakest since inception, Security Selection detracted ~-355bps, while Allocation was an additional drag of ~-40bps. For the full year, our portfolio’s outperformance of ~+295bps vs R1KV was driven by strong Security Selection ~+355bps, partially offset by a drag from Allocation. Compared to the broader market, rolling 1-year underperformance of ~-90bps was driven primarily by an Allocation drag of ~-125bps and Security Selection contributing a modest offset of ~+35bp. Despite weak quarterly relative performance in 1Q19, and a market environment characterized by significant volatility, our portfolio’s returns on a rolling 1-year, 2-year and 3-year basis all remain meaningfully above that of our primary style benchmark, the R1KV. As noted in prior commentaries, most critical in our discipline is the ability to protect in downside market environments, by an unrelenting focus on MOS and process, given long-term preservation of capital has much more to do with absolute loss of capital than upside return participation.
- 7. ¹Comments and opinions expressed reflect solely the personal views of Anthony Lombardi as of 3/29/19, and not any other individual or firm. Such views are not a recommendation to buy or sell any security, fund or portfolio. Any investment decision should be made in consultation with a financial advisor. MARCH 2019 INVESTMENT COMMENTARY1 Our portfolio’s characteristics continue to reflect a disciplined, contrarian, and value-oriented process. As illustrated in the tables on page one, staying mindful of general market valuation levels, and more importantly that of our LCV portfolio, has long remained paramount. Heading into 2018, the protection offered by the valuation discount in our portfolio versus our primary benchmark and the broader market was significant and served us well during market weakness experienced in the front- and back-end quarters of the year, while also allowing for upside capture during 2Q18 & 3Q18. While generally comfortable with the investment backdrop, during late 4Q17 and throughout 2018 we had alluded our radar remained dialed-up to material, incremental valuation multiple migration without corresponding fundamentals improving. As a result, we made increasingly active moves in the portfolio during 2018 to solidify cheapness, as well as desensitizing some cyclicality. As evidenced by outperformance in our longer-term comparative investment returns, our re-positioning has proved beneficial. Despite ongoing outperformance, however, our LCV portfolio still remains materially cheaper across nearly every valuation metric, notably boasting higher FCF & dividend yields, lower P/E’s (trailing & forward) and EBITDA multiples, and lower P/S and P/B compared to the broader S&P 500 and R1KV, the latter our primary benchmark. At period-end, meaningful valuation gaps between our LCV portfolio and R1KV remained intact, with FCF yield and EV/EBITDA being notable examples at a +296bps premium and 17% discount (vs R1KV), respectively. In lieu of the interest rate backdrop, and growing appetite by managements to take on incremental financial leverage, we have continued to keenly monitor balance sheet trends, as well as EBITDA multiples. Having first eclipsed 9x during 3Q18, our portfolio’s EV/EBITDA multiple hit a new high of 9.2x in 1Q19, driven in part by our decision to increase target weights in Consumer Staples and Communication Services. Comparatively, however, our portfolio remains at a discount to both the S&P 500 and R1KV multiples of ~12x and ~11x, respectively. From attribution standpoint, positive 1Q19 contribution from Allocation was far exceeded by Selection drag. Specifically, versus the R1KV, Security Selection and Allocation during March quarter amounted to ~-290bps and ~+70bps, respectively. Technology, Healthcare and Financials were the most significant contributors in total attribution, while Consumer Discretionary, Consumer Staples and Communication Services were the most significant detractors. By Allocation, Technology and Industrial sectors had the largest positive attribution, while Energy and Real Estate were the largest detractors. By Stock Selection, Energy and Financials were the largest contributors, while Consumer Discretionary and Consumer Staples were the largest drags. On an absolute basis, all sectors in our portfolio except Consumer Discretionary posted positive returns quarter/quarter. By comparison, every sector in the R1KV posted a sequential increase, led by Industrials and Technology. Our targeted cash position was reduced to 1.00% in the first quarter, down 150bps sequentially, as our bias to build prior liquidity was outweighed by compelling opportunities to deploy capital. For the full quarter our cash position was a negative contributor during a strong absolute performance quarter, resulting in ~-25bps of attribution drag. Real Estate: DECREASE Sector weighting -150bps; 1 FULL position SALE: 1.5%-->0.0% Since being broken out separately from Financial Sector at the end of 3Q17, Real Estate outperformed the broader S&P 500 by nearly 200bps, posting annualized total return of ~12% vs ~10%. At 3.1%, the sector ended the quarter at its highest market capitalization representation since its independent breakout, while also commanding healthy valuation levels given it trades at its lowest dividend yield (~3%) and highest multiples on book and EBITDA. The sector has greatly benefited by low interest rates which, at this point, we believe
- 8. ¹Comments and opinions expressed reflect solely the personal views of Anthony Lombardi as of 3/29/19, and not any other individual or firm. Such views are not a recommendation to buy or sell any security, fund or portfolio. Any investment decision should be made in consultation with a financial advisor. MARCH 2019 INVESTMENT COMMENTARY1 represents more risk than reward for the overall sector. Looking out over the next 3-5 years, we believe broader market expectations will increasingly shift to calls for continued moderation in profit margins and earnings momentum, as well as a slowdown in economic growth. As such, we’d rather not be in such a high-flying sector priced at healthy valuations, strongly positive sentiment and where there are likely to be macro-related risks facing the underlying asset class. Additionally, the sector also has a material composition of market capitalization that is arguably not comprised of traditional real estate plays. Notably, at quarter-end, ~41% of the RE sector’s market capitalization (~130bps of ~310bps) was comprised of “Specialized REITs”, of which ~100bps (or ~1/3 of the total RE sector) is more technology-oriented. Amongst these stealthy tech companies include: AMT, CCI, EQIX, DLR & SBC. We are also quite cognizant that our current LCV portfolio has significant exposure to real estate assets through the Financial Services sector. Specifically, our target weighting in Financials reflects a contrarian bias, where our exposure is at its maximum allowed by process (19.0%), owing to valuations at materially more compelling levels, and where capital and balance sheets are in strong, healthy condition. In combination with the optionality afforded in our process to allocate 0% should a sector’s size fall materially below certain predefined thresholds, the aforementioned strong performance and valuation levels of the sector, and material asset class exposure elsewhere in the portfolio, we utilized this 0% optionality regarding the Real Estate sector by executing the FULL SALE of our one target holding, CBRE, from 1.50% down to 0%. Our original decision to purchase CBRE was valuation and business model driven. With respect to the latter, CBRE offered a unique situation relative to the sector, with more reliance on fees, it had international exposure and management a proven executor. Market capitalization was also lower and distant from some of the more prominent sector names, its shares had materially underperformed on a relative basis 5-years leading into our initial purchase and the company was one of the few non-dividend payors in the space which gave comfort as to its balance sheet focus. Since initial purchase in 3Q16, CBRE materially outperformed the broader market, our primary benchmark and its sector. Specifically, CBRE posted an annualized total return of 26.4% compared to 13.2%, 9.3% and 5.6% for the S&P 500, R1KV and the S&P Real Estate Sector, respectively. In terms of valuation, at time of purchase, CBRE was valued at compelling multiples, with a strong balance sheet: 12.6x forward P/E, 0.7x P/S, 3.3x P/B, 11.7x EV/EBITDA, low cap ex intensity (< 2%), BBB credit rating, long-term debt/cap < 40%, and an activist shareholder in ValueAct holding 10%+ ownership and a board seat since 2012. Sentiment on CBRE was favorable, with 88% BUYs/12% HOLD yet 12-month price target was only 10% above then current levels. Given its global portfolio of real estate and related services, CBRE was also engulfed by concerns regarding developments pertaining to Brexit. At time of sale, the shares reflected 55% BUY/45% HOLD, an $86 12-month price target, 15x forward P/E, 0.8x P/S, 3.5x P/B, 13x EV/EBITDA, and the balance sheet was stronger at nearly 20% LTD/Cap and a BBB+ credit rating. Profit margins decelerated, with gross margins having declined from > 35% in FY15 to ~23% in FY18, while EBITDA margins have similarly declined from > 10% in FY15 to ~7% FY18. With a high-quality management team, strong balance sheet, more expensive valuation, some margin degradation, changed sentiment and having materially outperformed the broader market and sector, CBRE no longer represented a compelling, contrarian holding for us. With optionality of 0% for the sector, and more compelling opportunities elsewhere, we fully exited our exposure to Real Estate in the quarter. The reduction of 150bps in RE provided opportunity to reallocate elsewhere in the portfolio, notably increased sector weightings in CS and Comm Svcs. At quarter-end, our 0% target weighting in RE represented an underweight of ~-310bps and ~-520bps, compared to the S&P 500 and R1KV, respectively.
- 9. ¹Comments and opinions expressed reflect solely the personal views of Anthony Lombardi as of 3/29/19, and not any other individual or firm. Such views are not a recommendation to buy or sell any security, fund or portfolio. Any investment decision should be made in consultation with a financial advisor. MARCH 2019 INVESTMENT COMMENTARY1 Communication Services: INCREASE Sector weighting +200bps; Deal driven: 7.0%-->9.0% On the heels of the consummation of corporate transactions, we raised our target weight in Comm Svcs sector +200bp. As noted in our December quarterly commentary, prior sector target level provided for significant headroom for increased portfolio allocation based on our allowable process maximum (~15% at the time). We further commented we believed our targeted holdings in Healthcare, Staples, Comm Svcs, along with our Cash allocation, comprising nearly 28% at year-end, provided defensive attributes against our cyclical exposures in the portfolio; and, we had also increasingly nibbled in HC and Staples during 2018 as more compelling, select valuations arose. Our decision to raise our sector weighting was the result of a long-pending transaction that closed during the quarter, involving a holding for which we have owned since inception of our LCV portfolio. As a result of the transaction, two new independently traded companies were created and, in our opinion, both possessed attractive long-term fundamentals and favorable proforma valuation. During ownership of the legacy company, we had rounded down to its portfolio weighting numerous times, as well as having reduced its target position weighting. Upon consummation, we utilized 200bps of available Cash aided by our reduction to RE, and took a 1-company, 400bps target position to a 2-company, 300bps/each target position; thus, raising our Comm Svcs sector weighting +200bps. We like the mix of assets that comprise our Comm Svcs sector, with each of the three business models owned contributing secularly to our overall portfolio in various ways, and with favorable balance sheet and cash flow attributes. Additionally, we continue to believe our allocation provides defensive attributes, as well as leverage to participate in upside, in both the economy and markets. At quarter-end, reflecting the changes made to mix, our target weighting in Comm Svcs represented an underweight of ~-110bps and overweight of ~+210bps, compared to the S&P 500 and R1KV, respectively. Versus the R1KV, this represents the first such overweight since inception. Consumer Staples: INCREASE Sector weighting +100bps; 1 target raised, 1 rebalanced to target: 8.0%-->9.0% For the 3rd consecutive quarter, we raised our target in CS +100bps, and fully allocated the increase to an existing target position, thus raising our CS target weight +400bps during the past three quarters. We had long believed CS to be fundamentally unattractive and overvalued, particularly when viewed in the context of our long- standing bullish view of macroeconomic and corporate profit trends. However, as noted in our September 2018 commentary, we are contrarians, seeking compelling valuations and MOS wherever present. With respect to CS, we remained patient and awaited the pendulum to swing increasingly in our direction, while simultaneously maintaining our high conviction level in more attractive cyclical sectors. Despite three consecutive quarterly increases, it is notable our CS sector target weighting of 9.00% remains below the maximum weighting of ~11% allowed per process, reflective of discipline and our belief that more valuation compression, and/or business model stress is possible. One need not look further than the recent hemorrhage in shares of Kraft Heinz, Conagra and others throughout the sector as proof statement. As we have noted in prior commentaries, CS has been among the most bruised defensive sectors given its representation in the S&P 500 was cut in half during the past decade, falling from 14% to less than 7% in 3Q18. It’s the same degradation that has only now begun presenting some contrarian opportunity, although we remain disciplined and patient. In addition to the most recent increase of +100bps allocated to an existing target position, we also rebalanced another CS holding down to target weighting during 1Q19. Cumulatively, actions taken in the quarter comprised ~120bps of aggregate portfolio market value. Compared to the S&P 500 and R1KV, our portfolio’s target weight allocation for CS at quarter-end was an overweight of ~165bps and ~110bps, respectively.
- 10. ¹Comments and opinions expressed reflect solely the personal views of Anthony Lombardi as of 3/29/19, and not any other individual or firm. Such views are not a recommendation to buy or sell any security, fund or portfolio. Any investment decision should be made in consultation with a financial advisor. MARCH 2019 INVESTMENT COMMENTARY1 Technology: No Sector weighting change; 3 rebalance trades: 20.0% We have been cyclically biased for an extended period, with TECH amongst the most significant sector allocations providing related exposure in our LCV portfolio. During latter part of 2017 and much of 2018 we were active in reallocations and rebalances within TECH given material appreciation in position holdings, all which occurred in the shadow of the broader market’s growth-oriented rally. The fact that we have continued to be active within TECH is not surprising given the sector has been a key market driver and our process forces a natural reallocation amongst portfolio holdings. During 1Q19, with strong rally off December trough, we executed three position rebalances similar in nature to the previous quarter, two down to target, and a third up to target weight. Cumulatively, our activity in the current quarter represented ~125bps of aggregate portfolio market value. At 20.0%, compared to the S&P 500 our portfolio’s target weight allocation for TECH at the end of March was an underweighting of ~-120bps, while a material overweighting of ~1,020bps versus R1KV. Our process compliant maximum weight for TECH was ~32% at quarter-end, providing significant headroom in portfolio exposure should compelling opportunities present. Cons. Discretionary: No Sector weighting change; 2 Rebalance trades to target: 12.5% Along with TECH, IND, and FIN, the CD sector has comprised a significant part of our portfolio’s cyclical bias. As noted in our September 2018 commentary, TECH, TEL, and the CD sector were impacted by the redistribution of market capitalization into the newly created Communications Services Sector. The recasting of CD, TECH and TEL sectors in 3Q18 impacted our Media-related holdings, which transitioned from CD to the new Comm Svcs sector. As was the case in 4Q18, we relied upon compelling valuation and contrarian instincts in seizing opportunity presented to execute rebalance trades in CD, raising two positions up to target weightings. Cumulatively, actions taken in 1Q19 comprised ~115bps of aggregate portfolio market value. At quarter-end, our sector target allocation represented an active overweight of ~+235bps versus the S&P 500 and ~+720bps versus R1KV. As with TECH, our process compliant maximum weight for CD at quarter-end provides headroom for additional portfolio exposure given the upside limit of ~15%. However, we remain quite mindful that AMZN, comprises over 3% of the 10% aggregate market capitalization weighting in the CD sector. Thus, our current CD target weight is quite full when adjusting for this one name. Utilities: No Sector weighting change; 1 Rebalance trade to target: 1.50% As in RE, the UTE sector has clearly benefited from the secular decline in interest rates and historically defensive attributes. Against the backdrop of strong performance for the sector and its (and our lone holding’s) valuation relative to the broader market, we have been mindful in maintaining our current sector weight for UTEs at process minimum 1.50%. In terms of performance, since inception, our target UTE holding has generated total annualized return of 20% through the end of 1Q19, compared to ~11%, ~16% and ~13% for the S&P Utility Sector, S&P 500 and R1KV, respectively. Similar to RE, the UTE sector is near a level that optionality in our process would allow for 0% allocation should both criteria and our fundamental assessment align. Against this backdrop, we executed a modest rebalance down to position target weight during 1Q19. Notably, our last major move in UTEs was a reduction of 150bps in our sector target weight during 4Q17. Compared to the S&P 500 and R1KV, our portfolio’s target weight allocation for UTEs at quarter-end was an overweight of ~-185bps and ~-495bps, respectively.
- 11. ¹Comments and opinions expressed reflect solely the personal views of Anthony Lombardi as of 3/29/19, and not any other individual or firm. Such views are not a recommendation to buy or sell any security, fund or portfolio. Any investment decision should be made in consultation with a financial advisor. MARCH 2019 INVESTMENT COMMENTARY1 Four sectors remain at target allocations of 3.00% or lower Our portfolio currently has four of eleven sectors retaining target weightings of 3.00% or less; Energy (3.00%), Materials (3.00%), Utilities (1.50%) and Real Estate (0.00%). Weightings in all these sectors remain in alignment with our broader investment views, expected backdrop and process discipline and constraints, as well as underscoring our more cyclical bias, despite our having moderated such exposure during 2018 and early 2019. With our radar remained dialed up, our inclination at this point remains one which is more likely to result in further moderation in our cyclical exposure should contrarian opportunities continue to present in traditionally more defensive sectors. Importantly, our fundamental concerns with respect to the Energy sector remain unaltered, and we reiterate our belief the sector to be a quintessential “value trap”. Select fundamental drivers are unlike any other sector. Notably, the S&P 500 Energy weighting at quarter-end was ~5.4%, a level well off the ~15.0% weighting reached 10-years ago; and placing our allowable process maximum for the sector at ~8.2% allocation. The S&P Energy sector would require a market capitalization weight of at least 6% before forcing us to move our allocation higher on a process basis alone. Cash target REDUCED -150bps: 2.50%-->1.00% As noted in our June 2018 commentary, we believed building cash level an appealing position heading into 3Q18. During 4Q17, 1Q18 and 2Q18, such actions led to consecutively higher portfolio liquidity at the end of each period but in the context of no target weight change to cash. In 3Q18, however, we made an active decision to increase our portfolio’s cash target +100bps, to 2.50% from 1.50%. During 4Q18 we maintained our target at 2.50%, against market value cash running slightly higher. From a market value perspective, our Cash level was 1.0% at quarter-end, versus 3.1% at the end of December. Market and Economic Backdrop Since inception, we have repeatedly underscored our belief that a good amount of operating leverage existed that could be readily monetized for the benefit of shareholders/consumers should top-line revenue (& GDP) growth move sustainably higher; a dynamic that clearly played out and became consensus over time. However, our vigilance works both ways and, as indicated in our commentaries during 2018, our radar had been increasingly dialed up: “should macro-related conditions deteriorate, or it become(s) increasingly difficult to discover new compelling opportunities; valuation characteristics, balance sheet and/or cash flow attributes become more challenging, we will change course per process discipline.” Process, opportunities and MOS will always be our guide, which our ongoing allocation and rebalance actions reflect. For much of this elongated recovery, the broader US equity market has been able to absorb a multitude of events, to include the ongoing political landscape at home; political investigations; technology data/privacy concerns; geopolitical tensions and events around the world, to include increasing crystallization on trade and tariffs; ongoing developments in North Korea; Brexit chaos; a fluctuating dollar; spiking market volatility; constant oil price reversals; hemorrhage in Emerging Markets; improving economic data at home; rising corporate board governance issues; terrorist and civilian-based societal attacks; new Fed Chairman and mix on FOMC; prospects for the speed of continued normalization of monetary policy through rate and balance sheet actions; related pivots and patience. More recently, volatility, pessimism and negative headlines arose like the Phoenix in the fourth quarter, driving a notable market sell-off, and the bifurcation of performance across investment styles and regions that had remained status quo witnessed a notable breakdown. We remained
- 12. ¹Comments and opinions expressed reflect solely the personal views of Anthony Lombardi as of 3/29/19, and not any other individual or firm. Such views are not a recommendation to buy or sell any security, fund or portfolio. Any investment decision should be made in consultation with a financial advisor. MARCH 2019 INVESTMENT COMMENTARY1 unsurprised by the pendulum action in the market, particularly in lieu of monetary and fiscal backdrops, geopolitical tensions, increased volatility and underlying emotional swings. As noted in our March 2018 commentary, we expected the style-shifting dynamic to have the potential to remain an underlying pillar during 2018, which would also align well against our investment process. As we stated in our December commentary, given the unraveling and unnerving that occurred in 4Q18, we expected this trend would continue in 2019-2020. The strong market rebound witnessed during 1Q18 fit neatly into these expectations, yet we maintained and focused upon our process discipline. With our typical investment horizon of 3-5 years, as outlined in prior commentary, we continue to believe we are looking forward squarely into a period that will likely have data points and fundamental developments serving to impact the underlying mosaic, resulting in higher levels of emphasis on MOS. Against this backdrop, we will continue to seek and seize upon opportunities while our radar remains dialed up. S&P 500 performance strongest since 2Q09, with 13.7% total return; Growth > Value & EM hangover clearing. The mix shift away from cyclical areas that accelerated during 4Q18 and resulting in a broad, aggressive market sell-off, made a violent swing back towards beta in the first quarter. The result: after one of the weakest quarters in a decade, the S&P 500 posted one of the strongest quarters in a decade. Specifically, the broader market’s +13.7% total return was the best since the back-to-back total return performance of +15.9% and +15.1% in 2Q09 and 3Q09, respectively. By sector, the market was paced by Technology, Real Estate, Industrials and Energy which posted total returns of +19.9%, +17.5%, +17.2% and +16.4%, respectively. While there were no sectors in the red, left well in the dust was Healthcare which generated the weakest performance at +6.6%. The one cyclical sector that stood out as having a poor showing was Financials where the “pivot to patience” by the Fed, and concerns about inverted yield curve, served to suppress total return of +8.5%. Growth (as measured by Russell 1000 Growth Index—R1KG) posted a +16.1% total return, meaningfully outperforming Value by ~+415bps. As noted above, Emerging Markets (as measured by MSCI EM index) finally reached a cleansing point and broke out of a negative funk, posting a +9.9% total return. Although a positive performance quarter, EM’s rolling 1- year total return remains underwater, as well as ~1,970bps below Growth, a sizeable swing from its ~400bps rolling 1-year advantage at the end of 2Q17. Similarly, Value has also retained its significant edge over EM due to the depth and length of EM’s underperformance, swinging from a rolling 1-yr deficit of -1,825bps at end of 1Q18 to a favorable ~+1,265bps differential at end of 1Q19. As to U.S. interest rates and spreads, despite the latest “pivot to patience” by the Fed and corresponding action in long rates, our secular view has not changed. Specifically, we have long maintained that an extended path lower ended several quarters ago—a view, at the time, founded upon broad expectations for improved economic growth, higher (but not runaway) inflation, and changes in monetary (tighter) and fiscal (expansionary) policy. We have also not shared the market’s concerns regarding short-end curve pressure and/or potential inversion, and further believe such concerns will alleviate over subsequent quarters---despite the 4Q18 sell off in the equity markets, and subsequent 1Q19 decline in long-term treasury yields, we have not altered this view. From just plain bad all around, to better, as global markets (total returns $USD) participated in recovery but with a return of bifurcation across geographic theaters, a theme in the backdrop for some time: China +38.0% vs (-12.1% 4Q18), Hong Kong +12.6% (vs -6.8% 4Q18), Swiss +12.5% (vs -8.0% 4Q18), Australia +12.4% (vs -11.1% 4Q18), UK +11.6% (vs -11.6% 4Q18), France +11.1% (vs -14.7% 4Q18), India +8.0% (vs +3.7% 4Q18), Germany +7.8% (vs -15.1% 4Q18), Japan +7.0%( vs-14.6% 4Q18), Mexico +5.4% (vs -19.6% 4Q18) and Brazil +2.5% (vs
- 13. ¹Comments and opinions expressed reflect solely the personal views of Anthony Lombardi as of 3/29/19, and not any other individual or firm. Such views are not a recommendation to buy or sell any security, fund or portfolio. Any investment decision should be made in consultation with a financial advisor. MARCH 2019 INVESTMENT COMMENTARY1 15.0% 4Q18). For the quarter, the S&P 500 posted a +13.1% price increase, below the performance of the R1KG at +15.7% but comparatively stronger than the R1KV at +11.2%. With respect to domestic markets, Technology, Financials, Communication Services and Consumer Discretionary drove a large part of the positive attribution of Growth over Value. By far, Energy was the most significant detractor for Growth vs Value, with very modest drags from Staples and Real Estate. As we noted in our prior commentaries, when comparing Growth vs Value, any performance differential will likely be driven, principally, by four sectors. Specifically, the most significant positive weighting differentials between Growth and Value at quarter-end remained Technology and Consumer Discretionary, while the most significant underweights were Financials and Energy. Between Growth and Value, Utilities continue to close the weighting gap differential to Energy. Specifically, the continued decline in Energy market capitalization, and underlying strength in Utilities has resulted in a ~645bps positive differential in Value vs Growth weighting, nearing the ~895bps differential for Energy. 10-yr yield ranged 2.37% to 2.79%; plummet from 7-yr high to close near low for quarter. Notably, the bottom end of the range, which came near quarter-end, represented a near 90bps decline from November 2018 peak, which was a 7-year high. For the quarter, the 10-yr traversed a 42bps range, hitting an early-quarter high of 2.79%, 2 weeks ahead of the January FOMC “pivot-to-patience” meeting. Combined with follow-up congressional testimony by Chairman Powell, public comments by Fed officials and a trail of global economic data, long-term yields moved meaningfully lower through quarter-end, against the backdrop of a broad equity market rally. Despite the dramatic shift since November, the close at quarter-end was at the same level as 4Q17 and 4Q16. We remain steadfast in our previous comments, notably: “the 10-yr has not only managed to hold its initial spike during first few days following the 2016 US Presidential election but has clearly been reacting more dynamically to various macroeconomic, fiscal and geopolitical factors. We believe this action will continue, albeit not in perfect linear fashion.” Against this dynamic rate backdrop and timeframe, major US equity indices have been able to power to numerous record all-time highs, across several broader benchmarks. While this was not the case during 4Q18 as heightened fears of Fed policy error metastasized against the backdrop of a potential slowdown and/or fears of a recession, the powerful rally registered in 1Q19 put the S&P 500 within less than 5% of a new all-time high. 10-Yr Qtr-End 4Q15: 2.27% 2Q16: 1.47% 4Q16: 2.45% 2Q17: 2.31% 4Q17: 2.41% 2Q18: 2.86% 3Q18: 3.06% 4Q18: 2.69% 1Q19: 2.41% Yield curve slope melts; we reiterate we are mindful but it’s still not a primary concern. As we have noted in prior commentaries, while aware of potential curve inversion, our focus remains upon aggregate interest rate levels, cash flow, balance sheet dynamics, capital allocation and margin trends. Neither the slope of the curve, or it’s dynamics, at this juncture is a primary concern for us in this regard. Far be it from us to be Pollyanna, as
- 14. ¹Comments and opinions expressed reflect solely the personal views of Anthony Lombardi as of 3/29/19, and not any other individual or firm. Such views are not a recommendation to buy or sell any security, fund or portfolio. Any investment decision should be made in consultation with a financial advisor. MARCH 2019 INVESTMENT COMMENTARY1 our radar has been dialed up for several quarters, and we have highlighted ongoing adjustments in our portfolio positioning. Should an inversion pan out and is a function of, or related to, a deterioration in fundamentals, that would cause us to make further adjustments in our thinking and positioning. At the current time, we like the portfolio opportunities we have targeted, as well as the pace at which we have made changes. Across the term structure of the yield curve there are modestly different dynamics, but generally there has been a broad melting of upward slope. Thus, there has been a notable change in the backdrop for which markets have reacted. Pertaining to the 1yr-10yr spread level, it has remained well below the ~200bps average over the past 10-years and has fully evaporated over the past three years. Specifically, the 1yr-10yr differential expanded to ~165bps at year-end 2016, the spread compressed notably during 2017 to ~65bps by year-end ‘17, to 9bps at year-end ’18 and 2bps at the end of 1Q19. At the 2yr-5yr term structure, there was a modest inversion during December 2018, which deepened further to ~10bps during 1Q19. Since late 1992, the average spread in the 2yr-5yr has been ~60bps, and it has experienced 3 prior inversions during this timeframe averaging -14bps. As depicted below, at the 2yr-10yr term structure, there was still a modest 15bps of positive slope in the curve at the end of 1Q19, a level that compares to the 2010 peak of 281bps. Over the 40+ years depicted, the average slope in the 2yr-10yr has been ~93bps. There have been 4 notable inversion periods in this term structure, with each followed by a recession and each with successively lower absolute levels in the 10yr yield. Of the four inversion periods, the most severe occurred in the late ‘70’s-early ‘80’s, owing to the massive swings in volatility, the absolute level of interest rates (and inflation, oil prices, etc), the extraordinary duration of the inversion and the duration and deepness of the subsequent recession(s), which stretched from 1980-1982. It’s a time period we remember living through quite clearly. What gives us comfort as it relates to the current time period, is the low absolute level of interest rates, low level of inflation, employment & aggregate growth trends, the strong cash/balance sheet positions of companies in the aggregate, strong capital and liquidity position of banks, credit spreads that have not bubbled up to any of the extremes in prior cycles, ongoing expense/margin focus of management teams, the US’s more favorable position relative to other countries/markets (Developed & Emerging) and a Fed that has hit the pause button. It’s these fundamentals that we will continue to monitor for any degradation, as well as any sustainable impacts from ongoing trade-related policies and negotiations. Source: Bloomberg
- 15. ¹Comments and opinions expressed reflect solely the personal views of Anthony Lombardi as of 3/29/19, and not any other individual or firm. Such views are not a recommendation to buy or sell any security, fund or portfolio. Any investment decision should be made in consultation with a financial advisor. MARCH 2019 INVESTMENT COMMENTARY1 The acceleration in slope compression during the past 2 years has largely been driven by a rising short-end and, until recently, modest pressure on the long-end. Nearly all the compression in spread from mid-November to 1Q19-end was due to the long-end declining. In our opinion, the short-end driven phase of compression has been a function of anticipated and actual Fed action, alleviated concerns regarding a stalled Fiscal agenda, and firming economic data juxtaposed against well-contained inflation. The more recent long-end driven phase of the compression has been a function of the market assuming the Fed was implementing restrictive policy too quickly without pausing for a temperature check on the patient. Given the backdrop and our expectations, we remain of the belief that a potential reversion to mean (slope) is more likely to be driven by a rise in the long- end of curve than a short-end decline, implying a 10-yr climbing near 4.00% over time. Such a rise could be aided by balance sheet actions of the FOMC, whereby a mix shift could be executed by selling longer-dated maturities and buying short (to intermediate) maturities. While we don’t assign a high probability to monetary policy in which the Fed cuts rates, we would note that, overnight, the Fed could easily (pivot once again) restore positive slope in the curve if it were inclined by its internal forecasts. It’s all about expectations. Despite near-term volatility, and perceptions on communication and/or potential miscommunication that can occur under a new Fed Chairman and members of the policy-making committee, we continue to believe data dependency will remain among the foundational pillars of monetary policy. For us, our thinking has not changed, in fact it has solidified, given we feel our expectations played out in the prior quarter. As we have highlighted in past: “As previously noted, we are 10 years out from the global financial crisis, and on more stable economic ground, with improved conditions for corporate and consumer fundamentals. At this stage of the domestic economic, monetary and fiscal policy cycles, we remain less focused upon unit count of rate increases anticipated by the market and more biased to the level of potential rate changes, and the corresponding impact such step-changes could serve to vastly exceed market expectations….we would not be surprised to see a more fluid pace of change regarding monetary policy should situations warrant….and/or more action steps than currently discounted by the market.” To us, the market had an epiphany during 4Q18 and finally realized there was potential the Fed chair might indeed be leading the FOMC on a more rapid path to policy normalization (via combination of rates and/or balance sheet) than was generally assumed by consensus. As a result, expectations required adjustment as consensus was clearly surprised by the magnitude of the gap between potential and actual. During 1Q19, it was the Fed who had an epiphany, deciding to pivot, pause and be patient. We believe our comments last quarter server to underscore such change and our investment philosophy and discipline: “Whether rate and balance sheet policy previously anticipated by the FOMC remain on course or are altered in some fashion based upon financial market signals, the wake-up call in 4Q18 on its own had value as a discount mechanism. As noted previously, a market with a swinging pendulum, rife with emotion, fits neatly into our process” The accelerated compression, and inversion at certain term structures, in the yield curve highlighted above is just one example of more fluid changes in the backdrop versus a stale dynamic the market had been previously accustomed during much of the 10-year recovery. So too has been the related rise in equity market volatility whereby 2018-2019 have witnessed more severity than 2016-2017. Going forward, our expectations remain the same. Specifically, magnitude of changes in policy are expected to be justified by the macroeconomic backdrop—the latter which we have been positively disposed for some time and are expected to continue driving interest rate movements and broader policy agenda over the intermediate and long-term. As noted
- 16. ¹Comments and opinions expressed reflect solely the personal views of Anthony Lombardi as of 3/29/19, and not any other individual or firm. Such views are not a recommendation to buy or sell any security, fund or portfolio. Any investment decision should be made in consultation with a financial advisor. MARCH 2019 INVESTMENT COMMENTARY1 above, the underlying mosaic and interplay of Fed leadership, economic data points (domestic and international), Fiscal policy agenda and spending discipline, corporate balance sheet and profit trends will continue to be monitored. Secondary to these forces will be any longer-term impacts of sustained trade tariffs/negotiations across individual market sectors, which may, or may not change primary variables in the economic and business profit equations. Changes in capital allocations and management priorities remain key front-burners, playing out as expected. Our expectations remain for corporate actions that lead to a re-ranking of capital management priorities given a more a favorable tax code, increasing deregulation, improving economic activity and executive management confidence, along with a corresponding increase in capital and human resource investments. While such changes could have negative implications for the level and/or pace of share repurchases and dividend increases witnessed during the earlier stages of recovery since the financial crisis, they also vary by sector. Continued strong underlying performance of the stock market and simple mathematics suggest lower marginal buying power of previously approved, and remaining buyback authorizations. Still further yet, Finance 101 suggests higher valuation multiples present as less appetizing to corporate CFO’s and treasurers, acting as an incremental constraint to share buybacks. Intermittent periods such as the broad decline in 4Q18, across market capitalizations and sectors, may present valuation multiples that are more appetizing for buyback activity. That said, we reiterate that with large repatriations of internationally domiciled cash, the possibility exists that some companies may still deploy part of this dry powder into “high multiple” buybacks. Technology is where a lot of liquidity resides, with several companies boasting cash-rich balance sheets. As alluded in prior commentaries, one caveat with respect to Technology sector is the new potential risks and opportunities related to data security/privacy require monitoring within the Technology sector that may increasingly cause redirection of cash for investment and/regulatory purposes. Material change to business models, particularly expectation for long term future growth and margins, will be notable to monitor, no matter the sector or company. As is typically the case, earnings and free cash flow generation will serve as key drivers of the ultimate determinant of capital allocation across sectors and industries, led by the respective fundamental backdrops of each. More recent political winds stirring the idea of putting the hand of government into the capital allocation pot we find to be speculative drama, versus leading to actual restriction. M&A and IPOs. Deal appetite spanning sectors and geographies continues to reflect high confidence of management and boards to take on risk and allocate capital. Among the more notable M&A announcements in 1Q19 were: Bristol-Myers/Celgene ($89 bil stock/cash), Saudi Arabian Oil Co/Saudi Basic Industries (public fund purchase, $69 bil cash), Fidelity National Info Svcs/Worldpay ($41 bil stock/cash), Fiserv/First Data ($38 bil stock), BB&T Corp/SunTrust ($28 bil stock), Danaher/GE BioPharma business ($21 bil cash/debt), Centene/Wellcare Health ($14 bil stock/cash), and Newmont Mining/Goldcorp ($13 bil stock/cash). Certainly, the wide mix of sectors involved for the quarter, including the first major bank deal in some time, were key highlights. But perhaps the return of the IPO market was amongst the most notable news items in backdrop of 1Q19, headlined by new and old. Lyft and Levi’s successfully issued shares in what is believed to be a foundation to an IPO calendar that is expected to generate ~$1 trillion of new market value during 2019. Amongst the expected parade to come: Uber, Airbnb, Slack, Pinterest and WeWork.
- 17. ¹Comments and opinions expressed reflect solely the personal views of Anthony Lombardi as of 3/29/19, and not any other individual or firm. Such views are not a recommendation to buy or sell any security, fund or portfolio. Any investment decision should be made in consultation with a financial advisor. MARCH 2019 INVESTMENT COMMENTARY1 Volatility pivoted, along with Fed, rates and the market rally. As was the case with long rates and market investment returns, volatility in 1Q19 was the inverse of 4Q18, largely owing to the Fed’s “pivot to patience” which served to calm the beast (for now). During the past 12-18 months notable developments in the backdrop have included the strong market rebound in 1Q19 following a hemorrhage experienced late in 4Q18, equity indices hitting multiple new highs, a powerful rally from a material decline in 1Q18, US equity markets managing through a maze of ongoing trade/tariffs scenarios, mid-term congressional elections that tilted left, political investigations/divisiveness, government shut-down and reopen, rising and falling interest rates including partial inversion of term structure, record low unemployment rate, wage-inflation scares, GDP ticking 4% and 2%, and waters remaining calm around North Korea. As measured by the CBOE (VIX), market volatility book-ended 2018 with higher levels at the front and back-end, while relatively subdued between 2Q18-3Q18. In 4Q18, the VIX spiked to a high of 36 in late December, having closed 3Q18 at 12.1—although the 4Q18 spike was below the peak reached in 1Q18. In 1Q19, the VIX spent the entirety of the quarter falling from a high of ~26 very early in the period to a low of ~13, before closing at ~14. As we have noted previously, since 1990, a year marked by the precipice of a multiyear financial crisis (and recession) involving S&L’s and commercial banks, the low mark on the VIX has been ~9, and the average, ~19. Interestingly, the average level for the VIX actually declines, to ~15, when the time horizon is narrowed to just 2016-forward--a period that includes a February 2018 spike (to 37), an immediate, post-UK “Brexit” vote increase in late June 2016 (to ~26), the November 2016 spike (~23) after the U.S presidential election and the most recent 4Q18 spike. During the current 10-year equity bull market, there have been only 5 periods in which the VIX spiked above 40, a level not breached by the 4Q18 market tantrum. In fact, the VIX had been relatively well-contained against ongoing prior FOMC decisions; confirmation of a (then) new Fed Chair, intra-meeting commentary regarding rate/balance sheet policy; swirling, divisive and emotional political winds blowing in Washington, tax legislation/enactment and reduced regulation, geopolitical events including trade/tariffs & disruptions across the globe, intermittent sell-offs in Tech (long the market’s anchor tenant), speculative swings in crypto currencies, cannabis plays and the recent return of the IPO market. Dollar trended modestly higher for the quarter, adding to its prior gains. Given the confluence of global events, relative strength of the U.S. economic backdrop, and perceived safety of U.S. capital markets, we have long been of the view that an overly dire outcome for the US Dollar will remain an unlikely scenario in the near-to- intermediate term. As noted in our March 2018 commentary, implications of any potentially sustained trade- related changes due to tariffs, negative or positive, certainly bears monitoring. For the quarter, the Dollar index (DXY) climbed over 1%, having made intra-quarter gains of 2%, reflecting in part, continued undercurrents in DC related to monetary, fiscal and trade-related policy, lower interest rates abroad, and flight to safety from regions outside the US. The Dollar’s strength has had negative impacts on several Emerging Markets during its continued run higher, some which remain under financial duress. For the rolling 1-year, the Dollar index posted an 8%+ rise to 97.3. As noted in prior comments, the DXY remains well-above financial crisis lows of ~70 reached in 1Q08 and is now only ~6% off its 10-year high of ~103 in 1Q17. Gold safety good for another 1%; Oil continues slushing around. As measure from 1Q14, Gold’s 5-year high was nearly $1,385, reached late in 1Q14. The metal has tended to catch bids on renewed fears and heightened volatility in other asset classes. During 1Q19 Gold built upon its +8% increase in 4Q18, rising as much as ~+5% intra-quarter before closing +1% at the close. Gold’s rise occurred against a backdrop of the Fed’s pivot, continued Dollar strength and the VIX settling down from its massive spike in 4Q18. Like it has in the past,
- 18. ¹Comments and opinions expressed reflect solely the personal views of Anthony Lombardi as of 3/29/19, and not any other individual or firm. Such views are not a recommendation to buy or sell any security, fund or portfolio. Any investment decision should be made in consultation with a financial advisor. MARCH 2019 INVESTMENT COMMENTARY1 following nearly 40% decline in 4Q18, oil’s performance rebounded in the quarter with the front-end contract for WTI finishing up nearly 33%, closing at $60.14. As crude failed to fully recapture the $73 price level at which it exited 3Q18, the commodity still sits nearly 45% below its 5-year high (June 2014). As we noted in our September commentary, outages, logistic constraints and sanction-related constraints clearly had an impact on crude’s short-term move higher during 2018 but was not something for which we would peg any long-term modeling. Beyond risks and concerns we have previously highlighted with respect to inventories, technological benefits and change, potential production cut slippage amongst OPEC, and production triggers being pulled by U.S. producers, a further constraint on materially higher price levels is potential headwinds to economic growth that could metastasize with such a corresponding rise in WTI. Against this backdrop we have remained steadfast in our long-term pessimistic view, particularly for the Energy equity sector. As evident in our 300bp reduction in sector allocation during 2017-18 and Energy’s modest ~5% S&P 500 market capitalization representation, we remain in no rush to add portfolio exposure to a sector where process limits our maximum allocation to ~8%, and compelling opportunities exist elsewhere without the risks of certain oligopolistic variables. 4Q18 Real GDP +3.0% (y/y) and +2.2% (q/q); 1Q19E: +2.9% y/y, +1.5% q/q. Versus FY 2018, forward estimates for FY 2019 and 2020 are currently +2.4% and +1.9%, respectively, stable vs 90 days prior. Initial estimates for 2021 call for a continuing slowing of +1.8%. The slowing in 2020 is driven by a combination of Consumer and Government spending, while 2021 is more heavily tilted to Government spending slowdown. A major infrastructure initiative, if passed, could serve to alter estimates. We have repeatedly highlighted the underlying strength of the employment backdrop, which has yet to crack based on latest hiring trends and record low jobless claims. Versus crisis level losses of ~900k/month in 2008-09, the labor market has witnessed continued improvement, generally posting nonfarm payroll gains of ~150k-300k/month since 2013, with the March print (for Feb figures) coming in at an anomalous 20k due to a variety of policy uncertainties during 1Q19. That said, we don’t totally dismiss the figure due to economic data points in the US, and globally, that illustrated some weakness during the quarter. Forward median forecasted payroll gains for 2019-2021 are in a range of ~120k- 165k/month, levels which have witnessed continued stability and upside trajectory as we expected. The unemployment rate has leveled at 2-decade low, equal to the April 2000 rate, as well as remaining at post- recession lows of 3.8%, having declined 600 bps from its previous peak. Estimates for 2019 and 2020 have remained at these lower levels and currently stand at 3.7% and 3.6%, respectively, with expectations of a rise to 4.0% in 2021. As noted in prior commentaries, acceleration in aggregate economic growth had long-proved difficult despite an improving labor market backdrop. However, 2017’s breach above 3% (Q/Q) real GDP was a notable change which we called-out, a level which came without fiscal policy injection at the time. Given subsequent enactment of tax legislation and corresponding response by companies regarding capital management and resource plans, the underlying traction and lift in GDP that followed was surprising. The latest shift in the data marking some slowdown, the pivot by the Fed, and ongoing trade policy negotiations and bipartisanship at home will all be variables in the mosaic that bear watching for any sustained level of degradation in growth—in line with our radar being up and our desensitizing some cyclicality in the portfolio. Despite the market’s spastic convulsions over the past couple quarters, we would reiterate FOMC commentary has continually underscored policy maker’s data dependency, including viewing through a global lense with eyes (peripherally) on more than just U.S. economic conditions. To this end, trade-related developments will certainly be scrutinized for any longer-term impacts that materially impact anticipated
- 19. ¹Comments and opinions expressed reflect solely the personal views of Anthony Lombardi as of 3/29/19, and not any other individual or firm. Such views are not a recommendation to buy or sell any security, fund or portfolio. Any investment decision should be made in consultation with a financial advisor. MARCH 2019 INVESTMENT COMMENTARY1 trajectory in growth and inflation, both within the care and custody of the FOMC. We have repeatedly stated, monitoring price and wage inflation metrics remains at the forefront for us given the extended period for which global monetary stimulants have existed, and when combined with injected Fiscal accelerants. Despite occasional soft spots in economic data, we have been steadfast that aggregate growth, wage and price pressure would continue to warm. However, inflation still bears the most burden versus history given increasing number of business models founded upon low-cost and/or price competition, a trend indirectly referenced by the Fed Chairman in early 2018 when alluding to the Phillips curve having broken down relative to historical relationships. Specifically, many new business concepts successfully introduced within the past decade or two, have been premised upon high-volume low-margin strategies, where price points and distribution are key competitive differentiators. Tax policy and subsequent corporate actions that led to bonus compensation, wage and hiring increases, and capital/resource investments suggest, however, that operating costs may have reached the point of headwind status, and serve to detract from incremental operating leverage, placing critical focus on monitoring margin trends. This continues to be where we see some of the more notable risks to the near-to- intermediate backdrop---a higher probability of moderating earnings growth via declining operating leverage, NOT an outright or severely deep economic recession. Our portfolio positioning actions during the past year have been mindful of this risk. Monitor the degree of offsets to tailwinds in the Five and Dime earnings picture remains paramount. Heading into 1Q19 earnings season, based on FactSet data, aggregate S&P 500 EPS on a reported basis are estimated to post a year/year decrease of ~-4%, versus +20% gains posted for FY18, and lower than the +13% reported gain in 4Q18. Compared to December 31st, estimated 1Q19 earnings growth for the S&P 500 has declined over 700bps from the +3% growth originally projected and continues a downtick trend from the massive jump in expectations witnessed heading into 2018. This is now the third consecutive quarter in which estimates reverted to a typical trend of heading lower during a quarter. Recent trajectories during past earnings seasons, leading into reports, had increased due to a combination of lower cuts by analysts, enacted tax legislation, regulatory climate, a reduced level of negative guidance by companies, and generally easing comps in the more pressured sectors. Prior to tax legislation, some of the easier comps were previously expected to fade but were pushed out due to the tax-related tailwind, serving to help spur momentum on the top and bottom line. Top-line 1Q19 revenue growth forecasts of +4.8% have also declined nearly 200bps vs estimates at the end of 4Q18, implying material negative operating leverage. Furthermore, the current 1Q19 revenue estimate represents a sequential decline from the +7.2%, +9.2% and +10.1% revenue gains in 4Q18, 3Q18 and 2Q18, respectively. We have had a long-held bullish view on corporate fundamentals but have been slowly pulling our horns in during past 12 months. While aggregate profit margins implied in current forecasts, and overall condition of balance sheets continue to be factors helping to reinforce this positive stance, we have clearly been mindful of offsets to tailwinds in the broader earnings picture. Basic math of the market has supported the margin trajectory given the underlying mix and weighting of high-level sector contributors, notably Technology, representing 21% of S&P 500 market cap. As called out in 3Q18, however, post the index reconstitution, TECH is ~500 bps below its representation at quarter-end June 2018 despite 1Q19’s strong growth rally. Conversely, Energy sector’s weighting has been materially compressed over the course of the past few years and currently represents ~5% of S&P 500 market cap but has transitioned from the precipice of negative comparisons. Notably, Energy earnings and revenue growth for FY18 were ~+112% and ~ +18%, but for FY19, the sector is expected to
- 20. ¹Comments and opinions expressed reflect solely the personal views of Anthony Lombardi as of 3/29/19, and not any other individual or firm. Such views are not a recommendation to buy or sell any security, fund or portfolio. Any investment decision should be made in consultation with a financial advisor. MARCH 2019 INVESTMENT COMMENTARY1 be fully out of the “anomaly” period, as estimated earnings and revenue growth dials down to DECLINES of -12% and -5%, respectively; levels well BELOW the broader S&P 500. Outside of Technology, Healthcare and Financials are near equals (14.6% & 12.7%) in market cap representation, with three additional sectors at ~9%-10% weights. Most notable within Financials, we continue to believe the banks have a favorable runway with green lights on capital plans, strong credit, a strong and/or expanding economy, prospect for rising interest rates, ability to manage the term structure of rates, reduced regulation as well as the tailwind of lower tax burden and generally domestic-centric business models. Consolidation is a wildcard. With Tech, Healthcare, Financials and Communication Services now comprising ~60% of the S&P market cap; Consumer Staples having absorbed material degradation in revenue, earnings and sentiment; additional tailwind of lower corporate taxes fully embedded in estimates; it had appeared revenue and earnings were reasonably well-anchored in the near- to intermediate-term, with some incremental support potentially coming from potential resolution of geopolitical issues. That said, the current rate of growth for FY19 is premised on a quarterly hockey stick trajectory, and due to negative expectations in 1Q19 is only at mid-single digits for the year. Should earnings decline in 1Q19 as expected, it will represent the 1st quarter in 11 for which there was a negative year-over-year comparison. On a reported earnings basis, only 4 of 11 sectors are expected to be in positive territory for the quarter, led by Utilities, Healthcare, Real Estate and Industrials. Not one sector is estimated to post double-digit gains, which had been more typical throughout 2018. Technology, Materials and Energy are expected to be among the weakest, with clearly the most attention being on TECH due to its 21% sector representation. Energy’s renewed fallout, despite only 5% market weight, will garner a spotlight as well. Degradation in the earnings outlook for FY2019 vs December forecasts places current estimates for top-line growth at ~5% (vs 6%) and earnings growth of ~4% (vs ~7%), while FY20 is holding at ~6% and ~12%, around the levels which we have affectionately called a “Five & Dime” market backdrop (5% top and 10% bottom-line growth). As noted in prior commentaries, enacted tax legislation initially generated some spare change, or cushion, against the original baseline sans tax. As quarters and fundamentals have rolled forward, however, the cushion and tailwinds have clearly thinned—there is no more cushion or tailwind. By sector, the earnings picture has once again become more bifurcated, with Industrials and Energy currently at the extreme tails of expectations for FY19. Unlike in prior quarters, these are not immaterial sectors in market capitalization. With wider and more volatile distribution of earnings expectations across sectors, and with Technology revenue/earnings growth estimates below the aggregate index, the relevancy of monitoring all sectors has taken on increased importance. All else constant, we believe the basic math of the market’s forward P/E suggests, given the most recent rally, it has adjusted to a more rich valuation based upon the underlying sector mix, macro concerns and lower (discount) rate environment: Technology sector’s high profit margins and historically higher growth will be more closely examined at 18x; the Financial sector trading at ~11x forward EPS appears to be discounting a flat to inverted curve; the benefit of cyclical tailwinds have played-out within Industrials and Consumer Discretionary; and Energy having witness another earnings cut again trades above the market average at 18x forward, having compressed to 14x forward estimates in prior quarter. As previously noted, with revenue and earnings moderation, profit margins in the aggregate, and by sector, will remain critical to monitor in the current and subsequent quarters. We believe this to be a key determinant of the market’s ability to sustain and hit record levels or succumb to further downside and/or be subjected to higher levels of volatility. As an active, and concentrated, LCV manager, we will continue our opportunistic pursuit, and do so against what we envision in the unfolding 3- to 5-year time horizon.
- 21. ¹Comments and opinions expressed reflect solely the personal views of Anthony Lombardi as of 3/29/19, and not any other individual or firm. Such views are not a recommendation to buy or sell any security, fund or portfolio. Any investment decision should be made in consultation with a financial advisor. MARCH 2019 INVESTMENT COMMENTARY1 Bottom line: As contrarians, we have been attracted to many facets in the backdrop noted above, particularly those that underscore the fundamental and emotional swings that are part of any natural market environment. It is the short-to-intermediate term fluctuations which provide the right backdrop for us to position our portfolio for the long-term at both the sector and security level. While we have repeatedly noted selective areas of the market as expensive, many of the cyclical areas within our value-based discipline, have presented as quite compelling to us for quite some time. If one simply places on blinders, and focuses on the aggregate level of the market, to include broader market earnings growth, valuation metrics, GDP growth, and nominal debt levels the backdrop might have been viewed challenging. We always prefer to go deeper, into sectors and individual stocks, assess related fundamentals and metrics, place broader macroeconomic measures such as GDP growth into context, and break apart aggregate metrics such as debt into more relevant measures such as net debt, interest costs and service coverage ratios, etc. In so doing, we have been quite bullish as to the opportunity set in our concentrated yet diversified large cap value strategy. That is not to say the opportunity set would be the same for other investors in different or less-concentrated strategies. As long-term investors, we remain focused on executing a consistent process, buying cheapness and not over-paying for quality. As disciplined contrarians, mindful of capital protection, we have long found the cyclical sectors, ex-energy/commodities, home to stocks with the most compelling valuations relative to the broader market. Given our contrarian nature, we are also cognizant of consensus having moved in our direction, although much of the change was back-end loaded post 2016 US elections, and not universal across the macroeconomic, sector or individual stock landscape. Nevertheless, we have grown increasingly sensitive to the shifts that have occurred, for which our portfolio decisions have reflected. With our radar dialed up for changes that cause swings in the pendulum too far in any one direction, we have made it a point to take actions during the past several quarters to solidify cheapness in our portfolio and be protective of capital. We are not married to any stock or sector, as our increased exposure to Staples, Healthcare, Communication Services and Cash, and reduced allocations to Technology, Industrials, Consumer Discretionary, Energy and Real Estate indicate. This is a transparent exercise and can clearly be seen in the valuation characteristics of our LCV portfolio as compared to the broader market, our key benchmark (R1KV) and the entire LCV equity peer group. Conviction is key for us and is reflected in our portfolio actions. Most importantly, with any company, it is those possessing characteristics strong in balance sheet and free-cash flow, combined with compelling equity valuation, that garner our attention--these remain the type of roommates we prefer when seeking opportunity and MOS. AAL Document is meant to be used in its entirety. Reference to prior quarterly and monthly publications is noted. Views expressed represent personal assessment of privately managed separate account and market environment as of the date indicated, and should not be considered a recommendation to buy, hold or sell any security, and should not be relied on as research or investment advice. Information is as of the date indicated and subject to change. All market and other related information relied upon and mentioned is from market data sources viewed as reliable. No guarantees are made regarding accuracy. Index returns are for illustrative purposes only. Index performance returns do not reflect any management fees, transaction costs or expenses. Indexes are unmanaged, and one cannot invest directly in an index. Past performance does not guarantee future results. The S&P 500 Index measures the performance of 500 mostly large-cap stocks weighted by market value and is often used to represent performance of the U.S. Stock market. The Russell 1000 Value Index measures the performance of the large-cap value segment of the U.S. equity universe. It includes those Russell 1000 companies with lower price-to-book ratios and lower forecasted growth values. The Russell 1000 Growth Index measures the performance of the large-
- 22. ¹Comments and opinions expressed reflect solely the personal views of Anthony Lombardi as of 3/29/19, and not any other individual or firm. Such views are not a recommendation to buy or sell any security, fund or portfolio. Any investment decision should be made in consultation with a financial advisor. MARCH 2019 INVESTMENT COMMENTARY1 cap growth segment of the U.S. equity universe. It includes those Russell 1000 companies with higher price-to-book ratios and higher forecasted growth values. Russell Investment Group is the source and owner of the trademarks, service marks, and copyrights related to the Russell Indexes. Russell® is a trademark of the Russell Investment Group. iShares® Funds are distributed by BlackRock Investments, LLC. The iShares Funds are not sponsored, endorsed, issued, sold or promoted by Russell Investment Group. Nor does this company make any representation regarding the advisability of investing in iShares Funds. BlackRock is not affiliated with the company listed above. iShares® and BlackRock® are registered trademarks of BlackRock, Inc., or its subsidiaries. MSCI Emerging Market index is an index created by Morgan Stanley Capital International (MSCI), designed to measure equity market performance in global emerging markets. The Emerging Markets Index is a float-adjusted market capitalization index. MSCI®, and the MSCI index names are registered trademarks of MSCI Inc. or its affiliates. Where noted, S&P 500® Index, Russell 1000® Value Index, Russell 1000® Growth Index, iShares® Russell 1000 Value ETF and MSCI® Emerging Market Index are referenced with abbreviations and respective footnotes. Abbreviations include S&P 500, R1KV, R1KG and MSCI EM. Use of iShares ETF for a respective index is footnoted accordingly and/or mentioned as such. Performance commentary comparisons are made in reference to iShares, unless otherwise noted. Performance quoted represents past performance and does not guarantee future results. Investment return and principal value of an investment will fluctuate, and when sold, may be worth more or less than original cost. Returns for less than one year are not annualized.