SlideShare a Scribd company logo
1 of 14
¹Comments and opinions expressed reflect solely the personal views of Anthony Lombardi as of 3/31/17, and not any other individual or firm. Such views
are not a recommendation to buy or sell any security, fund or portfolio. Any investment decision should be made in consultation with a financial advisor.
MARCH 2017 INVESTMENT COMMENTARY
Rice Krispies Treat
With our typical investment horizon targeted at ~3-5 years, implicit in this holding period is not simply low
turnover (and low cost), but a time-period longer than a 1-term president or congressional representative. In
managing our high conviction, concentrated, contrarian, large cap value process, there was no need to scramble
adjusting our long-standing views, or portfolio positioning due to a new president, administration and
congressional make-up. Our December investment commentary detailed our reasons as to not succumbing to
near-term emotions of a new political landscape. As highlighted, we found tremendous irony in market
commentary discounting the degree of importance of the extended political period leading up to the presidential
election, to only then witness the deluge of opinions and comments, issued shortly thereafter, placing a premium
on the importance of investment positioning, complete with recommended portfolio changes best suited for the
¹Comments and opinions expressed reflect solely the personal views of Anthony Lombardi as of 3/31/17, and not any other individual or firm. Such views
are not a recommendation to buy or sell any security, fund or portfolio. Any investment decision should be made in consultation with a financial advisor.
MARCH 2017 INVESTMENT COMMENTARY
(now widely-known) outcome and potential implementation of a policy agenda. Unlike results of an election,
investment backdrops do not simply formulate overnight, nor should a disciplined investment process and
philosophy seek to radically alter a portfolio’s stock selection and sector allocation in the same vein. We have
made repeated comments regarding “Bifurcation” as a key, yet broad, underlying theme, and one that has very
much played into the context of our own thinking, and we have pointed to illustrative examples of how multiple
lenses can serve to foster swings in investor psychology and emotions; Brexit and the US election serving as
perhaps the two most notable during 2016, and a somewhat humbling, and short honeymoon period for a new
administration and congress in the early stages of 2017, as yet another.
A basic, yet key tenant of successful, repeatable investment outcomes was learned very early on by us, over a
favorite morning bowl of cereal. It was continuously reinforced all day in the classroom, still yet again in our
multiple extracurricular activities, and then one more heavy dosage provided when we returned home from our
day to our parents and family. Listen. Today, as practitioners of our Large Cap Value process, we keep on
listening--to a large bowl of data, information and emotions. A mixture of ingredients stretching from the
macroeconomic, to the company and sector-specific, we attempt, in a nonrobotic fashion, to discern the
meaningful from the white noise, seeking to ingest lean protein in an effort to strengthen our portfolio decision-
making. Not everything is as important as its represented, nor is every reaction justified, but these are critical
ingredients nonetheless to any market. We continue to listen to the
market, the macro backdrop, sectors and company news flow and
the swings in investor psychology. Each week, each quarter, each
year, each administration, each market and economic cycle has its
own unique Snap, Crackle, Pop, and that’s why waking up in this
business each day is just as fun as it was sitting at that breakfast table
as a kid. The current quarter debut the IPO of “Snap”, a disappearing
video/camera-based messaging app company valued at $31+ billion
by its 2nd
day of trading; the continued “Crackle” of the underlying smoke, ambers and fire of an improving
economic backdrop, increasingly higher confidence levels, Fed policy rate increases, escalating earnings
expectations, M&A’s continued march and a broadening improvement in global market performance; and, we
witnessed the “Pop” of celebratory GOP party balloons, which began spewing the gas of near ecstasy, post an
electoral sweep and stock market rally, as unity and a “can-and-will-do” atmosphere was humbled and deflated
by infighting, faulty execution, investigations, resignations, speculation and extreme partisanship. By quarter
end, pessimistic talking heads spoke of an administration that will not get anything done from a policy
perspective. Quite the pendulum indeed, and yet a near perfect example of market emotions at work.
No investor, us included, is going to get things right all the time, but we will always bring 100% of our passion
for finding contrarian value, stay true to our process, and have unrelenting focus on MOS (margin of safety).
Whether a function of near- or intermediate-term fundamentals, and/or investor psychology, our focus remains
on recognizing, assessing and seizing upon valuations that potentially present opportunities, be they BUY or
SELL. As contrarian, high conviction, long-term investors, employing an active, concentrated, large cap value
strategy, such swings serve as a building block in our constant assault seeking out opportunities for entry into,
and exit from, investment positions. In implementing our disciplined process, we overlay our longer-term secular
view as it pertains to the broader macroeconomic and market backdrop, which results in active sector and stock
Source: Kellogg's Corp
¹Comments and opinions expressed reflect solely the personal views of Anthony Lombardi as of 3/31/17, and not any other individual or firm. Such views
are not a recommendation to buy or sell any security, fund or portfolio. Any investment decision should be made in consultation with a financial advisor.
MARCH 2017 INVESTMENT COMMENTARY
exposures. Due to these factors and our assessment, we have maintained a notably contrarian view in our LCV
portfolio, with a heavy dose of cheapness, free cash flow and MOS. The great Coach Lombardi (yes, we are
biased!) was best able to motivate his players by stepping out of the football environment, bestowing unique,
yet powerful life perspectives—something no robot or investment algorithm, can replicate, feel or teach:
“…and each day, each week, each year, there is a new encounter, a new challenge. But all of the cheers and all of the color
and all of the display linger only in the memory. The spirit, the will to win and will to excel---these are the things that endure
and these are the qualities that are so much more important than any of the events that occasion them…the quality of every
person’s life has got to be a full measure of that individual’s personal commitment, regardless of what field he may be in.”
—Vince Lombardi
We just keep listening and implementing; as simple as “Snap, Crackle, Pop”—Process, Process, Process.
Portfolio Positioning & Review
Throughout 2016 and into early 2017, despite headline valuation of broader indices, we continued to believe
numerous individual security opportunities existed across several sectors of the domestic US stock market,
boding particularly well for a more concentrated, contrarian strategy. Our conviction has been anchored in a
belief that conditions, while not optimal, have been attractive for generating returns over our stated time-
horizon, a view that was contrarian to prevailing perceptions, but as noted in our December commentary
became a more centrally-held market view post-election. While our LCV portfolio remains fully exposed to all 11
sectors of the market, our focus has been steadfast—a favorable disposition to traditionally cyclical areas
possessing compelling valuations, financial statement strength, and where near-term psychology serve to
compensate for risk, providing the inherent MOS we seek when investing over a 3 to 5-year time horizon. While
conscious of risk factors, we are investors viewing through a risk/reward prism, in active pursuit of opportunities
providing the right balance. We believe a combination of cheapness, maintaining a contrarian view, and seeking
companies possessing stable balance sheets and attractive FCF characteristics, provides a more compelling
alternative to simply positioning our portfolio in a traditionally defensive manor (i.e. high allocations to sectors
such as Staples, Healthcare, Utilities, & Telecom). As regular readers of our commentary know, we found such
areas of the large-cap market simply too rich, with many individual equities having valuation levels well above
the broader market. Most notable in this context has been the lofty valuations in Consumer Staples and
Healthcare that existed during the course of 2016. Combined, these latter two sectors comprise ~23% of the
S&P 500; materially higher than our 14% target allocation at quarter-end. While other investors may choose to
stray to own safety, our value conscious, and process, simply will not allow us to pay any multiple for quality.
With the broader S&P 500 trading at ~18x forward EPS, many traditionally defensive areas of the market
command multiples at or above this level, particularly when viewed on a purely GAAP basis. We have readily
identified quality, balance sheet strength, and cash flows much cheaper elsewhere. Not only is this more
acceptable to our value and contrarian-based investment discipline, but also in recognition that forward long-
term returns are typically related to point-of-entry valuation multiples.
We did not see any need to change our investment views post-election, or post-rally. For us, it’s just about
staying true to our process and convictions. Thus, our portfolio positioning, sector allocations and stock positions
are largely unchanged at the end of 1Q17, except for actions we took to monetize winners following corporate
actions; or where we underscored convictions in existing holdings; or to remain true to process constraints.
¹Comments and opinions expressed reflect solely the personal views of Anthony Lombardi as of 3/31/17, and not any other individual or firm. Such views
are not a recommendation to buy or sell any security, fund or portfolio. Any investment decision should be made in consultation with a financial advisor.
MARCH 2017 INVESTMENT COMMENTARY
Where we think it prudent to rebalance, we continue to make active decisions, but without change to our
conviction in the large cap value opportunity set. We are still finding, buying and remaining owners of cheapness,
MOS and compelling FCF. When juxtaposed against our belief that favorable operating leverage opportunities
exist in the economy, and amongst the companies we target, we remain steadfast in how we desire to position
our LCV portfolio.
Key Trades & Attribution
We seeded a concentrated LCV strategy during the first quarter 2016. Since inception, as opportunities have
been presented, we have made several active decisions, at both the stock and sector level. During 1Q17, the
most notable actions included:
• 100bp DECREASE Energy Sector target
• 100bp DECREASE Telecom Sector target
• 100bp INCREASE Healthcare Sector target
• Selective rebalance trades in individual holdings within CD, CS, IND, TECH & ENE sectors.
For the fourth consecutive quarter, fundamentals warranted one full position SALE during 1Q17, as well as one
full position BUY, which were not part of the sector allocation changes or rebalancing discussed above. As noted
in prior commentaries, target sector weightings are influenced by our top-down and bottom-up views. Year-end
2016 target and market value weights for our LCV portfolio are detailed below.
On a market value basis, we ended 1Q17 with marginally higher cash ~0.9% (vs 0.6% 4Q16), below our interim
model target of 2.5% (vs 1.5% 4Q16). We have been methodical in deploying available cash, having purposefully
set aside some initial dry powder at inception. From a process perspective, our targeted process cash range is
designed to provide flexibility, allowing for repositioning within a highly concentrated, yet diversified portfolio.
We have a stated preference to monetize winners and/or sell-down positions based on process discipline, in so
¹Comments and opinions expressed reflect solely the personal views of Anthony Lombardi as of 3/31/17, and not any other individual or firm. Such views
are not a recommendation to buy or sell any security, fund or portfolio. Any investment decision should be made in consultation with a financial advisor.
MARCH 2017 INVESTMENT COMMENTARY
doing avoid placing capital at risk by simply holding investments as place-markers. MOS is paramount for us and
is critical in limiting potential downside. Protection of capital is a covenant we are unwilling to break and we
firmly believe in utilizing process-permitted cash level when situations dictate, to adhere to this core investment
principle. The full sale of CSX Corporation (CSX) in the March 2017 quarter, following a ~100% gain since
purchase, the full sale of Time Warner (TWX) in the December 2016 quarter following the announced acquisition
by AT&T (T), and the full sale of St. Jude Medical (STJ) during the June 2016 quarter following the announced
acquisition by Abbott Labs (ABT), serve as prime examples of our cash/MOS discipline, as do significant
rebalancing trades executed during the past year. In fact, our individual rebalance trades of ~50bps to ~100bps
are likely equal to another, less concentrated, lower conviction manager’s target position sizes.
Investment Performance. For the March quarter, our LCV portfolio generated total return of 4.53% vs the
Russell 1000 Value (R1KV) return of 3.27%, and broader S&P 500 return of 6.07%. For the full year ended March,
our LCV portfolio generated total return of 22.7% vs R1KV return of 19.2% and broader S&P 500 return of 17.2%.
Our portfolio’s outperformance of +126bps vs R1KV in the March quarter reflected continued high convictions,
underscored by several material portfolio actions throughout the past several quarters, including
opportunistically managing available cash. The portfolio’s characteristics continue to reflect a disciplined,
contrarian, value-oriented process. To this end, despite strong outperformance in 2016-2017, the portfolio
remains material cheaper across nearly every valuation metric, notably boasting higher yields (dividend & FCF)
when compared to the broader S&P 500, and R1KV, our primary value benchmark.
From a performance attribution standpoint, versus the R1KV, Allocation was positive while Security Selection
was a very modest negative contributor during the March quarter, amounting to ~+133bps and ~-7bps,
respectively. Industrials, Technology and Energy were the most significant contributors in total attribution, while
Financials and Consumer Staples were the most significant detractors. By Allocation, the Energy and Technology
sectors had the largest positive attribution, while Healthcare and Consumer Staples were the largest negative
contributors. By Stock Selection, Industrials were the single largest contributor, while Financials were the single
largest drag. On an absolute basis, our portfolio had three sectors decline quarter/quarter; Energy, Telecom and
Financials. Within the R1KV, both Energy and Telecom experienced declines. Since inception, no sectors in our
LCV portfolio, or the R1KV, declined on an absolute basis. During 1Q17, we made several active decisions to both
increase certain stock and sector level weightings while reducing others, reflective of process, our conviction
level and targeted investment opportunities. Included in these actions were decisions to exit one full position,
while correspondingly establishing one new full position, both which occurred in Industrials, negating any change
in target weighting for the sector in aggregate. While there was modest change in portfolio liquidity when
comparing period-end amounts, holding idle cash intra-quarter was an active decision on our part, prior to
deploying funds after the sale of CSX, and sector target reductions in Energy and Telecom. During the quarter,
our cash position was a benefit, providing a tailwind of ~5bps.
Energy target weighting reduced 100bps: 6.00% to 5.00%
Energy remains our most pronounced exception to our favorable cyclical bias, with our portfolio allocation
emphasizing a strategic decision to be prudent and mindful of our concerns. Notably, we took process-related
action during 1Q17 to further REDUCE our sector allocation. Process is key for us, and we listen to our process
and actively implement it, otherwise there is no process. With the S&P 500 weighting at ~6.60%, the maximum
¹Comments and opinions expressed reflect solely the personal views of Anthony Lombardi as of 3/31/17, and not any other individual or firm. Such views
are not a recommendation to buy or sell any security, fund or portfolio. Any investment decision should be made in consultation with a financial advisor.
MARCH 2017 INVESTMENT COMMENTARY
we could allocate to the sector is ~9.90%. Strategically we desire to remain meaningfully underweight, thus our
Energy sector target was cut 100bps to 5%, from 6%, which at quarter-end was ~160bps and ~715bps below S&P
500 and R1KV, respectively. As we have previously stated, we believe the sector to be a quintessential “value
trap”. While cognizant of the rally from lows hit a year ago, WTI remains more than 50% below its 2014 highs,
as do many energy-related share prices. Our fundamental concerns remain the same and, in our opinion, will
take several years to fully play out. Our view has been premised upon a multitude of macro, secular and company
specific issues, ranging from demand/supply imbalance, record inventories, technological change, a less
influential OPEC in the context of history, corporate restructurings, balance sheet repair and various short/long-
term macro factors across developed and emerging market countries. Among major concerns we continue to
have is the ability of companies to generate meaningful and requisite FCF over our typical investment horizon,
unfavorable balance sheet developments (write-downs, dilutive capital raises, fire sale prices of assets, etc.) and
constrained capital management owing to multiple stress points in the end-market. As a result, we remain very
cautious given this view, in a sector more technically-driven than others, and where itchy fingers rest on
production triggers ready to pull upon any sustained price appreciation in the commodity. In the end, the most
significant constraint is valuation. Many large cap Energy valuation multiples (Book Value, EBITDA, EPS, FCF yield,
etc.) on a trailing and forward basis are not compelling, indeed they remain quite expensive or non-existent (due
to limited or nominal level of earnings), leverage remains high and FCF is negative-to-modest during the next 2
years, particularly should capital expenditures be ramped back up.
Against the Energy sector’s current near-term fundamentals, and unfavorable secular backdrop, we remain of
the opinion a bifurcated, underweight allocation is most appropriate given our low level of conviction. Setting
out to be a hero against major secular changes, heightened visibility challenges for management, and a
technically-driven sector, is not an appetizing proposition looking out the next few years. We’d much rather
pursue less direct, alternative opportunities to gain commodity-related exposure, in situations possessing better
MOS and/or more compelling risk/reward, while maintaining a direct underweight allocation vs the Energy
sector. In the event of lower-for-longer energy prices, we believe there to be other potential beneficiaries that
are more compelling. As stated in our December commentary, 2017 should prove interesting as to whether end-
market prices and production levels hold, as well as the degree to which management teams stay true to the
required financial discipline to justify share prices. We believe there to be a significant difference in business
models and financial flexibility across the sector, anticipating many restructurings and cash flow recoveries will
likely come up well short.
Telecom target weighting reduced 100bps: 4.0% to 3.0%
As was the case with Energy, our Telecom target weighting was cut 100bps, driven by process. We have closely
followed this sector’s evolution the past 20 years, and seen its weighting in the S&P 500 continue eroding, with
it now the smallest market cap weighting of 11. While the performance of other sectors has contributed to
Telecom’s shrinkage, we have found this secular development notable in the context of low nominal interest
rates and, more surprisingly, the massive amount of inter- and intra-industry consolidation that has taken place
over the prior two decades. Thus, even with Telecom survivors buying their “own”, acquiring media and
communications companies residing in Consumer Discretionary, as well as acquiring in Technology, this “transfer
of market cap” has not been enough to stop the compression in the sectors representation in the S&P 500. With
the its weighting at ~2.40% in the S&P 500, from a shear process standpoint the maximum we could allocate to
¹Comments and opinions expressed reflect solely the personal views of Anthony Lombardi as of 3/31/17, and not any other individual or firm. Such views
are not a recommendation to buy or sell any security, fund or portfolio. Any investment decision should be made in consultation with a financial advisor.
MARCH 2017 INVESTMENT COMMENTARY
the sector would be ~3.60%. With process pointing us lower, and with yield and valuations more readily available
and compelling elsewhere, potential risk of further business model and shareholder dilution rising, and the
reduced prospect for material lift in the sector’s representation in the S&P 500, we made the active decision to
cut 100bps from Telecom. Despite the reduction, the sector remains on watch for us for potential further actions
should fundamentals warrant. As a reminder, we sold our full position in TWX last quarter, realizing significant
appreciation following the announced (and still pending) acquisition by AT&T, a stock we prefer not to own.
Healthcare sector target weighting increased 100bps: 8.0% to 9.0%
We have been long critical of the unappetizing valuation levels, and the lack of contrarian names within the
defensive complex of the market, most notably Consumer Staples and Healthcare. Combined, our target
allocation to these two sectors has been at drastically lower levels, ~1000bps, during the past year. In the June
quarter of 2016, we monetized our position in STJ (4% target) following the announced acquisition by ABT,
reallocating only 200bps back into HC which left our target sector weighting at 8% versus an original 10%. On
the heels of increased pessimism, fears emanating from both political party’s having the industry in the
crosshairs, and select weakness in biotech, pharma, facilities, and device stocks, modestly more compelling
valuations materialized in HC sector. While by no means a wholesale change, the sector began offering a bit
more opportunity, particularly when compared to the Energy and Telecom complex; two areas where we
reduced allocations during the quarter. That said, we retain a material underweight allocation to HC, ~ 500bps
versus the S&P 500 at quarter-end.
Industrial target weighting unchanged & overweight, having executed one FULL SALE and one FULL BUY: 14.5%
During 1Q17, we executed the full SALE of CSX Corporation, which funded the purchase of a new position within
IND. The CSX sale, and subsequent new purchase maintained our IND allocation at 14.5%, a sector where the
maximum allowable process weighting was ~15% at quarter-end. The IND sector target overweight reflects our
conviction in a long-standing, favorable cyclical view, and the opportunity set available amongst individual
security holdings. The purchase and sale of CSX serves as a microcosm of our disciplined, contrarian value-based
process. At time of original purchase and portfolio inception, CSX was our lone 2% individual target position,
reflecting our desire to leave some dry powder available for utilization. During the June 2016 quarter, we
executed a 100bp increase in our target weighting in CSX, which resulted in an average cost of $25 for the full
3.0% position. Our reasons for CSX purchase were multifold:
• Cyclical exposure, and a desire to reflect our contrarian view of a stronger economic backdrop and
prospect for further improvements; transportation and cyclical exposure on rails.
• Market position: CSX #3 of 7 North American rails; Eastern oligopoly along with Norfolk Southern; 20k
route miles and 23 states. Not just about coal but market focus was acting to compress valuation and
sentiment; Intermodal represented ~ 50%; significant operating cost benefit opportunity and operating
leverage improvement expected to be realized; IoT world very much needs transport side of economy.
• Contrarian: 45%-50% Hold/Sell-rating by analyst community combined with stock underperformance.
• Balance sheet: BBB+ senior credit rating
• Valuation: Div. yield 3.0%, FCF yield 3.4%, P/E 12x fwd, P/Sales 2.0x, EV/Sales 2.8x, P/Book 2.0x,
EV/EBITDA 6.7x
¹Comments and opinions expressed reflect solely the personal views of Anthony Lombardi as of 3/31/17, and not any other individual or firm. Such views
are not a recommendation to buy or sell any security, fund or portfolio. Any investment decision should be made in consultation with a financial advisor.
MARCH 2017 INVESTMENT COMMENTARY
Our reasons for sale were due to material changes in both valuation and sentiment (macro and company-
specific). CSX had gone from a very inexpensive cyclical stock with low expectations to one that became fully
valued. The company experienced a complete swing in expectations regarding operating improvement based
upon the insertion of a new CEO, in concert with an activist investor. In one day in mid-January, its share price
increased 22%. In the span of our one year holding period, CSX share price appreciated ~100% and several
valuation multiples noted above doubled, while dividend yield was halved and FCF yield declined to 3% (despite
a doubling in FCF $ expectations). Analyst consensus target price for CSX increased to ~$55 from ~ $27 at time
of purchase. Given significant change in valuation and sentiment, and our disciplined focus on MOS, we fully
exited CSX after the price action. Following an active decision to hold temporary cash, we proceeded with
funding a full 3% purchase of a targeted position in IND prior to quarter-end. This new position met all
parameters of our investment process and philosophy, particularly with respect to compelling valuation and
contrarian in nature. Our remaining action in the IND sector during the quarter was the rebalance of one
additional position down to target of 3.00%.
Consumer Discretionary: No sector weight change; 3 rebalance trades to target
Following last quarters full sale of Time Warner (TWX), we executed 3 rebalance trades within CD during the first
quarter to bring positions to targeted levels. Two positions were rebalanced up to target levels while a third
position was sold down to target. Cumulatively, these three actions involved ~325 bps of portfolio market value.
Our sector target allocation remained 16.5%, an active overweighting of ~420bps versus the S&P 500.
Information Technology: No sector weight change; 2 rebalance trades to target
Within TECH, among the strongest sector performers, we trimmed back two positions to initial targets.
Cumulatively, these transactions comprised nearly 50bps of portfolio market value, however our TECH sector
target remained unchanged at 21%, ~110bps lower versus the S&P 500 at quarter-end. Compared to the R1KV,
our targeted TECH sector weighting represented ~1100bps of overweight, reflecting our conviction in both the
macro and company-specific backdrops pervasive throughout our LCV portfolio.
Consumer Staples: No sector weight change; rebalance to target
As in Healthcare, we remain materially underweight CS sector owing, in our opinion, to very rich valuations. The
sector has garnered M&A-related interest and has been an overcrowded defensive vehicle. Our process and
philosophy, along with our contrarian mindset and focus on MOS, provides for very little in the way of
opportunity set. From a macro perspective, we remain gearing the portfolio elsewhere. That said, we did make
an active decision to utilize ~ 60bps of portfolio market value to rebalance up to target within the CS sector.
Cash level up 100bps
Our portfolio target cash level increased versus year-end, from 1.50% to 2.50%, as we continued making active
use of permitted process cash levels during the quarter through the execution of various actions noted above.
From a market value perspective, cash level was 0.9% at quarter-end.
Market and Economic backdrop
We have highlighted with each commentary key underlying themes in the backdrop, and at the top of the list
each quarter has been the constant, and unfortunate events of terrorism. This past quarter was no different, as
¹Comments and opinions expressed reflect solely the personal views of Anthony Lombardi as of 3/31/17, and not any other individual or firm. Such views
are not a recommendation to buy or sell any security, fund or portfolio. Any investment decision should be made in consultation with a financial advisor.
MARCH 2017 INVESTMENT COMMENTARY
the events in London during the last week of March served as the most recent. Throughout the world, we all
have continued to witness numerous such attacks, devastation and personal tragedies as thousands of innocents
were injured, or lives lost. Each time, first responders and the collaborative efforts by all areas of law
enforcement are to be commended. However, with each such event, we are also reminded of a world dynamic
which has changed, is ever present, and requires continued global attention for such cowardly acts. The world
cannot afford to be bifurcated in its stance against this enemy, nor can it ever succumb.
In like a lion, out like a lamb. The broader US equity market posted relatively strong performance on the heels
of a post-election fourth-quarter rally, with growth and emerging markets posting upside that would be
respectable for a full year. Entering early March, however, emotions and concerns within the US began to rise
as a celebratory mood and honeymoon period for a new administration quickly hit an early expiration date. In
1Q17’s first nine weeks, the S&P 500 experienced a ~7% increase, prior to declining ~1.3% from an intra-quarter
peak to close out the quarter +5.5%, on a price basis. For the quarter, the S&P 500 posted a 6% total return, with
notably wide variance by sector and industry group. Growth (Russell 1000) meaningfully outperformed Value by
~565bps, while Emerging Markets (MSCI) more than one-upped the entire pack, posting a +11.5% total return.
U.S. interest rates, and spreads, which had been on a continued path lower for some time, appear to have
bottomed given broad expectations for improved growth, higher inflation, and changes in monetary and fiscal
policy. Across the globe, the performance of stock markets (total returns, U.S. Dollars) was bifurcated, but only
in terms of degrees of strength, both versus the US and 4Q16’s results: Mexico +17.3% (vs -8.9% in 4Q16), Brazil
+12.1% (vs +3.0%), Australia +10.7% (vs -1.7%), Hong Kong +9.9% (vs -5.3%), France +7.1% (vs +3.0%), UK +5.3%
(vs -0.7%), Japan +4.4% (vs +1.2%) and China +1.8% (vs -5.2%). For the quarter, the S&P 500 posted +5.5% price
increase. Comparatively, the R1KV fell below the broader market, at +2.6%, and meaningfully below R1KG, at
+8.5%, with Technology sector strength and Financial sector weakness driving much of the differential.
Notably, spread compression across the term structure occurred in the quarter, driven by rising short-end and
a pull-back in long rates. As measured by the 10-year US Treasury yield, the benchmark rate began 2016 at
2.27%, declined to 1.47% by the end of 2Q16, 2.45% by year-end, prior to finishing 1Q17 at 2.39%. Yield curve
slope, using 1yr-10yr spread, which had expanded to ~ 165bps at year-end 2016, subsequently declined to ~
140bps at end of 1Q17, a level also well below ~205bps, 5-years prior. The combination of a strong 4Q16 rally,
spread compression and swings in psychology regarding the new administration’s anticipated success at
implementing its policy agenda drove much of the weakness in Financials during 1Q17.
As noted last quarter with respect to monetary policy: “with the first two moves out of the way, and the election
season over, we would not be surprised to see a more fluid pace of change regarding monetary policy should
situations warrant. This would include the possibility of at least one 50bp change amongst the current unit count
of rate change decisions anticipated, and/or more action steps than currently discounted by the market.” We
continue to believe data dependency will remain the foundation for monetary policy, with any changes needing
to justified by the backdrop—the latter which we have been positively disposed for some time, and expect to
continue driving interest rate movements and policy. At this stage of the domestic economic, monetary and
fiscal policy cycles, we remain less focused upon unit count of rate increases anticipated by the market and more
biased to the level of potential rate changes, and the impact such step-changes could serve to vastly exceed
market expectations. We would also expect to see more transparent discussions from the Fed regarding policy
¹Comments and opinions expressed reflect solely the personal views of Anthony Lombardi as of 3/31/17, and not any other individual or firm. Such views
are not a recommendation to buy or sell any security, fund or portfolio. Any investment decision should be made in consultation with a financial advisor.
MARCH 2017 INVESTMENT COMMENTARY
actions pertaining to more active reduction of its $4.5 trillion in assets. At times, this part of monetary policy
seems to be lost amongst the market’s laser focus, and expectations upon, the unit count of rate increases in
the forward 12-month calendar.
Capital allocations and priorities are likely to change. We reiterate we would not be surprised to witness
corporate actions that lead to a re-ranking of capital management priorities given potential for more favorable
tax code, deregulation, improving economic activity and executive management confidence, along with a
corresponding increase in capital and human resource investment. Such changes could have negative
implications for the level and/or pace of share repurchases and dividend increases witnessed during the recovery
period since the trough of the financial crisis, and likely vary by sector. To this end, given underlying performance
of the stock market, simple mathematics suggest lower marginal buying power of previously approved, and
remaining buyback authorizations. Still further yet, finance 101 would suggest higher valuation multiples present
as less appetizing to corporate CFO’s and Treasurers, acting as an incremental constraint. We also remain
cognizant that saber rattling regarding manufacturing and trade could create the potential for supply chain
issues to become quite noteworthy. With exposure to several such factors, we note the Tech sector remains
squarely in these cross-hairs, both positive and negative. As typically the case, earnings and free cash flow
generation will be serve as a key driver of the ultimate determinant of capital allocation.
Volatility remains in check. Market volatility, as measured by the CBOE Volatility Index (VIX) remains at relatively
subdued levels, hitting a post inaugural low of 10.6 in the final week of January 2017. At quarter-end, the VIX
rested at 12.4, still near 5-year lows. In fact, since 1990, a year marked by the precipice of a multiyear financial
crisis (and recession) involving S&L’s and commercial banks, the low mark on the VIX has been 9.3, and the
average, 19.6. During the past year, exceptions were an immediate, post-UK “Brexit” vote increase in late June,
a less prominent VIX increase in late September, and the early November spike related to U.S presidential
election. Notably, each of the three most prominent spikes during 2016 was successively less than prior peak.
Recent FOMC decisions; intra-meeting commentary regarding rate policy; swirling, divisive and emotional
political winds blowing in Washington during the first 70 days of a new administration, and political disruptions
across the globe have had less of an impact on the VIX than either two major votes: Brexit and the U.S.
presidential election.
The U.S. Dollar remains strong, while oil retreats. Given the confluence of global events, relative strength of the
U.S. economic backdrop, and perceived safety of U.S. capital markets, we have been of the view that a dire
outcome for the Dollar will remain an unlikely scenario in the near-to-intermediate term. The Dollar index (DXY)
has meaningfully held its post-Brexit increase, only modestly declining from a 10-year high attained during 4Q16.
Capital investment and potential cross-border M&A, utilizing a stronger currency, are potential benefits of the
Dollar’s strength. Further, to the point where any such investments or acquisitions lead to internationally parked
cash, any potential favorable tax changes allowing for repatriation would serve as an incremental benefit from
internationally exposed businesses. Oil, along with other commodities, retreated during the quarter, following
a modest recovery in the prior quarter, the latter due in part to OPEC members formalizing production cuts,
subsequently executed during the last few months. While up sharply from a February low of $26, the front-end
contract for oil remains ~50% below its 2014 high, underscoring a basic, yet painful investment fact: a 50% loss
requires a 100% recovery. Beyond the risks previously highlighted with respect to high inventories, technological
¹Comments and opinions expressed reflect solely the personal views of Anthony Lombardi as of 3/31/17, and not any other individual or firm. Such views
are not a recommendation to buy or sell any security, fund or portfolio. Any investment decision should be made in consultation with a financial advisor.
MARCH 2017 INVESTMENT COMMENTARY
benefits and change, potential production cut slippage amongst OPEC, and production triggers being pulled by
U.S. producers, a further constraint on materially higher price levels is the potential headwinds to economic
growth that could metastasize with any further material rise in WTI. Oil bulls should be mindful of what they
wish. Balance sheet actions, including divestitures, by several companies were announced during 1Q17, and we
expect more to follow—we are just not in any rush to add portfolio exposure given better opportunities
elsewhere.
Confidence of management and boards to take on risk, evidenced by appetite to do deals spanning various
sectors and geographies, remains high. Among some notable announcements and news flow in 1Q17: J&J/ATLN
($30 bil all Cash), Reckitt Benckiser/Mead Johnson ($18 bil all Cash), and Intel/Mobileye ($14 bil all Cash). A
proposed KHC/ULVR ($163 bil) acquisition was withdrawn almost as quickly as the market became aware and
started crunching numbers, but target speculation continues for KHC. An unsolicited ($24 bil) bid for Akzo Nobel
by PPG, remains active. Rumor and speculation has continued to percolate regarding several names in media &
telecom, including a potential large move by Verizon, possibly for CHTR (~ $100 billion market cap), and the
prospect of CMCSA stepping into the acquisition ring again (having taken a $500 million position in SNAP’s IPO).
Hudson Bay purportedly sniffed and walked from a $10 billion highly leveraged deal involving Macy’s, but may
still be on the prowl. Two other large deals in healthcare fell apart under pressure, most notably from the courts
and/or DOJ, including the $50.4 billion ANTM/CI acquisition, and the $29.4 billion AET/HUM acquisition. Legal-
related matters are still pending.
From an economic perspective, 4Q16 Real GDP most recent revision was +2.1%, with 1Q17 estimated at +1.9%.
Forward estimates for 2017 and 2018 remain unchanged, currently +2.2% and +2.3%, respectively. The labor
market has witnessed continued improvement, generally posting nonfarm payroll gains of ~150k-300k/month
since 2013, versus crisis level losses of ~ 900k/month in 2008-09. The most recent print was +235k. The
unemployment rate remains relatively steady, having declined ~ 500 bps from its peak, with estimates tracking
at 4.6% and 4.5% for 2017 and 2018, respectively. As noted in our prior commentaries, despite the labor market
backdrop, aggregate economic growth has yet to accelerate. Fed commentary has continually underscored
policy maker’s data dependency, with a bias to more than just U.S. economic conditions. Most notable has been
the shift in the Fed’s holding pattern, to a much-anticipated policy rate increase cycle. This change has mimicked
the increased hawkishness that appeared to be stirring in FOMC statements, despite longer-term projections of
growth and rate levels (the dots) in the Fed forecasts having previously been declining. Given global monetary
stimulants that have existed for some time, and with the prospect of added Fiscal accelerants, monitoring of
price and wage inflation metrics remain at the forefront, and pressure has been warming a bit here. We have
repeatedly underscored our belief that there is a good amount of operating leverage in the system, that can be
readily monetized for the benefit of shareholders/consumers should top-line revenue (& GDP) growth move
sustainably higher. We have also been cognizant of the amount of monetary stimulus that has occurred without
a meaningful ramp in GDP, but in the context of the magnitude of the deepness of the economic hole, a longer
ladder was required. Our comfort level in having positioned with a more cyclical bias remains founded upon
valuation multiples and balance sheet/cash flow conditions of the company’s we both seek, and own, as well as
the corporate actions and broader economic conditions we continue to witness, and expect—all which well-
preceded the election results last year.
¹Comments and opinions expressed reflect solely the personal views of Anthony Lombardi as of 3/31/17, and not any other individual or firm. Such views
are not a recommendation to buy or sell any security, fund or portfolio. Any investment decision should be made in consultation with a financial advisor.
MARCH 2017 INVESTMENT COMMENTARY
A stop at the Five and Dime; positive earnings picture likely to continue. Heading into 1Q17 earnings season,
based on FactSet data, aggregate S&P 500 EPS on a reported basis are estimated at ~ $29.49, representing a
year/year increase of ~ 9%. Compared to December 31, the estimated 1Q17 earnings growth for the S&P 500
has dropped ~ 4%. Estimates typically come down during a quarter. However, current and recent quarter
downward trajectories have been less than average due to a combination of lower cuts by analysts, a reduced
level of negative guidance by companies and generally easing comps in the more pressured sectors. Top-line
revenue growth forecast of 7.2% has declined modestly vs December 31, with implied margin stability in the
aggregate, as well as positive leverage in outer quarters (in line with our long-held view). Basic math of the
market supports the margin trajectory given the underlying weighting of the high-level contributors, notably
Technology (22% of S&P 500 market cap) and the declining weight of the largest detractors, notably Energy
(6.5% of S&P 500 market cap). Should earnings growth increase in 1Q17 as expected, it will represent the 3rd
consecutive quarter of y/y improvement, following 6 quarters of decline prior. Beyond Technology, a large part
of the earnings turn has been an improving picture for Financials and the lapping of poor comparisons within
the commodity complex, the latter most visible in the Energy sector. While the level of degradation within Energy
has apparently run its course, we believe a long and uncertain road remains ahead. The sector has transitioned
from the precipice of negative comparisons. FY16 earnings and revenue for the Energy sector declined ~ 76%
and ~ 18% y/y, respectively, and are expected to post gains of ~ +300% and ~ +22% in FY17. On a reported basis,
8 of 11 sectors are expected to be in positive territory for the quarter, with Industrials, Telecom and Consumer
Discretionary in the red. Energy and Financials possess the highest expected improvement. Recall also, that our
two most significant underweight portfolio allocations are amongst the most sizeable sectors of market;
traditionally defensive areas of Healthcare and Consumer Staples. Notably, 1Q17 estimates have declined quite
dramatically during the past 90 days for HC and CS, to +0.5% (vs +4.0%) and +1.6% (+6.2%), respectively.
As we underscored last quarter, given a strong post-election rally in the market and the turn in aggregate
earnings during the last few quarters, the most relevant issue during earnings season will be management
commentary and affirmation of guidance for 2017. It has not only been President Trump’s first 70 days, but also
70 days for which management teams and boards have had the chance to better assess the overall climate and
backdrop. Our “listening” of the market suggests the underlying positive “Crackle” for the macro and company
specific remains in place. Currently, the outlook for 2017 is for estimated top-line growth of ~ +5% y/y and
earnings growth of ~ 10%, what we have affectionately called a “Five & Dime” picture for the market backdrop
(5% top and 10% bottom-line growth). By sector, the picture is quite different, with bifurcation in earnings led
by Energy and Utilities (only sector estimated to be down) at the extreme tails of expectations. As both these
sectors are materially smaller in market capitalization, we reiterate the more relevant story to monitor during
the year will be those sectors within the tails. All else constant, the basic math of the market’s forward P/E would
suggest it may not be as rich as generally perceived when viewed in the context of the Technology sector’s high
profit margins, the Financial sector trading at less than 15x forward EPS, and Energy trading at nearly 30x.
Bottom line: As contrarians, we are attracted to many facets in the backdrop noted above, particularly those
that underscore the fundamental and emotional swings part of any natural market environment. It is the short-
to-intermediate term fluctuations which provide the right backdrop for us to position our portfolio for the long-
term at both the sector and security level. While we have noted selective areas of the market as expensive
(namely traditionally defensive, higher quality sectors and a fundamentally challenged commodity complex),
¹Comments and opinions expressed reflect solely the personal views of Anthony Lombardi as of 3/31/17, and not any other individual or firm. Such views
are not a recommendation to buy or sell any security, fund or portfolio. Any investment decision should be made in consultation with a financial advisor.
MARCH 2017 INVESTMENT COMMENTARY
many of the cyclical areas remain compelling to us. If one simply focuses on the aggregate level of the market,
to include broader market earnings growth, valuation metrics, GDP growth, and nominal debt levels the
backdrop might be viewed challenging. We prefer to go deeper, into sectors and individual stocks, assess related
fundamentals and metrics, place broader macroeconomic measures such as GDP growth into context, and break
apart aggregate metrics such as debt into more relevant measures such as net debt, interest costs and coverage
ratios, etc. In so doing, we have been quite bullish as to the opportunity set in our concentrated, yet diversified
large cap value strategy. That is not to say the opportunity set would be the same for other investors in different
or less-concentrated strategies. As long-term investors, we remain focused on executing a consistent process,
buying cheapness and not over-paying for quality. As disciplined contrarians, mindful of capital protection, we
continue to find the cyclical sectors, ex-energy/commodities, home to stocks with the most compelling
valuations relative to the broader market. Given our contrarian nature, we are also cognizant of consensus
continuing to move in our direction during 2016 and early 2017, although much of the change was back-end
loaded, and not universal across the macroeconomic, sector or individual stock landscape. Nevertheless, we
remain quite sensitive to the shifts that have occurred, and our radar is certainly dialed up for changes that cause
swings in the pendulum too far in any one direction. Conviction is key for us, and is reflected in our portfolio
actions. Most importantly, with any company, it is those possessing characteristics strong in balance sheet and
free-cash flow, combined with compelling equity valuation, that garner our attention--these remain the type of
roommates we prefer when seeking opportunity and MOS.
AAL
Document is meant to be used in its entirety. Reference to prior quarterly and monthly publications is noted.
Views expressed represent personal assessment of privately managed separate account and market environment as of the date indicated, and should not
be considered a recommendation to buy, hold or sell any security, and should not be relied on as research or investment advice. Information is as of the
date indicated and subject to change. All market and other related information relied upon and mentioned is from market data sources viewed as reliable.
No guarantees are made regarding accuracy.
Index returns are for illustrative purposes only. Index performance returns do not reflect any management fees, transaction costs or expenses. Indexes
are unmanaged and one cannot invest directly in an index. Past performance does not guarantee future results.
The S&P 500 Index measures the performance of 500 mostly large-cap stocks weighted by market value, and is often used to represent performance of
the U.S. Stock market.
The Russell 1000 Value Index measures the performance of the large-cap value segment of the U.S. equity universe. It includes those Russell 1000
companies with lower price-to-book ratios and lower forecasted growth values. The Russell 1000 Growth Index measures the performance of the large-
cap growth segment of the U.S. equity universe. It includes those Russell 1000 companies with higher price-to-book ratios and higher forecasted growth
values. Russell Investment Group is the source and owner of the trademarks, service marks, and copyrights related to the Russell Indexes. Russell® is a
trademark of the Russell Investment Group.
iShares® Funds are distributed by BlackRock Investments, LLC. The iShares Funds are not sponsored, endorsed, issued, sold or promoted by Russell
Investment Group. Nor does this company make any representation regarding the advisability of investing in iShares Funds. BlackRock is not affiliated with
the company listed above. iShares® and BlackRock® are registered trademarks of BlackRock, Inc., or its subsidiaries.
MSCI Emerging Market index is an index created by Morgan Stanley Capital International (MSCI), designed to measure equity market performance in
global emerging markets. The Emerging Markets Index is a float-adjusted market capitalization index. MSCI®, and the MSCI index names are registered
trademarks of MSCI Inc. or its affiliates.
Where noted, S&P 500® Index, Russell 1000® Value Index, Russell 1000® Growth Index, iShares® Russell 1000 Value ETF and MSCI® Emerging Market Index
are referenced with abbreviations and respective footnotes. Abbreviations include S&P 500, R1KV, R1KG and MSCI EM. Use of iShares ETF for a respective
¹Comments and opinions expressed reflect solely the personal views of Anthony Lombardi as of 3/31/17, and not any other individual or firm. Such views
are not a recommendation to buy or sell any security, fund or portfolio. Any investment decision should be made in consultation with a financial advisor.
MARCH 2017 INVESTMENT COMMENTARY
index is footnoted accordingly and/or mentioned as such. Performance commentary comparisons are made in reference to iShares, unless otherwise
noted.
Performance quoted represents past performance and does not guarantee future results. Investment return and principal value of an investment will
fluctuate, and when sold, may be worth more or less than original cost.
Returns for less than one year are not annualized.

More Related Content

What's hot

FT Article Reprint
FT Article ReprintFT Article Reprint
FT Article ReprintDex McLuskey
 
NWAM investment outlook 12-31-18
NWAM investment outlook 12-31-18NWAM investment outlook 12-31-18
NWAM investment outlook 12-31-18Patrick Thuemmel
 
Risks to China Outlook Intensify
Risks to China Outlook IntensifyRisks to China Outlook Intensify
Risks to China Outlook IntensifyHayden Briscoe
 
Hyre Weekly Commentary
Hyre Weekly CommentaryHyre Weekly Commentary
Hyre Weekly Commentaryhyrejam
 
Putnam Fixed Income Outlook q313
Putnam Fixed Income Outlook q313Putnam Fixed Income Outlook q313
Putnam Fixed Income Outlook q313Putnam Investments
 
Top 10 market themes 2017
Top 10 market themes 2017Top 10 market themes 2017
Top 10 market themes 2017Susana Gallardo
 
Real Estate Capital Markets Are Alive, If Not Quite Well
Real Estate Capital Markets Are Alive, If Not Quite WellReal Estate Capital Markets Are Alive, If Not Quite Well
Real Estate Capital Markets Are Alive, If Not Quite WellDan Hutchins
 
Putnam Perspectives: Fixed Income Outlook Q1 2014
Putnam Perspectives: Fixed Income Outlook Q1 2014Putnam Perspectives: Fixed Income Outlook Q1 2014
Putnam Perspectives: Fixed Income Outlook Q1 2014Putnam Investments
 
Prudent approach to bond investing part 2
Prudent approach to bond investing part 2Prudent approach to bond investing part 2
Prudent approach to bond investing part 2Paul Escobar
 
Corporate Loans to Manage Rate Sensitivity_-_White_Paper
Corporate Loans to Manage Rate Sensitivity_-_White_PaperCorporate Loans to Manage Rate Sensitivity_-_White_Paper
Corporate Loans to Manage Rate Sensitivity_-_White_PaperAllan Smallwood, CFA
 
July 15 I Session 1 I GBIH
July 15 I Session 1 I GBIHJuly 15 I Session 1 I GBIH
July 15 I Session 1 I GBIHGBIHSupport
 
Hyre Weekly Commentary
Hyre Weekly CommentaryHyre Weekly Commentary
Hyre Weekly Commentaryhyrejam
 
Kkase capital quarterlyletter q313-1
Kkase capital quarterlyletter q313-1Kkase capital quarterlyletter q313-1
Kkase capital quarterlyletter q313-1Frank Ragol
 
Kkase capital quarterlyletter q313-1
Kkase capital quarterlyletter q313-1Kkase capital quarterlyletter q313-1
Kkase capital quarterlyletter q313-1Frank Ragol
 
Sprung investment management commentary 4th quarter, 2013
Sprung investment management commentary   4th quarter, 2013Sprung investment management commentary   4th quarter, 2013
Sprung investment management commentary 4th quarter, 2013Robert Champion
 
Rich Ralston – Proactive Advisor Magazine – Volume 3, Issue 10
Rich Ralston – Proactive Advisor Magazine – Volume 3, Issue 10Rich Ralston – Proactive Advisor Magazine – Volume 3, Issue 10
Rich Ralston – Proactive Advisor Magazine – Volume 3, Issue 10Proactive Advisor Magazine
 

What's hot (20)

Monthly Perspectives - Strange Days - May 2016
Monthly Perspectives - Strange Days - May 2016Monthly Perspectives - Strange Days - May 2016
Monthly Perspectives - Strange Days - May 2016
 
Thought for the_week_-_268
Thought for the_week_-_268Thought for the_week_-_268
Thought for the_week_-_268
 
FT Article Reprint
FT Article ReprintFT Article Reprint
FT Article Reprint
 
NWAM investment outlook 12-31-18
NWAM investment outlook 12-31-18NWAM investment outlook 12-31-18
NWAM investment outlook 12-31-18
 
2018 01-25 hm
2018 01-25 hm2018 01-25 hm
2018 01-25 hm
 
Risks to China Outlook Intensify
Risks to China Outlook IntensifyRisks to China Outlook Intensify
Risks to China Outlook Intensify
 
Hyre Weekly Commentary
Hyre Weekly CommentaryHyre Weekly Commentary
Hyre Weekly Commentary
 
Putnam Fixed Income Outlook q313
Putnam Fixed Income Outlook q313Putnam Fixed Income Outlook q313
Putnam Fixed Income Outlook q313
 
Top 10 market themes 2017
Top 10 market themes 2017Top 10 market themes 2017
Top 10 market themes 2017
 
Flow of Funds
Flow of FundsFlow of Funds
Flow of Funds
 
Real Estate Capital Markets Are Alive, If Not Quite Well
Real Estate Capital Markets Are Alive, If Not Quite WellReal Estate Capital Markets Are Alive, If Not Quite Well
Real Estate Capital Markets Are Alive, If Not Quite Well
 
Putnam Perspectives: Fixed Income Outlook Q1 2014
Putnam Perspectives: Fixed Income Outlook Q1 2014Putnam Perspectives: Fixed Income Outlook Q1 2014
Putnam Perspectives: Fixed Income Outlook Q1 2014
 
Prudent approach to bond investing part 2
Prudent approach to bond investing part 2Prudent approach to bond investing part 2
Prudent approach to bond investing part 2
 
Corporate Loans to Manage Rate Sensitivity_-_White_Paper
Corporate Loans to Manage Rate Sensitivity_-_White_PaperCorporate Loans to Manage Rate Sensitivity_-_White_Paper
Corporate Loans to Manage Rate Sensitivity_-_White_Paper
 
July 15 I Session 1 I GBIH
July 15 I Session 1 I GBIHJuly 15 I Session 1 I GBIH
July 15 I Session 1 I GBIH
 
Hyre Weekly Commentary
Hyre Weekly CommentaryHyre Weekly Commentary
Hyre Weekly Commentary
 
Kkase capital quarterlyletter q313-1
Kkase capital quarterlyletter q313-1Kkase capital quarterlyletter q313-1
Kkase capital quarterlyletter q313-1
 
Kkase capital quarterlyletter q313-1
Kkase capital quarterlyletter q313-1Kkase capital quarterlyletter q313-1
Kkase capital quarterlyletter q313-1
 
Sprung investment management commentary 4th quarter, 2013
Sprung investment management commentary   4th quarter, 2013Sprung investment management commentary   4th quarter, 2013
Sprung investment management commentary 4th quarter, 2013
 
Rich Ralston – Proactive Advisor Magazine – Volume 3, Issue 10
Rich Ralston – Proactive Advisor Magazine – Volume 3, Issue 10Rich Ralston – Proactive Advisor Magazine – Volume 3, Issue 10
Rich Ralston – Proactive Advisor Magazine – Volume 3, Issue 10
 

Similar to March 2017 Investment Commentary & Performance

December 2017 Investment Commentary & Performance
December 2017 Investment Commentary & PerformanceDecember 2017 Investment Commentary & Performance
December 2017 Investment Commentary & PerformanceAnthony A. Lombardi, CFA
 
March 2018 Investment Commentary & Performance
March 2018 Investment Commentary & PerformanceMarch 2018 Investment Commentary & Performance
March 2018 Investment Commentary & PerformanceAnthony A. Lombardi, CFA
 
March 2019 Investment Commentary & Performance
March 2019 Investment Commentary & PerformanceMarch 2019 Investment Commentary & Performance
March 2019 Investment Commentary & PerformanceAnthony A. Lombardi, CFA
 
December 2019 Investment Commentary & Performance Review
December 2019 Investment Commentary & Performance ReviewDecember 2019 Investment Commentary & Performance Review
December 2019 Investment Commentary & Performance ReviewAnthony A. Lombardi, CFA
 
Global Insight- Quality Check
Global Insight- Quality CheckGlobal Insight- Quality Check
Global Insight- Quality CheckDavid Apted
 
Phylyp Wagner, CFP & Matt Quattlebaum, CFP – Proactive Advisor Magazine – Vol...
Phylyp Wagner, CFP & Matt Quattlebaum, CFP – Proactive Advisor Magazine – Vol...Phylyp Wagner, CFP & Matt Quattlebaum, CFP – Proactive Advisor Magazine – Vol...
Phylyp Wagner, CFP & Matt Quattlebaum, CFP – Proactive Advisor Magazine – Vol...Proactive Advisor Magazine
 
September 2019 Investment Commentary & Performance
September 2019 Investment Commentary & PerformanceSeptember 2019 Investment Commentary & Performance
September 2019 Investment Commentary & PerformanceAnthony A. Lombardi, CFA
 
Market Twitter June 2017 – Narnolia Securities Limited
Market Twitter June 2017 – Narnolia Securities LimitedMarket Twitter June 2017 – Narnolia Securities Limited
Market Twitter June 2017 – Narnolia Securities Limitednarnoliasecurities
 
KDGF Investor letter Feb14
KDGF Investor letter Feb14KDGF Investor letter Feb14
KDGF Investor letter Feb14Kevin Dougherty
 
Investment Mid year outlook by Linked Investments, Ltd
Investment Mid year outlook by Linked Investments, LtdInvestment Mid year outlook by Linked Investments, Ltd
Investment Mid year outlook by Linked Investments, LtdLinked Investments, Ltd.
 
Equity market what to expect in November 2021
Equity market what to expect in November 2021Equity market what to expect in November 2021
Equity market what to expect in November 2021Vinod Prajapati
 
New Market Highs and Positive Expected Returns
New Market Highs and Positive Expected ReturnsNew Market Highs and Positive Expected Returns
New Market Highs and Positive Expected ReturnsRich Schuette
 

Similar to March 2017 Investment Commentary & Performance (20)

December 2017 Investment Commentary & Performance
December 2017 Investment Commentary & PerformanceDecember 2017 Investment Commentary & Performance
December 2017 Investment Commentary & Performance
 
March 2018 Investment Commentary & Performance
March 2018 Investment Commentary & PerformanceMarch 2018 Investment Commentary & Performance
March 2018 Investment Commentary & Performance
 
March 2019 Investment Commentary & Performance
March 2019 Investment Commentary & PerformanceMarch 2019 Investment Commentary & Performance
March 2019 Investment Commentary & Performance
 
December 2019 Investment Commentary & Performance Review
December 2019 Investment Commentary & Performance ReviewDecember 2019 Investment Commentary & Performance Review
December 2019 Investment Commentary & Performance Review
 
Q3 2016 hr
Q3 2016 hrQ3 2016 hr
Q3 2016 hr
 
Global Insight- Quality Check
Global Insight- Quality CheckGlobal Insight- Quality Check
Global Insight- Quality Check
 
Financial Synergies | Q2 2018 Newsletter
Financial Synergies | Q2 2018 NewsletterFinancial Synergies | Q2 2018 Newsletter
Financial Synergies | Q2 2018 Newsletter
 
Financial Synergies | Q3 2018 Newsletter
Financial Synergies | Q3 2018 NewsletterFinancial Synergies | Q3 2018 Newsletter
Financial Synergies | Q3 2018 Newsletter
 
Monthly Perspectives - Volatility - June 2016
Monthly Perspectives - Volatility - June 2016Monthly Perspectives - Volatility - June 2016
Monthly Perspectives - Volatility - June 2016
 
Phylyp Wagner, CFP & Matt Quattlebaum, CFP – Proactive Advisor Magazine – Vol...
Phylyp Wagner, CFP & Matt Quattlebaum, CFP – Proactive Advisor Magazine – Vol...Phylyp Wagner, CFP & Matt Quattlebaum, CFP – Proactive Advisor Magazine – Vol...
Phylyp Wagner, CFP & Matt Quattlebaum, CFP – Proactive Advisor Magazine – Vol...
 
September 2019 Investment Commentary & Performance
September 2019 Investment Commentary & PerformanceSeptember 2019 Investment Commentary & Performance
September 2019 Investment Commentary & Performance
 
Market Twitter June 2017 – Narnolia Securities Limited
Market Twitter June 2017 – Narnolia Securities LimitedMarket Twitter June 2017 – Narnolia Securities Limited
Market Twitter June 2017 – Narnolia Securities Limited
 
Thought for the week 276
Thought for the week   276Thought for the week   276
Thought for the week 276
 
KDGF Investor letter Feb14
KDGF Investor letter Feb14KDGF Investor letter Feb14
KDGF Investor letter Feb14
 
Investment Mid year outlook by Linked Investments, Ltd
Investment Mid year outlook by Linked Investments, LtdInvestment Mid year outlook by Linked Investments, Ltd
Investment Mid year outlook by Linked Investments, Ltd
 
Key questions for the long term investor
Key questions for the long term investorKey questions for the long term investor
Key questions for the long term investor
 
Q2 2021 Financial Synergies Newsletter
Q2 2021 Financial Synergies NewsletterQ2 2021 Financial Synergies Newsletter
Q2 2021 Financial Synergies Newsletter
 
Investment Insights for December, 2017
Investment Insights for December, 2017Investment Insights for December, 2017
Investment Insights for December, 2017
 
Equity market what to expect in November 2021
Equity market what to expect in November 2021Equity market what to expect in November 2021
Equity market what to expect in November 2021
 
New Market Highs and Positive Expected Returns
New Market Highs and Positive Expected ReturnsNew Market Highs and Positive Expected Returns
New Market Highs and Positive Expected Returns
 

More from Anthony A. Lombardi, CFA

June 2020 Investment Commentary & Performance Review
June 2020 Investment Commentary & Performance ReviewJune 2020 Investment Commentary & Performance Review
June 2020 Investment Commentary & Performance ReviewAnthony A. Lombardi, CFA
 
April 2020 Investment Performance Snapshot
April 2020 Investment Performance SnapshotApril 2020 Investment Performance Snapshot
April 2020 Investment Performance SnapshotAnthony A. Lombardi, CFA
 
February 2020 Investment Performance Snapshot
February 2020 Investment Performance SnapshotFebruary 2020 Investment Performance Snapshot
February 2020 Investment Performance SnapshotAnthony A. Lombardi, CFA
 
January 2020 Investment Performance Snapshot
January 2020 Investment Performance SnapshotJanuary 2020 Investment Performance Snapshot
January 2020 Investment Performance SnapshotAnthony A. Lombardi, CFA
 
Investment Performance Snapshot--November 2019
Investment Performance Snapshot--November 2019Investment Performance Snapshot--November 2019
Investment Performance Snapshot--November 2019Anthony A. Lombardi, CFA
 
October 2019 Investment Performance Snapshot
October 2019 Investment Performance SnapshotOctober 2019 Investment Performance Snapshot
October 2019 Investment Performance SnapshotAnthony A. Lombardi, CFA
 
August 2019 Investment Performance Snapshot
August 2019 Investment Performance SnapshotAugust 2019 Investment Performance Snapshot
August 2019 Investment Performance SnapshotAnthony A. Lombardi, CFA
 
April 2019 Investment Performance Snapshot
April 2019 Investment Performance SnapshotApril 2019 Investment Performance Snapshot
April 2019 Investment Performance SnapshotAnthony A. Lombardi, CFA
 
February 2019 Investment Performance Snapshot
February 2019 Investment Performance SnapshotFebruary 2019 Investment Performance Snapshot
February 2019 Investment Performance SnapshotAnthony A. Lombardi, CFA
 
January 2019 Investment Performance Snapshot
January 2019 Investment Performance SnapshotJanuary 2019 Investment Performance Snapshot
January 2019 Investment Performance SnapshotAnthony A. Lombardi, CFA
 
December 2018 Investment Performance Snapshot
December 2018 Investment Performance SnapshotDecember 2018 Investment Performance Snapshot
December 2018 Investment Performance SnapshotAnthony A. Lombardi, CFA
 
November 2018 Investment Performance Snapshot
November 2018 Investment Performance SnapshotNovember 2018 Investment Performance Snapshot
November 2018 Investment Performance SnapshotAnthony A. Lombardi, CFA
 
October 2018 Investment Performance Snapshot
October 2018 Investment Performance SnapshotOctober 2018 Investment Performance Snapshot
October 2018 Investment Performance SnapshotAnthony A. Lombardi, CFA
 
August 2018 Investment Performance Snapshot
August 2018 Investment Performance SnapshotAugust 2018 Investment Performance Snapshot
August 2018 Investment Performance SnapshotAnthony A. Lombardi, CFA
 

More from Anthony A. Lombardi, CFA (20)

July 2020 Investment Performance Snapshot
July 2020 Investment Performance SnapshotJuly 2020 Investment Performance Snapshot
July 2020 Investment Performance Snapshot
 
June 2020 Investment Commentary & Performance Review
June 2020 Investment Commentary & Performance ReviewJune 2020 Investment Commentary & Performance Review
June 2020 Investment Commentary & Performance Review
 
April 2020 Investment Performance Snapshot
April 2020 Investment Performance SnapshotApril 2020 Investment Performance Snapshot
April 2020 Investment Performance Snapshot
 
March 2020 Investment Commentary
March 2020 Investment CommentaryMarch 2020 Investment Commentary
March 2020 Investment Commentary
 
February 2020 Investment Performance Snapshot
February 2020 Investment Performance SnapshotFebruary 2020 Investment Performance Snapshot
February 2020 Investment Performance Snapshot
 
January 2020 Investment Performance Snapshot
January 2020 Investment Performance SnapshotJanuary 2020 Investment Performance Snapshot
January 2020 Investment Performance Snapshot
 
Investment Performance Snapshot--November 2019
Investment Performance Snapshot--November 2019Investment Performance Snapshot--November 2019
Investment Performance Snapshot--November 2019
 
October 2019 Investment Performance Snapshot
October 2019 Investment Performance SnapshotOctober 2019 Investment Performance Snapshot
October 2019 Investment Performance Snapshot
 
August 2019 Investment Performance Snapshot
August 2019 Investment Performance SnapshotAugust 2019 Investment Performance Snapshot
August 2019 Investment Performance Snapshot
 
July 2019 Investment Performance Snapshot
July 2019 Investment Performance SnapshotJuly 2019 Investment Performance Snapshot
July 2019 Investment Performance Snapshot
 
June 2019 Investment Performance Snapshot
June 2019 Investment Performance SnapshotJune 2019 Investment Performance Snapshot
June 2019 Investment Performance Snapshot
 
May 2019 Investment Performance Snapshot
May 2019 Investment Performance SnapshotMay 2019 Investment Performance Snapshot
May 2019 Investment Performance Snapshot
 
April 2019 Investment Performance Snapshot
April 2019 Investment Performance SnapshotApril 2019 Investment Performance Snapshot
April 2019 Investment Performance Snapshot
 
February 2019 Investment Performance Snapshot
February 2019 Investment Performance SnapshotFebruary 2019 Investment Performance Snapshot
February 2019 Investment Performance Snapshot
 
January 2019 Investment Performance Snapshot
January 2019 Investment Performance SnapshotJanuary 2019 Investment Performance Snapshot
January 2019 Investment Performance Snapshot
 
December 2018 Investment Performance Snapshot
December 2018 Investment Performance SnapshotDecember 2018 Investment Performance Snapshot
December 2018 Investment Performance Snapshot
 
November 2018 Investment Performance Snapshot
November 2018 Investment Performance SnapshotNovember 2018 Investment Performance Snapshot
November 2018 Investment Performance Snapshot
 
October 2018 Investment Performance Snapshot
October 2018 Investment Performance SnapshotOctober 2018 Investment Performance Snapshot
October 2018 Investment Performance Snapshot
 
August 2018 Investment Performance Snapshot
August 2018 Investment Performance SnapshotAugust 2018 Investment Performance Snapshot
August 2018 Investment Performance Snapshot
 
July 2018 Investment Performance Snapshot
July 2018 Investment Performance SnapshotJuly 2018 Investment Performance Snapshot
July 2018 Investment Performance Snapshot
 

Recently uploaded

The Path to Product Excellence: Avoiding Common Pitfalls and Enhancing Commun...
The Path to Product Excellence: Avoiding Common Pitfalls and Enhancing Commun...The Path to Product Excellence: Avoiding Common Pitfalls and Enhancing Commun...
The Path to Product Excellence: Avoiding Common Pitfalls and Enhancing Commun...Aggregage
 
Monthly Social Media Update April 2024 pptx.pptx
Monthly Social Media Update April 2024 pptx.pptxMonthly Social Media Update April 2024 pptx.pptx
Monthly Social Media Update April 2024 pptx.pptxAndy Lambert
 
M.C Lodges -- Guest House in Jhang.
M.C Lodges --  Guest House in Jhang.M.C Lodges --  Guest House in Jhang.
M.C Lodges -- Guest House in Jhang.Aaiza Hassan
 
FULL ENJOY Call Girls In Mahipalpur Delhi Contact Us 8377877756
FULL ENJOY Call Girls In Mahipalpur Delhi Contact Us 8377877756FULL ENJOY Call Girls In Mahipalpur Delhi Contact Us 8377877756
FULL ENJOY Call Girls In Mahipalpur Delhi Contact Us 8377877756dollysharma2066
 
Yaroslav Rozhankivskyy: Три складові і три передумови максимальної продуктивн...
Yaroslav Rozhankivskyy: Три складові і три передумови максимальної продуктивн...Yaroslav Rozhankivskyy: Три складові і три передумови максимальної продуктивн...
Yaroslav Rozhankivskyy: Три складові і три передумови максимальної продуктивн...Lviv Startup Club
 
Value Proposition canvas- Customer needs and pains
Value Proposition canvas- Customer needs and painsValue Proposition canvas- Customer needs and pains
Value Proposition canvas- Customer needs and painsP&CO
 
Call Girls Navi Mumbai Just Call 9907093804 Top Class Call Girl Service Avail...
Call Girls Navi Mumbai Just Call 9907093804 Top Class Call Girl Service Avail...Call Girls Navi Mumbai Just Call 9907093804 Top Class Call Girl Service Avail...
Call Girls Navi Mumbai Just Call 9907093804 Top Class Call Girl Service Avail...Dipal Arora
 
Call Girls Pune Just Call 9907093804 Top Class Call Girl Service Available
Call Girls Pune Just Call 9907093804 Top Class Call Girl Service AvailableCall Girls Pune Just Call 9907093804 Top Class Call Girl Service Available
Call Girls Pune Just Call 9907093804 Top Class Call Girl Service AvailableDipal Arora
 
0183760ssssssssssssssssssssssssssss00101011 (27).pdf
0183760ssssssssssssssssssssssssssss00101011 (27).pdf0183760ssssssssssssssssssssssssssss00101011 (27).pdf
0183760ssssssssssssssssssssssssssss00101011 (27).pdfRenandantas16
 
7.pdf This presentation captures many uses and the significance of the number...
7.pdf This presentation captures many uses and the significance of the number...7.pdf This presentation captures many uses and the significance of the number...
7.pdf This presentation captures many uses and the significance of the number...Paul Menig
 
Famous Olympic Siblings from the 21st Century
Famous Olympic Siblings from the 21st CenturyFamous Olympic Siblings from the 21st Century
Famous Olympic Siblings from the 21st Centuryrwgiffor
 
Call Girls Electronic City Just Call 👗 7737669865 👗 Top Class Call Girl Servi...
Call Girls Electronic City Just Call 👗 7737669865 👗 Top Class Call Girl Servi...Call Girls Electronic City Just Call 👗 7737669865 👗 Top Class Call Girl Servi...
Call Girls Electronic City Just Call 👗 7737669865 👗 Top Class Call Girl Servi...amitlee9823
 
Call Girls Jp Nagar Just Call 👗 7737669865 👗 Top Class Call Girl Service Bang...
Call Girls Jp Nagar Just Call 👗 7737669865 👗 Top Class Call Girl Service Bang...Call Girls Jp Nagar Just Call 👗 7737669865 👗 Top Class Call Girl Service Bang...
Call Girls Jp Nagar Just Call 👗 7737669865 👗 Top Class Call Girl Service Bang...amitlee9823
 
Organizational Transformation Lead with Culture
Organizational Transformation Lead with CultureOrganizational Transformation Lead with Culture
Organizational Transformation Lead with CultureSeta Wicaksana
 
Insurers' journeys to build a mastery in the IoT usage
Insurers' journeys to build a mastery in the IoT usageInsurers' journeys to build a mastery in the IoT usage
Insurers' journeys to build a mastery in the IoT usageMatteo Carbone
 
It will be International Nurses' Day on 12 May
It will be International Nurses' Day on 12 MayIt will be International Nurses' Day on 12 May
It will be International Nurses' Day on 12 MayNZSG
 
Mondelez State of Snacking and Future Trends 2023
Mondelez State of Snacking and Future Trends 2023Mondelez State of Snacking and Future Trends 2023
Mondelez State of Snacking and Future Trends 2023Neil Kimberley
 
Enhancing and Restoring Safety & Quality Cultures - Dave Litwiller - May 2024...
Enhancing and Restoring Safety & Quality Cultures - Dave Litwiller - May 2024...Enhancing and Restoring Safety & Quality Cultures - Dave Litwiller - May 2024...
Enhancing and Restoring Safety & Quality Cultures - Dave Litwiller - May 2024...Dave Litwiller
 
Mysore Call Girls 8617370543 WhatsApp Number 24x7 Best Services
Mysore Call Girls 8617370543 WhatsApp Number 24x7 Best ServicesMysore Call Girls 8617370543 WhatsApp Number 24x7 Best Services
Mysore Call Girls 8617370543 WhatsApp Number 24x7 Best ServicesDipal Arora
 

Recently uploaded (20)

Mifty kit IN Salmiya (+918133066128) Abortion pills IN Salmiyah Cytotec pills
Mifty kit IN Salmiya (+918133066128) Abortion pills IN Salmiyah Cytotec pillsMifty kit IN Salmiya (+918133066128) Abortion pills IN Salmiyah Cytotec pills
Mifty kit IN Salmiya (+918133066128) Abortion pills IN Salmiyah Cytotec pills
 
The Path to Product Excellence: Avoiding Common Pitfalls and Enhancing Commun...
The Path to Product Excellence: Avoiding Common Pitfalls and Enhancing Commun...The Path to Product Excellence: Avoiding Common Pitfalls and Enhancing Commun...
The Path to Product Excellence: Avoiding Common Pitfalls and Enhancing Commun...
 
Monthly Social Media Update April 2024 pptx.pptx
Monthly Social Media Update April 2024 pptx.pptxMonthly Social Media Update April 2024 pptx.pptx
Monthly Social Media Update April 2024 pptx.pptx
 
M.C Lodges -- Guest House in Jhang.
M.C Lodges --  Guest House in Jhang.M.C Lodges --  Guest House in Jhang.
M.C Lodges -- Guest House in Jhang.
 
FULL ENJOY Call Girls In Mahipalpur Delhi Contact Us 8377877756
FULL ENJOY Call Girls In Mahipalpur Delhi Contact Us 8377877756FULL ENJOY Call Girls In Mahipalpur Delhi Contact Us 8377877756
FULL ENJOY Call Girls In Mahipalpur Delhi Contact Us 8377877756
 
Yaroslav Rozhankivskyy: Три складові і три передумови максимальної продуктивн...
Yaroslav Rozhankivskyy: Три складові і три передумови максимальної продуктивн...Yaroslav Rozhankivskyy: Три складові і три передумови максимальної продуктивн...
Yaroslav Rozhankivskyy: Три складові і три передумови максимальної продуктивн...
 
Value Proposition canvas- Customer needs and pains
Value Proposition canvas- Customer needs and painsValue Proposition canvas- Customer needs and pains
Value Proposition canvas- Customer needs and pains
 
Call Girls Navi Mumbai Just Call 9907093804 Top Class Call Girl Service Avail...
Call Girls Navi Mumbai Just Call 9907093804 Top Class Call Girl Service Avail...Call Girls Navi Mumbai Just Call 9907093804 Top Class Call Girl Service Avail...
Call Girls Navi Mumbai Just Call 9907093804 Top Class Call Girl Service Avail...
 
Call Girls Pune Just Call 9907093804 Top Class Call Girl Service Available
Call Girls Pune Just Call 9907093804 Top Class Call Girl Service AvailableCall Girls Pune Just Call 9907093804 Top Class Call Girl Service Available
Call Girls Pune Just Call 9907093804 Top Class Call Girl Service Available
 
0183760ssssssssssssssssssssssssssss00101011 (27).pdf
0183760ssssssssssssssssssssssssssss00101011 (27).pdf0183760ssssssssssssssssssssssssssss00101011 (27).pdf
0183760ssssssssssssssssssssssssssss00101011 (27).pdf
 
7.pdf This presentation captures many uses and the significance of the number...
7.pdf This presentation captures many uses and the significance of the number...7.pdf This presentation captures many uses and the significance of the number...
7.pdf This presentation captures many uses and the significance of the number...
 
Famous Olympic Siblings from the 21st Century
Famous Olympic Siblings from the 21st CenturyFamous Olympic Siblings from the 21st Century
Famous Olympic Siblings from the 21st Century
 
Call Girls Electronic City Just Call 👗 7737669865 👗 Top Class Call Girl Servi...
Call Girls Electronic City Just Call 👗 7737669865 👗 Top Class Call Girl Servi...Call Girls Electronic City Just Call 👗 7737669865 👗 Top Class Call Girl Servi...
Call Girls Electronic City Just Call 👗 7737669865 👗 Top Class Call Girl Servi...
 
Call Girls Jp Nagar Just Call 👗 7737669865 👗 Top Class Call Girl Service Bang...
Call Girls Jp Nagar Just Call 👗 7737669865 👗 Top Class Call Girl Service Bang...Call Girls Jp Nagar Just Call 👗 7737669865 👗 Top Class Call Girl Service Bang...
Call Girls Jp Nagar Just Call 👗 7737669865 👗 Top Class Call Girl Service Bang...
 
Organizational Transformation Lead with Culture
Organizational Transformation Lead with CultureOrganizational Transformation Lead with Culture
Organizational Transformation Lead with Culture
 
Insurers' journeys to build a mastery in the IoT usage
Insurers' journeys to build a mastery in the IoT usageInsurers' journeys to build a mastery in the IoT usage
Insurers' journeys to build a mastery in the IoT usage
 
It will be International Nurses' Day on 12 May
It will be International Nurses' Day on 12 MayIt will be International Nurses' Day on 12 May
It will be International Nurses' Day on 12 May
 
Mondelez State of Snacking and Future Trends 2023
Mondelez State of Snacking and Future Trends 2023Mondelez State of Snacking and Future Trends 2023
Mondelez State of Snacking and Future Trends 2023
 
Enhancing and Restoring Safety & Quality Cultures - Dave Litwiller - May 2024...
Enhancing and Restoring Safety & Quality Cultures - Dave Litwiller - May 2024...Enhancing and Restoring Safety & Quality Cultures - Dave Litwiller - May 2024...
Enhancing and Restoring Safety & Quality Cultures - Dave Litwiller - May 2024...
 
Mysore Call Girls 8617370543 WhatsApp Number 24x7 Best Services
Mysore Call Girls 8617370543 WhatsApp Number 24x7 Best ServicesMysore Call Girls 8617370543 WhatsApp Number 24x7 Best Services
Mysore Call Girls 8617370543 WhatsApp Number 24x7 Best Services
 

March 2017 Investment Commentary & Performance

  • 1. ¹Comments and opinions expressed reflect solely the personal views of Anthony Lombardi as of 3/31/17, and not any other individual or firm. Such views are not a recommendation to buy or sell any security, fund or portfolio. Any investment decision should be made in consultation with a financial advisor. MARCH 2017 INVESTMENT COMMENTARY Rice Krispies Treat With our typical investment horizon targeted at ~3-5 years, implicit in this holding period is not simply low turnover (and low cost), but a time-period longer than a 1-term president or congressional representative. In managing our high conviction, concentrated, contrarian, large cap value process, there was no need to scramble adjusting our long-standing views, or portfolio positioning due to a new president, administration and congressional make-up. Our December investment commentary detailed our reasons as to not succumbing to near-term emotions of a new political landscape. As highlighted, we found tremendous irony in market commentary discounting the degree of importance of the extended political period leading up to the presidential election, to only then witness the deluge of opinions and comments, issued shortly thereafter, placing a premium on the importance of investment positioning, complete with recommended portfolio changes best suited for the
  • 2. ¹Comments and opinions expressed reflect solely the personal views of Anthony Lombardi as of 3/31/17, and not any other individual or firm. Such views are not a recommendation to buy or sell any security, fund or portfolio. Any investment decision should be made in consultation with a financial advisor. MARCH 2017 INVESTMENT COMMENTARY (now widely-known) outcome and potential implementation of a policy agenda. Unlike results of an election, investment backdrops do not simply formulate overnight, nor should a disciplined investment process and philosophy seek to radically alter a portfolio’s stock selection and sector allocation in the same vein. We have made repeated comments regarding “Bifurcation” as a key, yet broad, underlying theme, and one that has very much played into the context of our own thinking, and we have pointed to illustrative examples of how multiple lenses can serve to foster swings in investor psychology and emotions; Brexit and the US election serving as perhaps the two most notable during 2016, and a somewhat humbling, and short honeymoon period for a new administration and congress in the early stages of 2017, as yet another. A basic, yet key tenant of successful, repeatable investment outcomes was learned very early on by us, over a favorite morning bowl of cereal. It was continuously reinforced all day in the classroom, still yet again in our multiple extracurricular activities, and then one more heavy dosage provided when we returned home from our day to our parents and family. Listen. Today, as practitioners of our Large Cap Value process, we keep on listening--to a large bowl of data, information and emotions. A mixture of ingredients stretching from the macroeconomic, to the company and sector-specific, we attempt, in a nonrobotic fashion, to discern the meaningful from the white noise, seeking to ingest lean protein in an effort to strengthen our portfolio decision- making. Not everything is as important as its represented, nor is every reaction justified, but these are critical ingredients nonetheless to any market. We continue to listen to the market, the macro backdrop, sectors and company news flow and the swings in investor psychology. Each week, each quarter, each year, each administration, each market and economic cycle has its own unique Snap, Crackle, Pop, and that’s why waking up in this business each day is just as fun as it was sitting at that breakfast table as a kid. The current quarter debut the IPO of “Snap”, a disappearing video/camera-based messaging app company valued at $31+ billion by its 2nd day of trading; the continued “Crackle” of the underlying smoke, ambers and fire of an improving economic backdrop, increasingly higher confidence levels, Fed policy rate increases, escalating earnings expectations, M&A’s continued march and a broadening improvement in global market performance; and, we witnessed the “Pop” of celebratory GOP party balloons, which began spewing the gas of near ecstasy, post an electoral sweep and stock market rally, as unity and a “can-and-will-do” atmosphere was humbled and deflated by infighting, faulty execution, investigations, resignations, speculation and extreme partisanship. By quarter end, pessimistic talking heads spoke of an administration that will not get anything done from a policy perspective. Quite the pendulum indeed, and yet a near perfect example of market emotions at work. No investor, us included, is going to get things right all the time, but we will always bring 100% of our passion for finding contrarian value, stay true to our process, and have unrelenting focus on MOS (margin of safety). Whether a function of near- or intermediate-term fundamentals, and/or investor psychology, our focus remains on recognizing, assessing and seizing upon valuations that potentially present opportunities, be they BUY or SELL. As contrarian, high conviction, long-term investors, employing an active, concentrated, large cap value strategy, such swings serve as a building block in our constant assault seeking out opportunities for entry into, and exit from, investment positions. In implementing our disciplined process, we overlay our longer-term secular view as it pertains to the broader macroeconomic and market backdrop, which results in active sector and stock Source: Kellogg's Corp
  • 3. ¹Comments and opinions expressed reflect solely the personal views of Anthony Lombardi as of 3/31/17, and not any other individual or firm. Such views are not a recommendation to buy or sell any security, fund or portfolio. Any investment decision should be made in consultation with a financial advisor. MARCH 2017 INVESTMENT COMMENTARY exposures. Due to these factors and our assessment, we have maintained a notably contrarian view in our LCV portfolio, with a heavy dose of cheapness, free cash flow and MOS. The great Coach Lombardi (yes, we are biased!) was best able to motivate his players by stepping out of the football environment, bestowing unique, yet powerful life perspectives—something no robot or investment algorithm, can replicate, feel or teach: “…and each day, each week, each year, there is a new encounter, a new challenge. But all of the cheers and all of the color and all of the display linger only in the memory. The spirit, the will to win and will to excel---these are the things that endure and these are the qualities that are so much more important than any of the events that occasion them…the quality of every person’s life has got to be a full measure of that individual’s personal commitment, regardless of what field he may be in.” —Vince Lombardi We just keep listening and implementing; as simple as “Snap, Crackle, Pop”—Process, Process, Process. Portfolio Positioning & Review Throughout 2016 and into early 2017, despite headline valuation of broader indices, we continued to believe numerous individual security opportunities existed across several sectors of the domestic US stock market, boding particularly well for a more concentrated, contrarian strategy. Our conviction has been anchored in a belief that conditions, while not optimal, have been attractive for generating returns over our stated time- horizon, a view that was contrarian to prevailing perceptions, but as noted in our December commentary became a more centrally-held market view post-election. While our LCV portfolio remains fully exposed to all 11 sectors of the market, our focus has been steadfast—a favorable disposition to traditionally cyclical areas possessing compelling valuations, financial statement strength, and where near-term psychology serve to compensate for risk, providing the inherent MOS we seek when investing over a 3 to 5-year time horizon. While conscious of risk factors, we are investors viewing through a risk/reward prism, in active pursuit of opportunities providing the right balance. We believe a combination of cheapness, maintaining a contrarian view, and seeking companies possessing stable balance sheets and attractive FCF characteristics, provides a more compelling alternative to simply positioning our portfolio in a traditionally defensive manor (i.e. high allocations to sectors such as Staples, Healthcare, Utilities, & Telecom). As regular readers of our commentary know, we found such areas of the large-cap market simply too rich, with many individual equities having valuation levels well above the broader market. Most notable in this context has been the lofty valuations in Consumer Staples and Healthcare that existed during the course of 2016. Combined, these latter two sectors comprise ~23% of the S&P 500; materially higher than our 14% target allocation at quarter-end. While other investors may choose to stray to own safety, our value conscious, and process, simply will not allow us to pay any multiple for quality. With the broader S&P 500 trading at ~18x forward EPS, many traditionally defensive areas of the market command multiples at or above this level, particularly when viewed on a purely GAAP basis. We have readily identified quality, balance sheet strength, and cash flows much cheaper elsewhere. Not only is this more acceptable to our value and contrarian-based investment discipline, but also in recognition that forward long- term returns are typically related to point-of-entry valuation multiples. We did not see any need to change our investment views post-election, or post-rally. For us, it’s just about staying true to our process and convictions. Thus, our portfolio positioning, sector allocations and stock positions are largely unchanged at the end of 1Q17, except for actions we took to monetize winners following corporate actions; or where we underscored convictions in existing holdings; or to remain true to process constraints.
  • 4. ¹Comments and opinions expressed reflect solely the personal views of Anthony Lombardi as of 3/31/17, and not any other individual or firm. Such views are not a recommendation to buy or sell any security, fund or portfolio. Any investment decision should be made in consultation with a financial advisor. MARCH 2017 INVESTMENT COMMENTARY Where we think it prudent to rebalance, we continue to make active decisions, but without change to our conviction in the large cap value opportunity set. We are still finding, buying and remaining owners of cheapness, MOS and compelling FCF. When juxtaposed against our belief that favorable operating leverage opportunities exist in the economy, and amongst the companies we target, we remain steadfast in how we desire to position our LCV portfolio. Key Trades & Attribution We seeded a concentrated LCV strategy during the first quarter 2016. Since inception, as opportunities have been presented, we have made several active decisions, at both the stock and sector level. During 1Q17, the most notable actions included: • 100bp DECREASE Energy Sector target • 100bp DECREASE Telecom Sector target • 100bp INCREASE Healthcare Sector target • Selective rebalance trades in individual holdings within CD, CS, IND, TECH & ENE sectors. For the fourth consecutive quarter, fundamentals warranted one full position SALE during 1Q17, as well as one full position BUY, which were not part of the sector allocation changes or rebalancing discussed above. As noted in prior commentaries, target sector weightings are influenced by our top-down and bottom-up views. Year-end 2016 target and market value weights for our LCV portfolio are detailed below. On a market value basis, we ended 1Q17 with marginally higher cash ~0.9% (vs 0.6% 4Q16), below our interim model target of 2.5% (vs 1.5% 4Q16). We have been methodical in deploying available cash, having purposefully set aside some initial dry powder at inception. From a process perspective, our targeted process cash range is designed to provide flexibility, allowing for repositioning within a highly concentrated, yet diversified portfolio. We have a stated preference to monetize winners and/or sell-down positions based on process discipline, in so
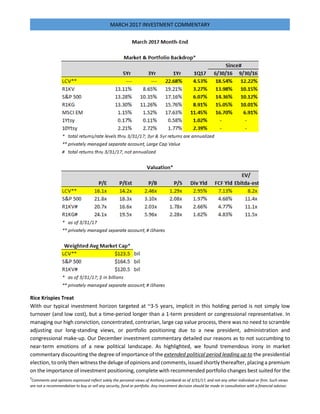
  • 5. ¹Comments and opinions expressed reflect solely the personal views of Anthony Lombardi as of 3/31/17, and not any other individual or firm. Such views are not a recommendation to buy or sell any security, fund or portfolio. Any investment decision should be made in consultation with a financial advisor. MARCH 2017 INVESTMENT COMMENTARY doing avoid placing capital at risk by simply holding investments as place-markers. MOS is paramount for us and is critical in limiting potential downside. Protection of capital is a covenant we are unwilling to break and we firmly believe in utilizing process-permitted cash level when situations dictate, to adhere to this core investment principle. The full sale of CSX Corporation (CSX) in the March 2017 quarter, following a ~100% gain since purchase, the full sale of Time Warner (TWX) in the December 2016 quarter following the announced acquisition by AT&T (T), and the full sale of St. Jude Medical (STJ) during the June 2016 quarter following the announced acquisition by Abbott Labs (ABT), serve as prime examples of our cash/MOS discipline, as do significant rebalancing trades executed during the past year. In fact, our individual rebalance trades of ~50bps to ~100bps are likely equal to another, less concentrated, lower conviction manager’s target position sizes. Investment Performance. For the March quarter, our LCV portfolio generated total return of 4.53% vs the Russell 1000 Value (R1KV) return of 3.27%, and broader S&P 500 return of 6.07%. For the full year ended March, our LCV portfolio generated total return of 22.7% vs R1KV return of 19.2% and broader S&P 500 return of 17.2%. Our portfolio’s outperformance of +126bps vs R1KV in the March quarter reflected continued high convictions, underscored by several material portfolio actions throughout the past several quarters, including opportunistically managing available cash. The portfolio’s characteristics continue to reflect a disciplined, contrarian, value-oriented process. To this end, despite strong outperformance in 2016-2017, the portfolio remains material cheaper across nearly every valuation metric, notably boasting higher yields (dividend & FCF) when compared to the broader S&P 500, and R1KV, our primary value benchmark. From a performance attribution standpoint, versus the R1KV, Allocation was positive while Security Selection was a very modest negative contributor during the March quarter, amounting to ~+133bps and ~-7bps, respectively. Industrials, Technology and Energy were the most significant contributors in total attribution, while Financials and Consumer Staples were the most significant detractors. By Allocation, the Energy and Technology sectors had the largest positive attribution, while Healthcare and Consumer Staples were the largest negative contributors. By Stock Selection, Industrials were the single largest contributor, while Financials were the single largest drag. On an absolute basis, our portfolio had three sectors decline quarter/quarter; Energy, Telecom and Financials. Within the R1KV, both Energy and Telecom experienced declines. Since inception, no sectors in our LCV portfolio, or the R1KV, declined on an absolute basis. During 1Q17, we made several active decisions to both increase certain stock and sector level weightings while reducing others, reflective of process, our conviction level and targeted investment opportunities. Included in these actions were decisions to exit one full position, while correspondingly establishing one new full position, both which occurred in Industrials, negating any change in target weighting for the sector in aggregate. While there was modest change in portfolio liquidity when comparing period-end amounts, holding idle cash intra-quarter was an active decision on our part, prior to deploying funds after the sale of CSX, and sector target reductions in Energy and Telecom. During the quarter, our cash position was a benefit, providing a tailwind of ~5bps. Energy target weighting reduced 100bps: 6.00% to 5.00% Energy remains our most pronounced exception to our favorable cyclical bias, with our portfolio allocation emphasizing a strategic decision to be prudent and mindful of our concerns. Notably, we took process-related action during 1Q17 to further REDUCE our sector allocation. Process is key for us, and we listen to our process and actively implement it, otherwise there is no process. With the S&P 500 weighting at ~6.60%, the maximum
  • 6. ¹Comments and opinions expressed reflect solely the personal views of Anthony Lombardi as of 3/31/17, and not any other individual or firm. Such views are not a recommendation to buy or sell any security, fund or portfolio. Any investment decision should be made in consultation with a financial advisor. MARCH 2017 INVESTMENT COMMENTARY we could allocate to the sector is ~9.90%. Strategically we desire to remain meaningfully underweight, thus our Energy sector target was cut 100bps to 5%, from 6%, which at quarter-end was ~160bps and ~715bps below S&P 500 and R1KV, respectively. As we have previously stated, we believe the sector to be a quintessential “value trap”. While cognizant of the rally from lows hit a year ago, WTI remains more than 50% below its 2014 highs, as do many energy-related share prices. Our fundamental concerns remain the same and, in our opinion, will take several years to fully play out. Our view has been premised upon a multitude of macro, secular and company specific issues, ranging from demand/supply imbalance, record inventories, technological change, a less influential OPEC in the context of history, corporate restructurings, balance sheet repair and various short/long- term macro factors across developed and emerging market countries. Among major concerns we continue to have is the ability of companies to generate meaningful and requisite FCF over our typical investment horizon, unfavorable balance sheet developments (write-downs, dilutive capital raises, fire sale prices of assets, etc.) and constrained capital management owing to multiple stress points in the end-market. As a result, we remain very cautious given this view, in a sector more technically-driven than others, and where itchy fingers rest on production triggers ready to pull upon any sustained price appreciation in the commodity. In the end, the most significant constraint is valuation. Many large cap Energy valuation multiples (Book Value, EBITDA, EPS, FCF yield, etc.) on a trailing and forward basis are not compelling, indeed they remain quite expensive or non-existent (due to limited or nominal level of earnings), leverage remains high and FCF is negative-to-modest during the next 2 years, particularly should capital expenditures be ramped back up. Against the Energy sector’s current near-term fundamentals, and unfavorable secular backdrop, we remain of the opinion a bifurcated, underweight allocation is most appropriate given our low level of conviction. Setting out to be a hero against major secular changes, heightened visibility challenges for management, and a technically-driven sector, is not an appetizing proposition looking out the next few years. We’d much rather pursue less direct, alternative opportunities to gain commodity-related exposure, in situations possessing better MOS and/or more compelling risk/reward, while maintaining a direct underweight allocation vs the Energy sector. In the event of lower-for-longer energy prices, we believe there to be other potential beneficiaries that are more compelling. As stated in our December commentary, 2017 should prove interesting as to whether end- market prices and production levels hold, as well as the degree to which management teams stay true to the required financial discipline to justify share prices. We believe there to be a significant difference in business models and financial flexibility across the sector, anticipating many restructurings and cash flow recoveries will likely come up well short. Telecom target weighting reduced 100bps: 4.0% to 3.0% As was the case with Energy, our Telecom target weighting was cut 100bps, driven by process. We have closely followed this sector’s evolution the past 20 years, and seen its weighting in the S&P 500 continue eroding, with it now the smallest market cap weighting of 11. While the performance of other sectors has contributed to Telecom’s shrinkage, we have found this secular development notable in the context of low nominal interest rates and, more surprisingly, the massive amount of inter- and intra-industry consolidation that has taken place over the prior two decades. Thus, even with Telecom survivors buying their “own”, acquiring media and communications companies residing in Consumer Discretionary, as well as acquiring in Technology, this “transfer of market cap” has not been enough to stop the compression in the sectors representation in the S&P 500. With the its weighting at ~2.40% in the S&P 500, from a shear process standpoint the maximum we could allocate to
  • 7. ¹Comments and opinions expressed reflect solely the personal views of Anthony Lombardi as of 3/31/17, and not any other individual or firm. Such views are not a recommendation to buy or sell any security, fund or portfolio. Any investment decision should be made in consultation with a financial advisor. MARCH 2017 INVESTMENT COMMENTARY the sector would be ~3.60%. With process pointing us lower, and with yield and valuations more readily available and compelling elsewhere, potential risk of further business model and shareholder dilution rising, and the reduced prospect for material lift in the sector’s representation in the S&P 500, we made the active decision to cut 100bps from Telecom. Despite the reduction, the sector remains on watch for us for potential further actions should fundamentals warrant. As a reminder, we sold our full position in TWX last quarter, realizing significant appreciation following the announced (and still pending) acquisition by AT&T, a stock we prefer not to own. Healthcare sector target weighting increased 100bps: 8.0% to 9.0% We have been long critical of the unappetizing valuation levels, and the lack of contrarian names within the defensive complex of the market, most notably Consumer Staples and Healthcare. Combined, our target allocation to these two sectors has been at drastically lower levels, ~1000bps, during the past year. In the June quarter of 2016, we monetized our position in STJ (4% target) following the announced acquisition by ABT, reallocating only 200bps back into HC which left our target sector weighting at 8% versus an original 10%. On the heels of increased pessimism, fears emanating from both political party’s having the industry in the crosshairs, and select weakness in biotech, pharma, facilities, and device stocks, modestly more compelling valuations materialized in HC sector. While by no means a wholesale change, the sector began offering a bit more opportunity, particularly when compared to the Energy and Telecom complex; two areas where we reduced allocations during the quarter. That said, we retain a material underweight allocation to HC, ~ 500bps versus the S&P 500 at quarter-end. Industrial target weighting unchanged & overweight, having executed one FULL SALE and one FULL BUY: 14.5% During 1Q17, we executed the full SALE of CSX Corporation, which funded the purchase of a new position within IND. The CSX sale, and subsequent new purchase maintained our IND allocation at 14.5%, a sector where the maximum allowable process weighting was ~15% at quarter-end. The IND sector target overweight reflects our conviction in a long-standing, favorable cyclical view, and the opportunity set available amongst individual security holdings. The purchase and sale of CSX serves as a microcosm of our disciplined, contrarian value-based process. At time of original purchase and portfolio inception, CSX was our lone 2% individual target position, reflecting our desire to leave some dry powder available for utilization. During the June 2016 quarter, we executed a 100bp increase in our target weighting in CSX, which resulted in an average cost of $25 for the full 3.0% position. Our reasons for CSX purchase were multifold: • Cyclical exposure, and a desire to reflect our contrarian view of a stronger economic backdrop and prospect for further improvements; transportation and cyclical exposure on rails. • Market position: CSX #3 of 7 North American rails; Eastern oligopoly along with Norfolk Southern; 20k route miles and 23 states. Not just about coal but market focus was acting to compress valuation and sentiment; Intermodal represented ~ 50%; significant operating cost benefit opportunity and operating leverage improvement expected to be realized; IoT world very much needs transport side of economy. • Contrarian: 45%-50% Hold/Sell-rating by analyst community combined with stock underperformance. • Balance sheet: BBB+ senior credit rating • Valuation: Div. yield 3.0%, FCF yield 3.4%, P/E 12x fwd, P/Sales 2.0x, EV/Sales 2.8x, P/Book 2.0x, EV/EBITDA 6.7x
  • 8. ¹Comments and opinions expressed reflect solely the personal views of Anthony Lombardi as of 3/31/17, and not any other individual or firm. Such views are not a recommendation to buy or sell any security, fund or portfolio. Any investment decision should be made in consultation with a financial advisor. MARCH 2017 INVESTMENT COMMENTARY Our reasons for sale were due to material changes in both valuation and sentiment (macro and company- specific). CSX had gone from a very inexpensive cyclical stock with low expectations to one that became fully valued. The company experienced a complete swing in expectations regarding operating improvement based upon the insertion of a new CEO, in concert with an activist investor. In one day in mid-January, its share price increased 22%. In the span of our one year holding period, CSX share price appreciated ~100% and several valuation multiples noted above doubled, while dividend yield was halved and FCF yield declined to 3% (despite a doubling in FCF $ expectations). Analyst consensus target price for CSX increased to ~$55 from ~ $27 at time of purchase. Given significant change in valuation and sentiment, and our disciplined focus on MOS, we fully exited CSX after the price action. Following an active decision to hold temporary cash, we proceeded with funding a full 3% purchase of a targeted position in IND prior to quarter-end. This new position met all parameters of our investment process and philosophy, particularly with respect to compelling valuation and contrarian in nature. Our remaining action in the IND sector during the quarter was the rebalance of one additional position down to target of 3.00%. Consumer Discretionary: No sector weight change; 3 rebalance trades to target Following last quarters full sale of Time Warner (TWX), we executed 3 rebalance trades within CD during the first quarter to bring positions to targeted levels. Two positions were rebalanced up to target levels while a third position was sold down to target. Cumulatively, these three actions involved ~325 bps of portfolio market value. Our sector target allocation remained 16.5%, an active overweighting of ~420bps versus the S&P 500. Information Technology: No sector weight change; 2 rebalance trades to target Within TECH, among the strongest sector performers, we trimmed back two positions to initial targets. Cumulatively, these transactions comprised nearly 50bps of portfolio market value, however our TECH sector target remained unchanged at 21%, ~110bps lower versus the S&P 500 at quarter-end. Compared to the R1KV, our targeted TECH sector weighting represented ~1100bps of overweight, reflecting our conviction in both the macro and company-specific backdrops pervasive throughout our LCV portfolio. Consumer Staples: No sector weight change; rebalance to target As in Healthcare, we remain materially underweight CS sector owing, in our opinion, to very rich valuations. The sector has garnered M&A-related interest and has been an overcrowded defensive vehicle. Our process and philosophy, along with our contrarian mindset and focus on MOS, provides for very little in the way of opportunity set. From a macro perspective, we remain gearing the portfolio elsewhere. That said, we did make an active decision to utilize ~ 60bps of portfolio market value to rebalance up to target within the CS sector. Cash level up 100bps Our portfolio target cash level increased versus year-end, from 1.50% to 2.50%, as we continued making active use of permitted process cash levels during the quarter through the execution of various actions noted above. From a market value perspective, cash level was 0.9% at quarter-end. Market and Economic backdrop We have highlighted with each commentary key underlying themes in the backdrop, and at the top of the list each quarter has been the constant, and unfortunate events of terrorism. This past quarter was no different, as
  • 9. ¹Comments and opinions expressed reflect solely the personal views of Anthony Lombardi as of 3/31/17, and not any other individual or firm. Such views are not a recommendation to buy or sell any security, fund or portfolio. Any investment decision should be made in consultation with a financial advisor. MARCH 2017 INVESTMENT COMMENTARY the events in London during the last week of March served as the most recent. Throughout the world, we all have continued to witness numerous such attacks, devastation and personal tragedies as thousands of innocents were injured, or lives lost. Each time, first responders and the collaborative efforts by all areas of law enforcement are to be commended. However, with each such event, we are also reminded of a world dynamic which has changed, is ever present, and requires continued global attention for such cowardly acts. The world cannot afford to be bifurcated in its stance against this enemy, nor can it ever succumb. In like a lion, out like a lamb. The broader US equity market posted relatively strong performance on the heels of a post-election fourth-quarter rally, with growth and emerging markets posting upside that would be respectable for a full year. Entering early March, however, emotions and concerns within the US began to rise as a celebratory mood and honeymoon period for a new administration quickly hit an early expiration date. In 1Q17’s first nine weeks, the S&P 500 experienced a ~7% increase, prior to declining ~1.3% from an intra-quarter peak to close out the quarter +5.5%, on a price basis. For the quarter, the S&P 500 posted a 6% total return, with notably wide variance by sector and industry group. Growth (Russell 1000) meaningfully outperformed Value by ~565bps, while Emerging Markets (MSCI) more than one-upped the entire pack, posting a +11.5% total return. U.S. interest rates, and spreads, which had been on a continued path lower for some time, appear to have bottomed given broad expectations for improved growth, higher inflation, and changes in monetary and fiscal policy. Across the globe, the performance of stock markets (total returns, U.S. Dollars) was bifurcated, but only in terms of degrees of strength, both versus the US and 4Q16’s results: Mexico +17.3% (vs -8.9% in 4Q16), Brazil +12.1% (vs +3.0%), Australia +10.7% (vs -1.7%), Hong Kong +9.9% (vs -5.3%), France +7.1% (vs +3.0%), UK +5.3% (vs -0.7%), Japan +4.4% (vs +1.2%) and China +1.8% (vs -5.2%). For the quarter, the S&P 500 posted +5.5% price increase. Comparatively, the R1KV fell below the broader market, at +2.6%, and meaningfully below R1KG, at +8.5%, with Technology sector strength and Financial sector weakness driving much of the differential. Notably, spread compression across the term structure occurred in the quarter, driven by rising short-end and a pull-back in long rates. As measured by the 10-year US Treasury yield, the benchmark rate began 2016 at 2.27%, declined to 1.47% by the end of 2Q16, 2.45% by year-end, prior to finishing 1Q17 at 2.39%. Yield curve slope, using 1yr-10yr spread, which had expanded to ~ 165bps at year-end 2016, subsequently declined to ~ 140bps at end of 1Q17, a level also well below ~205bps, 5-years prior. The combination of a strong 4Q16 rally, spread compression and swings in psychology regarding the new administration’s anticipated success at implementing its policy agenda drove much of the weakness in Financials during 1Q17. As noted last quarter with respect to monetary policy: “with the first two moves out of the way, and the election season over, we would not be surprised to see a more fluid pace of change regarding monetary policy should situations warrant. This would include the possibility of at least one 50bp change amongst the current unit count of rate change decisions anticipated, and/or more action steps than currently discounted by the market.” We continue to believe data dependency will remain the foundation for monetary policy, with any changes needing to justified by the backdrop—the latter which we have been positively disposed for some time, and expect to continue driving interest rate movements and policy. At this stage of the domestic economic, monetary and fiscal policy cycles, we remain less focused upon unit count of rate increases anticipated by the market and more biased to the level of potential rate changes, and the impact such step-changes could serve to vastly exceed market expectations. We would also expect to see more transparent discussions from the Fed regarding policy
  • 10. ¹Comments and opinions expressed reflect solely the personal views of Anthony Lombardi as of 3/31/17, and not any other individual or firm. Such views are not a recommendation to buy or sell any security, fund or portfolio. Any investment decision should be made in consultation with a financial advisor. MARCH 2017 INVESTMENT COMMENTARY actions pertaining to more active reduction of its $4.5 trillion in assets. At times, this part of monetary policy seems to be lost amongst the market’s laser focus, and expectations upon, the unit count of rate increases in the forward 12-month calendar. Capital allocations and priorities are likely to change. We reiterate we would not be surprised to witness corporate actions that lead to a re-ranking of capital management priorities given potential for more favorable tax code, deregulation, improving economic activity and executive management confidence, along with a corresponding increase in capital and human resource investment. Such changes could have negative implications for the level and/or pace of share repurchases and dividend increases witnessed during the recovery period since the trough of the financial crisis, and likely vary by sector. To this end, given underlying performance of the stock market, simple mathematics suggest lower marginal buying power of previously approved, and remaining buyback authorizations. Still further yet, finance 101 would suggest higher valuation multiples present as less appetizing to corporate CFO’s and Treasurers, acting as an incremental constraint. We also remain cognizant that saber rattling regarding manufacturing and trade could create the potential for supply chain issues to become quite noteworthy. With exposure to several such factors, we note the Tech sector remains squarely in these cross-hairs, both positive and negative. As typically the case, earnings and free cash flow generation will be serve as a key driver of the ultimate determinant of capital allocation. Volatility remains in check. Market volatility, as measured by the CBOE Volatility Index (VIX) remains at relatively subdued levels, hitting a post inaugural low of 10.6 in the final week of January 2017. At quarter-end, the VIX rested at 12.4, still near 5-year lows. In fact, since 1990, a year marked by the precipice of a multiyear financial crisis (and recession) involving S&L’s and commercial banks, the low mark on the VIX has been 9.3, and the average, 19.6. During the past year, exceptions were an immediate, post-UK “Brexit” vote increase in late June, a less prominent VIX increase in late September, and the early November spike related to U.S presidential election. Notably, each of the three most prominent spikes during 2016 was successively less than prior peak. Recent FOMC decisions; intra-meeting commentary regarding rate policy; swirling, divisive and emotional political winds blowing in Washington during the first 70 days of a new administration, and political disruptions across the globe have had less of an impact on the VIX than either two major votes: Brexit and the U.S. presidential election. The U.S. Dollar remains strong, while oil retreats. Given the confluence of global events, relative strength of the U.S. economic backdrop, and perceived safety of U.S. capital markets, we have been of the view that a dire outcome for the Dollar will remain an unlikely scenario in the near-to-intermediate term. The Dollar index (DXY) has meaningfully held its post-Brexit increase, only modestly declining from a 10-year high attained during 4Q16. Capital investment and potential cross-border M&A, utilizing a stronger currency, are potential benefits of the Dollar’s strength. Further, to the point where any such investments or acquisitions lead to internationally parked cash, any potential favorable tax changes allowing for repatriation would serve as an incremental benefit from internationally exposed businesses. Oil, along with other commodities, retreated during the quarter, following a modest recovery in the prior quarter, the latter due in part to OPEC members formalizing production cuts, subsequently executed during the last few months. While up sharply from a February low of $26, the front-end contract for oil remains ~50% below its 2014 high, underscoring a basic, yet painful investment fact: a 50% loss requires a 100% recovery. Beyond the risks previously highlighted with respect to high inventories, technological
  • 11. ¹Comments and opinions expressed reflect solely the personal views of Anthony Lombardi as of 3/31/17, and not any other individual or firm. Such views are not a recommendation to buy or sell any security, fund or portfolio. Any investment decision should be made in consultation with a financial advisor. MARCH 2017 INVESTMENT COMMENTARY benefits and change, potential production cut slippage amongst OPEC, and production triggers being pulled by U.S. producers, a further constraint on materially higher price levels is the potential headwinds to economic growth that could metastasize with any further material rise in WTI. Oil bulls should be mindful of what they wish. Balance sheet actions, including divestitures, by several companies were announced during 1Q17, and we expect more to follow—we are just not in any rush to add portfolio exposure given better opportunities elsewhere. Confidence of management and boards to take on risk, evidenced by appetite to do deals spanning various sectors and geographies, remains high. Among some notable announcements and news flow in 1Q17: J&J/ATLN ($30 bil all Cash), Reckitt Benckiser/Mead Johnson ($18 bil all Cash), and Intel/Mobileye ($14 bil all Cash). A proposed KHC/ULVR ($163 bil) acquisition was withdrawn almost as quickly as the market became aware and started crunching numbers, but target speculation continues for KHC. An unsolicited ($24 bil) bid for Akzo Nobel by PPG, remains active. Rumor and speculation has continued to percolate regarding several names in media & telecom, including a potential large move by Verizon, possibly for CHTR (~ $100 billion market cap), and the prospect of CMCSA stepping into the acquisition ring again (having taken a $500 million position in SNAP’s IPO). Hudson Bay purportedly sniffed and walked from a $10 billion highly leveraged deal involving Macy’s, but may still be on the prowl. Two other large deals in healthcare fell apart under pressure, most notably from the courts and/or DOJ, including the $50.4 billion ANTM/CI acquisition, and the $29.4 billion AET/HUM acquisition. Legal- related matters are still pending. From an economic perspective, 4Q16 Real GDP most recent revision was +2.1%, with 1Q17 estimated at +1.9%. Forward estimates for 2017 and 2018 remain unchanged, currently +2.2% and +2.3%, respectively. The labor market has witnessed continued improvement, generally posting nonfarm payroll gains of ~150k-300k/month since 2013, versus crisis level losses of ~ 900k/month in 2008-09. The most recent print was +235k. The unemployment rate remains relatively steady, having declined ~ 500 bps from its peak, with estimates tracking at 4.6% and 4.5% for 2017 and 2018, respectively. As noted in our prior commentaries, despite the labor market backdrop, aggregate economic growth has yet to accelerate. Fed commentary has continually underscored policy maker’s data dependency, with a bias to more than just U.S. economic conditions. Most notable has been the shift in the Fed’s holding pattern, to a much-anticipated policy rate increase cycle. This change has mimicked the increased hawkishness that appeared to be stirring in FOMC statements, despite longer-term projections of growth and rate levels (the dots) in the Fed forecasts having previously been declining. Given global monetary stimulants that have existed for some time, and with the prospect of added Fiscal accelerants, monitoring of price and wage inflation metrics remain at the forefront, and pressure has been warming a bit here. We have repeatedly underscored our belief that there is a good amount of operating leverage in the system, that can be readily monetized for the benefit of shareholders/consumers should top-line revenue (& GDP) growth move sustainably higher. We have also been cognizant of the amount of monetary stimulus that has occurred without a meaningful ramp in GDP, but in the context of the magnitude of the deepness of the economic hole, a longer ladder was required. Our comfort level in having positioned with a more cyclical bias remains founded upon valuation multiples and balance sheet/cash flow conditions of the company’s we both seek, and own, as well as the corporate actions and broader economic conditions we continue to witness, and expect—all which well- preceded the election results last year.
  • 12. ¹Comments and opinions expressed reflect solely the personal views of Anthony Lombardi as of 3/31/17, and not any other individual or firm. Such views are not a recommendation to buy or sell any security, fund or portfolio. Any investment decision should be made in consultation with a financial advisor. MARCH 2017 INVESTMENT COMMENTARY A stop at the Five and Dime; positive earnings picture likely to continue. Heading into 1Q17 earnings season, based on FactSet data, aggregate S&P 500 EPS on a reported basis are estimated at ~ $29.49, representing a year/year increase of ~ 9%. Compared to December 31, the estimated 1Q17 earnings growth for the S&P 500 has dropped ~ 4%. Estimates typically come down during a quarter. However, current and recent quarter downward trajectories have been less than average due to a combination of lower cuts by analysts, a reduced level of negative guidance by companies and generally easing comps in the more pressured sectors. Top-line revenue growth forecast of 7.2% has declined modestly vs December 31, with implied margin stability in the aggregate, as well as positive leverage in outer quarters (in line with our long-held view). Basic math of the market supports the margin trajectory given the underlying weighting of the high-level contributors, notably Technology (22% of S&P 500 market cap) and the declining weight of the largest detractors, notably Energy (6.5% of S&P 500 market cap). Should earnings growth increase in 1Q17 as expected, it will represent the 3rd consecutive quarter of y/y improvement, following 6 quarters of decline prior. Beyond Technology, a large part of the earnings turn has been an improving picture for Financials and the lapping of poor comparisons within the commodity complex, the latter most visible in the Energy sector. While the level of degradation within Energy has apparently run its course, we believe a long and uncertain road remains ahead. The sector has transitioned from the precipice of negative comparisons. FY16 earnings and revenue for the Energy sector declined ~ 76% and ~ 18% y/y, respectively, and are expected to post gains of ~ +300% and ~ +22% in FY17. On a reported basis, 8 of 11 sectors are expected to be in positive territory for the quarter, with Industrials, Telecom and Consumer Discretionary in the red. Energy and Financials possess the highest expected improvement. Recall also, that our two most significant underweight portfolio allocations are amongst the most sizeable sectors of market; traditionally defensive areas of Healthcare and Consumer Staples. Notably, 1Q17 estimates have declined quite dramatically during the past 90 days for HC and CS, to +0.5% (vs +4.0%) and +1.6% (+6.2%), respectively. As we underscored last quarter, given a strong post-election rally in the market and the turn in aggregate earnings during the last few quarters, the most relevant issue during earnings season will be management commentary and affirmation of guidance for 2017. It has not only been President Trump’s first 70 days, but also 70 days for which management teams and boards have had the chance to better assess the overall climate and backdrop. Our “listening” of the market suggests the underlying positive “Crackle” for the macro and company specific remains in place. Currently, the outlook for 2017 is for estimated top-line growth of ~ +5% y/y and earnings growth of ~ 10%, what we have affectionately called a “Five & Dime” picture for the market backdrop (5% top and 10% bottom-line growth). By sector, the picture is quite different, with bifurcation in earnings led by Energy and Utilities (only sector estimated to be down) at the extreme tails of expectations. As both these sectors are materially smaller in market capitalization, we reiterate the more relevant story to monitor during the year will be those sectors within the tails. All else constant, the basic math of the market’s forward P/E would suggest it may not be as rich as generally perceived when viewed in the context of the Technology sector’s high profit margins, the Financial sector trading at less than 15x forward EPS, and Energy trading at nearly 30x. Bottom line: As contrarians, we are attracted to many facets in the backdrop noted above, particularly those that underscore the fundamental and emotional swings part of any natural market environment. It is the short- to-intermediate term fluctuations which provide the right backdrop for us to position our portfolio for the long- term at both the sector and security level. While we have noted selective areas of the market as expensive (namely traditionally defensive, higher quality sectors and a fundamentally challenged commodity complex),
  • 13. ¹Comments and opinions expressed reflect solely the personal views of Anthony Lombardi as of 3/31/17, and not any other individual or firm. Such views are not a recommendation to buy or sell any security, fund or portfolio. Any investment decision should be made in consultation with a financial advisor. MARCH 2017 INVESTMENT COMMENTARY many of the cyclical areas remain compelling to us. If one simply focuses on the aggregate level of the market, to include broader market earnings growth, valuation metrics, GDP growth, and nominal debt levels the backdrop might be viewed challenging. We prefer to go deeper, into sectors and individual stocks, assess related fundamentals and metrics, place broader macroeconomic measures such as GDP growth into context, and break apart aggregate metrics such as debt into more relevant measures such as net debt, interest costs and coverage ratios, etc. In so doing, we have been quite bullish as to the opportunity set in our concentrated, yet diversified large cap value strategy. That is not to say the opportunity set would be the same for other investors in different or less-concentrated strategies. As long-term investors, we remain focused on executing a consistent process, buying cheapness and not over-paying for quality. As disciplined contrarians, mindful of capital protection, we continue to find the cyclical sectors, ex-energy/commodities, home to stocks with the most compelling valuations relative to the broader market. Given our contrarian nature, we are also cognizant of consensus continuing to move in our direction during 2016 and early 2017, although much of the change was back-end loaded, and not universal across the macroeconomic, sector or individual stock landscape. Nevertheless, we remain quite sensitive to the shifts that have occurred, and our radar is certainly dialed up for changes that cause swings in the pendulum too far in any one direction. Conviction is key for us, and is reflected in our portfolio actions. Most importantly, with any company, it is those possessing characteristics strong in balance sheet and free-cash flow, combined with compelling equity valuation, that garner our attention--these remain the type of roommates we prefer when seeking opportunity and MOS. AAL Document is meant to be used in its entirety. Reference to prior quarterly and monthly publications is noted. Views expressed represent personal assessment of privately managed separate account and market environment as of the date indicated, and should not be considered a recommendation to buy, hold or sell any security, and should not be relied on as research or investment advice. Information is as of the date indicated and subject to change. All market and other related information relied upon and mentioned is from market data sources viewed as reliable. No guarantees are made regarding accuracy. Index returns are for illustrative purposes only. Index performance returns do not reflect any management fees, transaction costs or expenses. Indexes are unmanaged and one cannot invest directly in an index. Past performance does not guarantee future results. The S&P 500 Index measures the performance of 500 mostly large-cap stocks weighted by market value, and is often used to represent performance of the U.S. Stock market. The Russell 1000 Value Index measures the performance of the large-cap value segment of the U.S. equity universe. It includes those Russell 1000 companies with lower price-to-book ratios and lower forecasted growth values. The Russell 1000 Growth Index measures the performance of the large- cap growth segment of the U.S. equity universe. It includes those Russell 1000 companies with higher price-to-book ratios and higher forecasted growth values. Russell Investment Group is the source and owner of the trademarks, service marks, and copyrights related to the Russell Indexes. Russell® is a trademark of the Russell Investment Group. iShares® Funds are distributed by BlackRock Investments, LLC. The iShares Funds are not sponsored, endorsed, issued, sold or promoted by Russell Investment Group. Nor does this company make any representation regarding the advisability of investing in iShares Funds. BlackRock is not affiliated with the company listed above. iShares® and BlackRock® are registered trademarks of BlackRock, Inc., or its subsidiaries. MSCI Emerging Market index is an index created by Morgan Stanley Capital International (MSCI), designed to measure equity market performance in global emerging markets. The Emerging Markets Index is a float-adjusted market capitalization index. MSCI®, and the MSCI index names are registered trademarks of MSCI Inc. or its affiliates. Where noted, S&P 500® Index, Russell 1000® Value Index, Russell 1000® Growth Index, iShares® Russell 1000 Value ETF and MSCI® Emerging Market Index are referenced with abbreviations and respective footnotes. Abbreviations include S&P 500, R1KV, R1KG and MSCI EM. Use of iShares ETF for a respective
  • 14. ¹Comments and opinions expressed reflect solely the personal views of Anthony Lombardi as of 3/31/17, and not any other individual or firm. Such views are not a recommendation to buy or sell any security, fund or portfolio. Any investment decision should be made in consultation with a financial advisor. MARCH 2017 INVESTMENT COMMENTARY index is footnoted accordingly and/or mentioned as such. Performance commentary comparisons are made in reference to iShares, unless otherwise noted. Performance quoted represents past performance and does not guarantee future results. Investment return and principal value of an investment will fluctuate, and when sold, may be worth more or less than original cost. Returns for less than one year are not annualized.