June 2018 Investment Commentary & Performance
•
1 like•133 views

Second-Quarter 2018 Market & Portfolio Review

Recommended
Recommended
More Related Content
What's hot
What's hot (20)
Similar to June 2018 Investment Commentary & Performance
Similar to June 2018 Investment Commentary & Performance (20)
More from Anthony A. Lombardi, CFA
More from Anthony A. Lombardi, CFA (20)
Recently uploaded
Recently uploaded (20)
June 2018 Investment Commentary & Performance
- 1. ¹Comments and opinions expressed reflect solely the personal views of Anthony Lombardi as of 6/30/18, and not any other individual or firm. Such views are not a recommendation to buy or sell any security, fund or portfolio. Any investment decision should be made in consultation with a financial advisor. JUNE 2018 INVESTMENT COMMENTARY1
- 2. ¹Comments and opinions expressed reflect solely the personal views of Anthony Lombardi as of 6/30/18, and not any other individual or firm. Such views are not a recommendation to buy or sell any security, fund or portfolio. Any investment decision should be made in consultation with a financial advisor. JUNE 2018 INVESTMENT COMMENTARY1 Mid-Term Exams and Coyotes Oh, that pendulum how we adore thee. Ninety days ago, we highlighted the first down quarter posted by the S&P 500 since the third-quarter of 2015. While the hangover seemed to subside in the US, the cocktail shaker was clearly passed to the Emerging Markets during the second quarter. As noted in the past, cumulatively, such swings serve as a building block in our constant assault seeking out opportunities for entry into, and exit from, investment positions. Most importantly, as inoculated value investors, we place a premium on staying true to our investment process with an unrelenting focus on MOS (margin of safety). As we have for nearly three decades in this business, we vigilantly listen--to the market, the macro backdrop, sector and company news flow, and the corresponding swings in investor psychology. With our typical investment horizon targeted at ~3-5 years, implicit in such a holding period is not simply low turnover (and low cost), but a time-period integral to an investment discipline undeterred by short-term events and emotions. Given our large cap value process is contrarian, high-conviction, and concentrated, we need not scramble adjusting our long- standing views, or portfolio positioning, due to weekly, monthly or quarterly events. As part of our disciplined implementation, we overlay longer-term secular views pertaining to the broader macroeconomic and market backdrop, resulting in active sector and stock exposures. The foundation of our disciplined investment process and philosophy does not allow for it to be radically altered, nor portfolio stock selection and sector allocation be impacted in the same vein. Given investment backdrops do not formulate overnight, portfolio construction, in our opinion, should be the result of a broader mosaic that does not succumb to near-term emotions and current events. Whether a function of near- or intermediate-term fundamentals, and/or investor psychology, our focus remains on recognizing, assessing and seizing upon valuations that potentially present opportunities, be they BUY or SELL. Source: Viacom, Inc.
- 3. ¹Comments and opinions expressed reflect solely the personal views of Anthony Lombardi as of 6/30/18, and not any other individual or firm. Such views are not a recommendation to buy or sell any security, fund or portfolio. Any investment decision should be made in consultation with a financial advisor. JUNE 2018 INVESTMENT COMMENTARY1 So, these Mid-terms, do they require study or not? We readily admit to, on occasion, having crammed for and exam or two. We don’t discount that the upcoming mid-term congressional elections, the associated lead-time all the way until election night, and the subsequent results will have its fair share of analyzing, and perhaps over- analyzing. Every homework assignment, quiz, test, mid-term and final contribute to cumulative GPA, but each with its own respective weight, and a process which normally takes four years to play out. More specifically, as we alluded in our September 2016 commentary, leading into the presidential elections: “This particular political process in America, a cycle which unfolds every four years, sets the stage to formally elect one of these two major candidates, each carrying high unfavorable ratings, one a unseasoned outsider, the other a proverbial seasoned insider. Ultimately, and in fairly short order, one of these individuals will serve as America’s leader for the next four years. On November 9th , 2016, America will wake to a President-elect, and similarly a new Congressional dynamic. Like many cycles before it, the country will march forward with the voice of its people heard, with all its new leaders being held accountable. Sometime early 2019, we will begin hearing about “new contestants” for the 2020 Presidential election to be held on November 3rd of that year, but not before the UK officially exits the EU, fiscal and central bank policies fluctuate, and economies around the world react. And all the while, valuations of companies across the globe will likely rise and fall based upon perceptions of fundamentals as market participants debate and vote accordingly.” With our typical investment horizon longer than congressional representative or 1-term president. As for the pendulum swings related to impacts of Trump administration “TNT” (a.k.a Turnover and Trade) on companies, sectors and markets, to use a quote from The Donald himself, “We’ll see”. Staff turnover at 1600 Pennsylvania Avenue is not a concern for us, and does not impact our process, nor do we think it changes decisions in many board rooms or back offices and homes of small business across America. As to Trade/Tariffs, while we don’t mean to completely discount what could be notable impacts, this is a discussion that has just begun in earnest with our geopolitical counterparts, and a long-term time horizon is among the more critical variables in our investment process. That said, (by now) markets should not be surprised that campaign-Trump, President-elect Trump and now President Trump have all had hardline messaging with respect to trade and perceptions and/or reality of imbalances. So, while there is news flow, data points and growing emotional angst over TNT currently, based upon what we have witnessed thus far, the fuse on Trade/Tariffs may be longer, and may lead to a much smaller stockpile than generally perceived. We like the portfolio positioning we currently have against these assumptions. As was the case with Wile E. and his side-kick, along the well- traveled road, there are many misguided messages, wrong turns, head bumps, stumbles, explosions, and, yes, the occasional implosion. But no matter the traps or detonations, that ole coyote kept on keeping on….and so too, we think, will the global markets, economy, and governments, driven by the pulse of the respective populous. Our process will tag right along with it all, no matter the backdrop. Beep-beep. Source: Looney Tunes, Warner Bros.
- 4. ¹Comments and opinions expressed reflect solely the personal views of Anthony Lombardi as of 6/30/18, and not any other individual or firm. Such views are not a recommendation to buy or sell any security, fund or portfolio. Any investment decision should be made in consultation with a financial advisor. JUNE 2018 INVESTMENT COMMENTARY1 Portfolio Positioning & Review Within the purview of our concentrated, contrarian LCV strategy, we have held a long-standing optimistic perspective of the opportunities seen across several sectors of the US stock market, despite broader valuation multiples of major indices. However, we have been mindful not to let our guard down, and simply ride the market’s swell. In our December 2016 and March 2017 commentaries, we highlighted our bullish/cyclical perspective was increasingly becoming a more centrally-held market view, particularly following the US elections in November 2016. Last quarter, we further noted some caution with respect to market’s relatively unbruised forward outlook: “While we are not suggesting an earnings expectations cliff, assuming a hiking trail free and clear of holes, rocks and tree roots, does not seem appropriate or likely”. Specifically, as to expectations on taxes: “…we don’t believe the likely scenario will be a full 100% drop-down benefit from recently implemented tax legislation; ~50%-75% would be our best guess long-term. Simply put, we are mindful of what we have heard and what we also believe is likely to be the mosaic; namely offsets to the tailwind provided by a reduction in corporate tax rates in the form of: competitive forces (price competition), higher wages/resource investments, higher inflation in the supply chain/COGS, capital investments, acquisitive desires that lead to higher rate of excess capital absorption and less dry powder available and bubbling regulatory pressures that permeate areas previously without handcuffs.” With our radar increasingly dialed up over the course of the past few quarters, we have taken the opportunity afforded in our investment process to liquidate full-position winners, while also raising interim cash levels when we deemed appropriate through targeted rebalancing. During 4Q17 and 1Q18 such actions led to consecutively higher liquidity at the end of each period, and at the end of 2Q18, we ended with our highest cash position since quarter-end June 2016. While we have not changed our targeted cash level, nor optimistic posture in our portfolio positioning, we act always with MOS as our principal guide. As reviewed below, we did not stand still during the second quarter, and were quite active on selective rebalancing of positions across a few sectors. We like the portfolio, we honor the process and we believe having some dry powder is an appealing position to be in, heading into 3Q18, and 2Q18 earnings reporting season. While our LCV portfolio remains fully exposed to all 11 sectors of the market, our focus has been steadfast since inception—a favorable disposition to traditionally cyclical areas, possessing compelling valuations, financial statement strength, and where near-term psychology serves to compensate for risk, providing the inherent MOS we seek when investing over a 3- to 5-year time horizon. Straying to own safety at any price has and will remain an unacceptable paradigm as our value conscious and investment process simply will not allow us to pay any multiple for quality. While conscious of risk factors, we are investors viewing through a risk/reward prism, in active pursuit of opportunities providing the right balance. We believe in seeking companies that offer a combination of cheapness, a contrarian view, possess stable balance sheets and attractive FCF characteristics, all which provide for a more compelling alternative to simply positioning our portfolio in a traditionally defensive manor (i.e. high allocations to Staples, Healthcare, Utilities, & Telecom). As regular readers of our commentary are fully aware, such areas of the large-cap market have been simply too rich for us, with many individual equities garnering valuation levels well above the broader market. Quite notable, since February 2016, the market capitalization weight of Consumer Staples has declined from nearly 11% to less than 7% at the end of June 2018, clearly not providing MOS or defensive benefits against the broader S&P 500 P/E multiple compression. Combined, Consumer Staples and Healthcare represent ~21% of the S&P market capitalization at the end of June, still above our targeted 14% allocation. In large part, the lack of traditionally defensive attributes has been the direct result of valuation multiples across these sectors having been at, or above, the market, particularly
- 5. ¹Comments and opinions expressed reflect solely the personal views of Anthony Lombardi as of 6/30/18, and not any other individual or firm. Such views are not a recommendation to buy or sell any security, fund or portfolio. Any investment decision should be made in consultation with a financial advisor. JUNE 2018 INVESTMENT COMMENTARY1 when viewed on a purely GAAP basis. Throw in some growth, margin and increasing competitive issues and one can see why such sectors in our large cap opportunity set, have not presented as being compelling in our process, despite compression experienced during the previous two years. More importantly, we have had no issue readily identifying quality, balance sheet strength, and cash flows at much cheaper levels, in various other sectors providing consistency with our long-standing, more bullish/cyclical view. Not only has deployment of investable capital in such areas been more acceptable to our value and contrarian-based discipline, but also in recognition that forward long-term returns are typically related to point-of-entry valuation multiples. With the market having come to us in the defensive areas, combined with our 3- to 5-year time horizon, we may be willing to listen should valuations, fundamentals and MOS prove a bit more worthy from here. Negative sentiment is certainly in place, and as contrarians, that’s an appealing start, so we’ll see what more comes our way. Our long-term investment views, convictions and process constraints have remained unchanged, and were affirmed with actions taken during the quarter. As previously noted, however, our radar remains dialed up. Compared to 1Q18, our portfolio positioning was altered principally through execution of process-related rebalancing to position targets through implementation of active decisions, without change to our longer-term convictions. We are still finding, buying and remaining owners of cheapness, MOS and compelling free cash flow (FCF), while at the same time we are sellers when valuation criteria or process constraints are breached. When juxtaposed against our belief that favorable operating leverage opportunities still exist in the economy, and amongst the companies we target, we remain steadfast in how we desire to position our LCV portfolio. Key Trades & Attribution We seeded a concentrated LCV strategy during the first quarter 2016. Since inception, as opportunities have been presented, we have made several active decisions, at both the stock and sector level. During 2Q18, notable actions included: Selective rebalance trades, including target position weighting changes, across several sectors: o Technology o Consumer Discretionary o Industrials o Healthcare Our activity level across the portfolio was higher versus the prior quarter, owing to targeted opportunities that underscored our convictions and were mindful of our investment process. Recall we also made numerous changes heading into 2018, citing the economic and market backdrop, as well as absolute and relative performance of individual holdings during the prior two years. In hindsight, these moves proved timely, as did the actions undertaken in the most recent quarter. As we have noted, our target sector weightings are influenced by top-down and bottom-up views. While there were no full position SALEs or BUYs, nor any active changes to sector target weighting allocations, we did execute three (3) target holding position weighting changes within the same sector, as well as rebalance (up & down) numerous individual holdings, cumulatively touching four (4) sectors in the portfolio. Our bias to raise cash during the quarter, as previously noted, was also a variable in our activity. With MOS as our guide, we deemed such actions appropriate. Quarter-end target and market value weights for our LCV portfolio are detailed below.
- 6. ¹Comments and opinions expressed reflect solely the personal views of Anthony Lombardi as of 6/30/18, and not any other individual or firm. Such views are not a recommendation to buy or sell any security, fund or portfolio. Any investment decision should be made in consultation with a financial advisor. JUNE 2018 INVESTMENT COMMENTARY1 On a market value basis, we ended 2Q18 with a higher cash position compared to 1Q18, at 4.0% vs 2.2%, and above our unchanged interim model target of 1.5%. We have been methodical in deploying available cash, as well as keeping dry powder for future utilization when warranted. Recall, from a process perspective, our targeted cash range is designed to provide flexibility, and allow for repositioning within a highly concentrated, yet diversified portfolio. While we are long-term investors, with low-turnover embedded in our process, we have a stated preference to monetize winners, and/or sell-down positions based on discipline, in so doing avoid placing capital at risk by simply holding investments as place-markers or allowing exposures to become excessive when selective rebalance is more appropriate. MOS is paramount for us and is critical in limiting potential downside. Holding a position that has attained valuation levels no longer representative of attractive risk/reward only serves to create undo diversification risk; and is simply an unacceptable practice. With protection of capital a covenant we are unwilling to break, we firmly believe in utilizing process-permitted cash level when situations dictate, to adhere to this core investment principle. We have previously detailed several such full position sales executed since inception. Similarly, significant rebalancing trades we have executed have served to protect capital in very much the same way. As it is not uncommon for our individual position rebalance trades to size in the ~50bps to ~100bps range, such transactions are very material, and likely equal to another, less-concentrated, lower-conviction portfolio manager’s full, target positions. Such discipline is among several key distinguishing characteristics in our process. We simply have no penchant to manage a portfolio structured with individual positions not representative of our high convictions, and firmly believe in a concentrated list of holdings, yet one diversified across market sectors. Being accused of closet indexing, or subject to extinction by ETFs or automated algorithmic-driven strategies remains least among our concerns. Investment Performance. For the June quarter, our LCV portfolio generated total return of 4.48% vs the Russell 1000 Value (R1KV) return of 1.16%, and broader S&P 500 return of 3.43%. For rolling one year-ended June 2018, our LCV portfolio generated total return of 17.7% vs R1KV return of 6.8% and broader S&P 500 return of 14.4%. The strong bounce off a marginally negative total return in 1Q18 was notable given the absolute return pushed our LCV portfolio’s relative quarterly performance (vs R1KV) to the second highest since its inception. Our portfolio’s outperformance of 332bps vs R1KV in the June quarter was driven by strong Security Selection offset
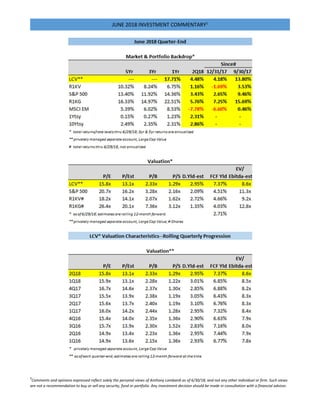
- 7. ¹Comments and opinions expressed reflect solely the personal views of Anthony Lombardi as of 6/30/18, and not any other individual or firm. Such views are not a recommendation to buy or sell any security, fund or portfolio. Any investment decision should be made in consultation with a financial advisor. JUNE 2018 INVESTMENT COMMENTARY1 by a modest drag from Allocation, with Selection aided by active rebalancing of positions to target levels. Similar strong contributions from Security Selection and a modest drag from Allocation resulted in a material benefit to our LCV portfolio’s absolute and relative performance against the broader market, such that returns also exceeded the performance of the S&P 500 for the sixth time in the past nine quarters. With the prior quarter having marked the first time since inception that our LCV portfolio experienced a negative absolute quarterly return, the strong bounce back ahead of both the R1KV and the S&P 500 in the June quarter was notable. That said, the ability to protect in a downside market environment is critical to longer-term preservation of capital and a reflection of our unrelenting focus on MOS and process, which comes well before expectations for upside. Our portfolio’s characteristics continue to reflect a disciplined, contrarian, value-oriented process. As we alluded for several quarters, while we remain comfortable with the investment backdrop, our radar remains dialed-up to material incremental multiple migration without corresponding fundamentals improving. Despite strong outperformance since seeding in early 2016, our portfolio continues to remain materially cheaper across nearly every valuation metric, notably boasting higher FCF & dividend yields, lower forward P/E and EBITDA multiples, and lower P/S compared to the broader S&P 500 and R1KV, the latter our primary LCV benchmark. As illustrated in the tables on page one, staying mindful of general market valuation levels, and more importantly that of our LCV portfolio, remains paramount. In our December 2016 commentary, we stated our portfolio had witnessed the most notable valuation creep in P/E (trailing & forward), Price/Book, and Dividend Yield, with P/E’s and Dividend Yield at their most expensive level since 1Q16. Heading into 2018, we remained cognizant of these levels, as well as the creep (lower) in FCF Yield and forward EV/EBITDA (higher). That said, protection offered by the valuation discount in our portfolio versus our benchmark and broader market was significant, serving us well during market weakness experienced in 1Q18, as well as the subsequent rebound in 2Q18. At period-end, meaningful valuation gaps between our LCV portfolio and R1KV remained intact, with FCF yield and EV/EBITDA being notable examples at a 271bps premium and 7% discount (vs R1KV), respectively. We have our eye keenly on the portfolio’s EBITDA multiple which has now hit its highest level since inception, particularly in lieu of interest rates and appetites by management to take on some incremental leverage. From a performance attribution standpoint, versus the R1KV, contribution from Selection far exceeded the modest drag from Allocation. Specifically, contribution and drag from Security Selection and Allocation during the June quarter amounted to +419bps and -87bps, respectively. Consumer Discretionary, Technology and Financials were the most significant contributors in total attribution, while Energy, Industrials and Real Estate were the most significant detractors. By Allocation, the Financials, Consumer Discretionary and Consumer Staples sectors had the largest positive attribution, while Energy, Technology, Industrials and Real Estate were the largest detractors. By Stock Selection, Consumer Discretionary, Technology and Financials were the largest contributors, while Industrials and Real Estate were modest drags on performance. On an absolute basis, our portfolio had three sectors experience declines quarter/quarter; for the second consecutive quarter, Industrials was the most significant. By comparison, five sectors in the R1KV, led by Financials and Consumer Staples, posted sequential declines. Our targeted cash position of 1.50% remained unchanged, despite several targeted rebalances, and target weighting changes, of holdings noted above. Overall portfolio liquidity on a market value basis was increased as cash was tactically raised versus prior quarter-end levels. From a performance perspective, our cash position helped and resulted in a contribution of 8bps for the quarter.
- 8. ¹Comments and opinions expressed reflect solely the personal views of Anthony Lombardi as of 6/30/18, and not any other individual or firm. Such views are not a recommendation to buy or sell any security, fund or portfolio. Any investment decision should be made in consultation with a financial advisor. JUNE 2018 INVESTMENT COMMENTARY1 Technology: No Sector weighting change; 3 Target weighting changes, 1 rebalance: 22.0% By far, our activity in TECH was among the most significant. During the quarter, we executed a reallocation, utilizing three TECH positions, one down (-200bps) and two up (+100bps each) to revised target weights. Additionally, we rebalanced a fourth position down to target weight. In combination with the rebalance activity in 1Q18, we touched all our holdings within TECH during the past two quarters, which is not surprising given the sector has been a key market driver. Cumulatively, our activity in the current quarter represented ~470bps of aggregate portfolio market value. Included in the TECH target weighting change down, and the separate rebalance to target, were positions that had experienced material appreciation, each up at least 70% since inception. Compared to the S&P 500 and R1KV, our portfolio’s target weight allocation for TECH was an underweight of ~395bps and an overweight of ~1,215bps, respectively, at the end of June. Relative to the R1KV, the portfolio’s two largest overweight sectors are TECH and CD, representing an aggregate ~2,130bps. Consumer Discretionary: No Sector weighting change; 2 rebalance trades to target: 17.5% Our steadfast conviction and contrarian view continued serving the portfolio well during the June quarter, most notably in the Discretionary sector, the result of select exposures and our active decisions in prior quarters to round-up targeted holdings. We have been of the opinion several holdings in CD, that were earlier drags on performance, would ultimately be protected by compelling valuation characteristics, business models, balance sheets and free cash flow. We took the opportunity in previous quarters to underscore such convictions by raising the CD sector weight near the maximum allowed by our process at the time. The moves have contributed meaningfully to performance. During the June quarter, we focused on two positions for rebalance, both down to target weight following significant appreciation, with one holding nearing the maximum individual weighting allowed by our process. Notably, the second position rebalanced down to target represented the 3rd such action we have taken on the holding in 2018. Over the past year, both holdings are up at least 70%. Cumulatively, the actions taken in the quarter comprised ~285bps of aggregate portfolio market value. Along with TECH, IND, and FIN, the CD sector comprises a significant part of our portfolio’s cyclical bias, and it contributed materially to total attribution in 2Q18. At quarter-end, our sector target allocation of 17.5%, represented an active overweight of ~460bps versus the S&P 500. Our process compliant maximum weight for CD was 19.4% at quarter-end, higher than when we implemented our sector increase in 4Q17. Compared to the R1KV, the portfolio ended the quarter with a target overweight of ~920bps. Industrials: No Sector weighting change; 2 rebalance trades to target: 15.0% (Maximum) Given our target weighting for IND has been at the maximum weight allowed by our process for the sector, the late quarter share price declines among some of the largest weightings in the S&P 500 IND sector will drive a change in our target for 3Q18. Given the maximum allowable weight in IND against the S&P 500 was ~14.3% at quarter-end, our portfolio target level requires reduction in 3Q18. In anticipation, we allowed portfolio market value weighting for the sector to drift lower. We view this as critical to remaining compliant with our process, as well as listening to one of the many data points in our discipline. In the June quarter, we utilized ~60bps of aggregate portfolio market value, available in cash and from corresponding trims elsewhere, to rebalancing two positions in IND up to target weightings. The sector has comprised part of our long-standing, favorable cyclical view, using an opportunity set available amongst individual securities offering compelling valuation characteristics. Compared to the S&P 500 and R1KV, our portfolio’s targeted overweight allocation for IND was ~550bps and ~715bps, respectively, at the end of June.
- 9. ¹Comments and opinions expressed reflect solely the personal views of Anthony Lombardi as of 6/30/18, and not any other individual or firm. Such views are not a recommendation to buy or sell any security, fund or portfolio. Any investment decision should be made in consultation with a financial advisor. JUNE 2018 INVESTMENT COMMENTARY1 Healthcare: No Sector weighting change; 1 rebalance trade to target: 9.0% We rebalanced one target position in HC via a round-up trade executed during the quarter, cumulatively representing a use of ~35bps of aggregate portfolio market value, funded from cash made available from rebalances and weighting changes in TECH, as well as cash on hand. Recall last quarter we utilized significant appreciation in target holdings in cyclical sectors, TECH and CD, for similar redeployment to the underperforming, underweight HC sector which has begun to offer increasingly compelling valuation during the last few quarters. We are wading, not diving in. Compared to the S&P 500 and R1KV, our portfolio’s targeted underweight allocation for HC was ~505bps and ~485bps, respectively, at the end of June. Five Sectors remain at targeted allocations of 4.00% or lower, with no change in Energy Our portfolio has five of eleven sectors where target weightings are 4.00% or less; Energy (4.00%), Materials (3.00%), Telecom (3.00%), Real Estate (1.50%) and Utilities (1.50%). These weightings are in alignment with our broader investment views, expected backdrop and process constraints, and all underscore our cyclical bias. Energy continues to remain our most pronounced exception to our cyclical bias, with our portfolio allocation emphasizing a strategic decision to be prudent and mindful of our long-standing concerns. Despite a significant upside move in WTI during 2Q18, quarter-end S&P 500 Energy weighting climbed only 60bps to ~6.34%, putting our allowable process maximum for the sector at ~9.51% allocation. Strategically, we desire a meaningful underweight, which at quarter-end was ~235bps and ~710bps below the S&P 500 and R1KV, respectively. Notably, despite our targeted underweight in Energy, combined with the sector’s 14% appreciation during the June quarter, our portfolio’s relative performance was not dramatically impacted. We remain quite comfortable at a 4.00% allocation and would not hesitate to reduce should process and/or opportunities warrant, either within, or outside the sector. Our fundamental concerns remain unaltered, and we reiterate our belief the sector to be a quintessential “value trap”. The S&P 500 Energy sector weight would require an 8% level before forcing us to move our allocation higher on a process basis alone. Cash target unchanged: 1.50% Our portfolio target cash level remained unchanged relative to year-end, at 1.50%. However, we continued making active use of process-permitted cash levels through the execution of various actions noted above, helping solidify overall MOS. From a market value perspective, cash level was up to 4.0% at quarter-end, versus 2.2% at the end of March. New Communications-Services Sector in September Targeted for September by S&P Dow Jones Indices and MSCI Inc. is a newly comprised Communications-Services Sector that will combine the current Telecom Sector with large name extractions from the Technology Sector. Versus a current 2% weighting for Telecom, VZ and newly formed AT&T (with TWX) will find themselves with the likes of Facebook, Alphabet, Comcast and Netflix. Having followed the TMT (Technology-Media-Telecom) space for 20-years, to use a technical term, this is a “no-brainer”. The convergence in the space, and between business models, has been a secular trend for some time, and any comparative analysis has required tracking. In the aggregate, there is likely to be a reported swing of more than 800bps out of Technology sector weight, into this newly formed sector. We are well-prepared for the change.
- 10. ¹Comments and opinions expressed reflect solely the personal views of Anthony Lombardi as of 6/30/18, and not any other individual or firm. Such views are not a recommendation to buy or sell any security, fund or portfolio. Any investment decision should be made in consultation with a financial advisor. JUNE 2018 INVESTMENT COMMENTARY1 Market and Economic Backdrop We have repeatedly underscored our belief that a good amount of operating leverage existed that could be readily monetized for the benefit of shareholders/consumers should top-line revenue (& GDP) growth move sustainably higher; a dynamic that has clearly been playing out. However, our vigilance works both ways and, as indicated in our previous commentaries, our radar has been dialed up: “should macro-related conditions deteriorate, or it become(s) increasingly difficult to discover new compelling opportunities; valuation characteristics, balance sheet and/or cash flow attributes become more challenging, we will change course per process discipline.” Process, opportunities and MOS will always be our guide, which our recent allocation and rebalance actions continue to reflect. For much of this elongated recovery, the broader US equity market has been able to absorb a multitude of events, most recently the political landscape at home; Technology data/privacy concerns; geopolitical tensions and events around the world now led by trade and tariff crystallization; North Korea possibilities, or not; a fluctuating dollar; spiking market volatility; an oil price reversal; hemorrhage in Emerging Markets; improving economic data at home; terrorist and civilian-based societal attacks; new Fed Chairman; Federal Reserve prospects for speed of continued normalization of monetary policy through rate and balance sheet actions. Notably, the market shrugged off a weak, and volatile first quarter, with a bounce back in the second quarter. Recall, the first quarter decline coincided with the valuation multiple expansion we had alluded in prior reports. Bifurcation of performance across investment styles and regions remained status quo. As noted in our September 2017, December 2017 and March 2018 commentaries, there was clear rotation from Growth/Emerging Markets to Value in the latter part of each quarter. In the June quarter, the levee breached with major declines in the MSCI Emerging Market index, while Growth remained in favor. We are not surprised by the pendulum action in the market, particularly in lieu of monetary and fiscal backdrops, geopolitical tensions, increased volatility and underlying emotional swings. Adding fuel to the unwind in EM was the likely capital allocations previously made partly on basis that international markets were a perceived as a more compelling opportunity than the US. As noted in March, we continue to expect this style-shifting dynamic having the potential to remain an underlying pillar during 2018, which should sit well against our investment process. Year- to-date performance for our LCV portfolio suggests this to be the case, thus far. For the quarter, the S&P 500 posted a 3.4% total return, with continued variance by sector/industry group. As was the case in the prior quarter, cyclicals led the way in absolute performance terms, paced by Energy, Consumer Discretionary and Technology posting positive total returns of +13.5%, +8.1% and +7.1%, respectively. Traditionally more defensive areas such as Real Estate, Utilities and Healthcare also performed well, matching or exceeding the aggregate market. Notable for the second consecutive quarter was the poor showing in Consumer Staples which underperformed during a negative first quarter with a -7.1% total return, only to add to its pain with another decline of -2.2%. Industrials and Financials were the only other two sectors with negative total returns, with their weakness throughout the quarter deteriorating into period-end. Growth (as measured by Russell 1000 Growth Index—R1KG) posted a +5.8% total return, meaningfully outperforming Value for the sixth consecutive quarter, with a ~460bps differential. Emerging Markets (as measured by the MSCI EM index), as noted above, posted a sizeable decline of -7.8%, meaningfully delinking with Growth. The weak showing for EM placed its’s rolling 1-year total return at ~1,400bps below Growth, down from its ~400bps rolling 1-year advantage at the end of 2Q17. With the hemorrhage, Value easily overtook EM, swinging from a 405bps deficit
- 11. ¹Comments and opinions expressed reflect solely the personal views of Anthony Lombardi as of 6/30/18, and not any other individual or firm. Such views are not a recommendation to buy or sell any security, fund or portfolio. Any investment decision should be made in consultation with a financial advisor. JUNE 2018 INVESTMENT COMMENTARY1 last quarter to a favorable ~662bps differential. As to U.S. interest rates and spreads, we have long maintained our opinion that an extended path lower had largely ended several quarters ago—a view founded upon broad expectations for improved economic growth, higher (but not runaway) inflation, and changes in monetary (tighter) and fiscal (expansionary) policy. Increasing market concerns regarding short-end curve pressure will serve to test our thesis on inversion, which we believe will play out over the next couple quarters. Globally, stock markets (total returns measured in U.S. Dollars) remained volatile and bifurcated across several geographic theaters, continuing an ongoing theme in the backdrop: Australia +4.3% (vs -5.0% 1Q18), UK 3.1% (vs -3.8% 1Q18), India +2.7% (-4.9% 1Q18), France 0.2%, Japan -0.2%, Hong Kong -2.5%, Germany -3.4%, Mexico -3.9%, China -17.1% (-0.5% 1Q18) and Brazil -27.1% (vs +8.1% 1Q18). For the quarter, the S&P 500 posted a 2.9% price increase, below the positive price performance of the R1KG at +5.4% but comparatively stronger than the decline in the R1KV at +0.6%. With respect to domestic markets, Technology, Consumer Discretionary and Financials drove a large part of the positive attribution of Growth over Value. Energy, owing to a sizeable underweight in Growth, was a material detractor for Growth. As we noted in our prior commentaries, when comparing Growth vs Value, any performance differential will likely be driven, principally, by four sectors. Specifically, the most significant weighting differentials, at quarter-end, between Growth and Value were Technology (+3,166bps), Consumer Discretionary (+959bps), Financials (-1,885bps) and Energy (-1,010bps). Intra-quarter low for the 10-year yield was on the first day, 2.73%, with a high of 3.11%. Not only did the 10- year eclipse the prior quarter’s high of 2.95%, but finally managed to get through (with relative ease) the 3.00% handle not seen since year-end 2013. Excluding a short dip to nearly 2.00% in 3Q17, the 10-year has not only managed to hold the initial spike that occurred during the few days following the November 2016 US Presidential election but has clearly been reacting more dynamically to various factors. We believe this action will continue, albeit not in perfect linear fashion. Against this rate backdrop, major US equity indices have been able to power to numerous record all-time highs, including in 1Q18 across several broader benchmarks. While S&P 500, Russell 1000 Value and Dow Industrials were sidelined during 2Q18, growth and small hit new highs as evidenced by intra-quarter levels for the NASDAQ Composite, Russell 1000 Growth and Russell 2000 index. 10-Yr Qtr-End 4Q15: 2.27% 2Q16: 1.47% 4Q16: 2.45% 2Q17: 2.31% 4Q17: 2.41% 2Q18: 2.86% Yield curve slope compresses again, but still not a primary concern for us. Using 1yr-10yr spread, which had expanded to ~ 165bps at year-end 2016, compressed notably during 2017, declining to ~ 140bps at end of 1Q17, to ~110bps at end of 2Q17, ~105bps at end of 3Q17, ~65bps at end of both 4Q17 and 1Q18, and rested at ~55bps for 2Q18. The acceleration in slope compression has been driven largely by a rising short-end and, until recently, modest pressure on the long-end. In our opinion, this has been a function of anticipated and actual Fed action, alleviated concerns regarding a stalled Fiscal agenda, and firming economic data juxtaposed against well-
- 12. ¹Comments and opinions expressed reflect solely the personal views of Anthony Lombardi as of 6/30/18, and not any other individual or firm. Such views are not a recommendation to buy or sell any security, fund or portfolio. Any investment decision should be made in consultation with a financial advisor. JUNE 2018 INVESTMENT COMMENTARY1 contained inflation. The 1yr-10yr spread level is well below the ~200bps that existed a little more than 3-years ago, a notable change in the backdrop. As noted last quarter, while aware of potential curve inversion, we are more focused upon aggregate interest rate levels, cash flow, balance sheet dynamics, capital allocation and margin trends. The slope of the curve, nor it’s dynamics, at this juncture is not a primary concern for us in this regard. Far be it from us to be Pollyanna, as are radar has been dialed up for the past couple quarters. Should an inversion pan out and is a function of, or related to, a deterioration in fundamentals, that would cause us to make further adjustments in our thinking and positioning. Under a new Fed Chairman and likely further changes to the policy-making committee, we continue to believe data dependency will remain among the foundational pillars for monetary policy. Magnitude of changes in policy are expected to be justified by the macroeconomic backdrop—the latter which we have been positively disposed for some time and expect to continue driving interest rate movements and broader policy agenda. The underlying mosaic and interplay of new Fed leadership, economic data points (domestic and international), Fiscal policy agenda and spending discipline, corporate balance sheet and profit trends will continue to be monitored. Secondary to these forces will be any longer-term impacts of sustained trade tariffs/negotiations across individual market sectors, which may, or may not change the primary variables in the economic and business profit equations. As previously noted, we are 10 years out from the global financial crisis, and clearly on more stable economic ground, with improved conditions for both corporate and consumer fundamentals. At this stage of the domestic economic, monetary and fiscal policy cycles, we remain less focused upon unit count of rate increases anticipated by the market and more biased to the level of potential rate changes, and the corresponding impact such step-changes could serve to vastly exceed market expectations. We maintain our own view with respect to U.S. monetary policy underscored in our December 2016 commentary: “…we would not be surprised to see a more fluid pace of change regarding monetary policy should situations warrant. This would include the possibility of at least one 50bp change amongst the current unit count of rate change decisions anticipated, and/or more action steps than currently discounted by the market.” The accelerated compression in the yield curve we highlighted above is just one example of more fluid changes in the backdrop versus a stale dynamic previously, as is the rise in equity market volatility. A market with a swinging pendulum fits neatly into our process. Changes in capital allocations and management priorities remain key front-burners for us and are playing out much as we expected. Our expectations have been for corporate actions that lead to a re-ranking of capital management priorities given a more a favorable tax code, increasing deregulation, improving economic activity and executive management confidence, along with a corresponding increase in capital and human resource investments. While such changes could have negative implications for the level and/or pace of share repurchases and dividend increases witnessed during the recovery period since the trough of the financial crisis, they would likely vary by sector. To this end, given underlying performance of the stock market, simple mathematics continue to suggest lower marginal buying power of previously approved, and remaining buyback authorizations. Still further yet, Finance 101 suggests higher valuation multiples present as less appetizing to corporate CFO’s and Treasurers, acting as an incremental constraint to share buybacks. That said, we reiterate that even with large repatriations of internationally domiciled cash, the possibility exists that some may still deploy part of this newfound dry powder into “high multiple” buybacks.
- 13. ¹Comments and opinions expressed reflect solely the personal views of Anthony Lombardi as of 6/30/18, and not any other individual or firm. Such views are not a recommendation to buy or sell any security, fund or portfolio. Any investment decision should be made in consultation with a financial advisor. JUNE 2018 INVESTMENT COMMENTARY1 Technology is where a lot of this liquidity resides with several companies boasting cash-rich balance sheets. As we have alluded previously, new potential risks and opportunities require monitoring within the Technology sector and may cause some redirection of cash. Material change to business models, particularly expectation for long term future growth and margins will be notable to monitor, no matter the sector or company. As is typically the case, earnings and free cash flow generation will serve as key drivers of the ultimate determinant of capital allocation across sectors and industries, all led by the respective fundamental backdrops of each. M&A. Confidence of management and boards to take on risk and allocate capital remains high, reflected in the appetite to do deals spanning various sectors and geographies. The bidding war between Disney and Comcast, for assets of Twentieth Century Fox, underscores the backdrop. Among notable announcements in 2Q18: Takeda Pharmaceutical/Shire PLC ($80 bil cash/stock), Walt Disney/Twentieth Century Fox-revised ($71 bil cash/stock), T-Mobile/Sprint ($58 bil), Marathon Petroleum/Andeavor ($30 bil cash/stock), China Three Gorges/EDP ($24 bil cash), Walmart/Flipkart Online—77% ($16 bil cash), ConAgra/Pinnacle Foods ($11 bil cash/stock). Also, of note was the conclusion of antitrust trial and related court ruling allowing the T/TWX merger to proceed, and close. Volatility trended lower. With equity indices bouncing back from first quarter, markets managing through leveraged product and wage-inflation scares, and North Korea issues finding calmer waters, market volatility, as measured by the CBOE Volatility Index (VIX), trended lower during 2Q18. As we have noted previously, since 1990, a year marked by the precipice of a multiyear financial crisis (and recession) involving S&L’s and commercial banks, the low mark on the VIX has been 9.1, and the average, 19.3. During the past several quarters, exceptions were the February 2018 spike (to 37), an immediate, post-UK “Brexit” vote increase in late June 2016 (to 25.8), a less prominent increase in September 2016, and the November 2016 spike (to 22.5) after the U.S presidential election. Recent FOMC decisions; confirmation of a new Fed Chair, intra-meeting commentary regarding rate/balance sheet policy; swirling, divisive and emotional political winds blowing in Washington, passage of new tax legislation, geopolitical events including Trade/Tariffs & disruptions across the globe, intermittent sell-offs in Tech (long the market’s anchor tenant) the past few quarters, and growing speculative mania in crypto currencies, all have had less of an impact on the VIX than wage inflation scares, Brexit vote results or the U.S. presidential election of 2016. Dollar snap back. Given the confluence of global events, relative strength of the U.S. economic backdrop, and perceived safety of U.S. capital markets, we have long been of the view that an overly dire outcome for the US Dollar will remain an unlikely scenario in the near-to-intermediate term. As noted in our March 2018 commentary, implications of any potentially sustained trade-related changes due to tariffs, negative or positive, will certainly bear monitoring. For the quarter, the Dollar index (DXY) snapped back with a 5% increase, reflecting in part, evolving undercurrents in DC related to monetary, fiscal and trade-related policy, rising interest rates domestically, as well as expectations for continued degree of relative economic improvement outside the US. The reversal in the Dollar had negative impacts on several Emerging Markets. As noted in prior comments, the DXY remains well-above the financial crisis lows of ~70 reached in 1Q08, and ~8% off its 10-year high of ~103 in 1Q17. Capital investment and potential cross-border M&A, utilizing a strong currency, remain benefits of the Dollar’s global position and strength. Further, as we have noted, to the point where investments or acquisitions lead to availability of internationally parked cash, repatriation could serve as an incremental benefit from
- 14. ¹Comments and opinions expressed reflect solely the personal views of Anthony Lombardi as of 6/30/18, and not any other individual or firm. Such views are not a recommendation to buy or sell any security, fund or portfolio. Any investment decision should be made in consultation with a financial advisor. JUNE 2018 INVESTMENT COMMENTARY1 internationally exposed businesses. Given enacted tax legislation, such benefits have the possibility to further materialize during 2018 and beyond. Gold legs lower while Oil sustains higher. Gold, which had hit a 1-year high of nearly $1,360 in late January, declined 7%, during a period when the Dollar witnessed a snap back, and the VIX subsided from a notable spike in 1Q18. The Energy sector caught a bid, putting in the best performance of all 11 sectors in the S&P 500 on the heels of continued upward movement in the front-end contract for WTI. Specifically, the WTI posted a near 18% gain in the quarter, on top of an 8% increase in 1Q18, to close at $74.15. Despite very strong gains during the past couple quarters, Oil remains more than 30% below its 2014 high. Beyond the risks we have previously highlighted with respect to inventories, technological benefits and change, potential production cut slippage amongst OPEC, and production triggers being pulled by U.S. producers, a further constraint on materially higher price levels is potential headwinds to economic growth that could metastasize with such a corresponding rise in WTI. Against this backdrop we remain steadfast in our pessimistic view, particularly for the equity sector. As evident in our 200bp reduction in sector allocation during 2017, and Energy’s modest 6% S&P 500 market capitalization representation, we remain in no rush to add portfolio exposure to the sector given process limits our allocation to ~9%, and compelling opportunities exist elsewhere without the risks of certain oligopolistic decisions. 1Q18 Real GDP unchanged at +2.8% (y/y) but marked down to 2.0% (q/q); 2Q18E: +2.9% y/y, +3.4% q/q. Forward estimates for FY 2018, 2019 and 2020 are currently +2.9%, +2.4% and +1.9%, respectively, with ’20 having seen the most notable downward revisions. We have repeatedly highlighted a strong employment backdrop, which has yet to crack based on latest hiring trends. Versus crisis level losses of ~ 900k/month in 2008- 09, the labor market has witnessed continued improvement, generally posting nonfarm payroll gains of ~150k- 300k/month since 2013, with the June print (for May figures) of 223k, well above estimate. Forward median forecasts for 2018-2020 remain in the range of ~130k-185k/month, levels which have witnessed upside trajectory as we expected. The unemployment rate has leveled at 2-decade low, equal to the April 2000 rate, as well as a post-recession low of 3.8%, having declined 600 bps from its previous peak. Estimates for 2018, 2019 and 2020 have trended lower and currently stand at 3.9% 3.7% and 3.8%, respectively, with the Fed Chairman having recently alluded to the Phillips curve breaking down relative to historical relationships. As noted in prior commentaries, acceleration in aggregate economic growth had proved difficult despite the improving labor market backdrop. However, last year’s breach above 3% (Q/Q) on real GDP was a notable change and came without fiscal policy injection. Given enactment of tax legislation and initial response by several companies regarding capital management and resource plans, we continue to believe underlying traction is likely to firm. FOMC commentary has continually underscored policy maker’s data dependency and includes viewing through a global lense with eyes on more than just U.S. economic conditions. To this end, trade-related developments will certainly be scrutinized for any longer-term impacts serving to materially impact the anticipated trajectory in growth and inflation. Given global monetary stimulants that have existed for an extended period, combined with newly injected Fiscal accelerants, monitoring price and wage inflation metrics remains at the forefront for us. January’s wage report impact on markets has not escaped us, and underscores this being a variable for which to continue being mindful. Despite occasional soft spots in economic data, we continue to expect aggregate growth, wage and price pressure to warm further. However, the latter still bears the most burden versus history given increasing number of business models founded upon low-cost and/or price competition. Specifically, many
- 15. ¹Comments and opinions expressed reflect solely the personal views of Anthony Lombardi as of 6/30/18, and not any other individual or firm. Such views are not a recommendation to buy or sell any security, fund or portfolio. Any investment decision should be made in consultation with a financial advisor. JUNE 2018 INVESTMENT COMMENTARY1 new business concepts successfully introduced within the past decade or two, are high-volume low-margin, where price points and distribution are key competitive differentiators. Recent tax change and subsequent corporate actions leading to bonus compensation, wage and hiring increases suggest, however, that some operating costs may be skimming along the bottom. Margin watch will be critical. Five and Dime earnings picture remains intact but monitoring degree of offsets to tax tailwinds a focus. Heading into 2Q18 earnings season, based on FactSet data, aggregate S&P 500 EPS on a reported basis are estimated at ~$39.32, representing a year/year increase of ~+20%, versus the 25% gain posted in 1Q18. Compared to March 31st, the estimated 2Q18 earnings growth for the S&P 500 has increased a full percentage point from the 19% growth originally projected, although well below the massive jump in expectations witness heading into 1Q18. While estimates typically trend lower during a quarter, recent trajectories during past earnings seasons have not held those norms due to a combination of lower cuts by analysts, enacted tax legislation, a reduced level of negative guidance by companies, and generally easing comps in the more pressured sectors. Prior to tax legislation, some of the easier comps were previously expected to fade, but now have been pushed out due to the tax-related tailwind, serving to help spur momentum on the top and bottom line. Top-line revenue growth forecasts of 8.7% for 2Q18 have also increased a full point vs estimates at end of 1Q18. We have had a long-held bullish view on corporate fundamentals. Profit margins and operating leverage implied in current forecasts continue to be factors helping to reinforce this positive stance. Basic math of the market has supported the margin trajectory given the underlying mix and weighting of high-level sector contributors, notably Technology, representing 26% of S&P 500 market cap, up ~200 bps at quarter-end versus year-end 2017. Conversely, the Energy sector’s weighting has been materially compressed over the course of the past few years and currently represents slightly more than 6% of S&P 500 market cap but has transitioned from the precipice of negative comparisons: Current earnings and revenue projections for FY18 are at ~ +102% and ~ +16%, but by FY19, the Energy sector is expected to be fully out of the “anomaly” period, as earnings growth is currently expected to be below the S&P 500 at just 4% vs 5% for the market. Outside of Technology, Financials and Healthcare are now equal in market cap representation. Most notable within Financials (14.0% market cap), we believe the banks have a favorable runway with green lights on capital plans, strong credit, an expanding economy, rising interest rates, reduced regulation as well as the tailwind of lower tax burden and generally domestic business models. With Tech, Financials and Healthcare now comprising ~54% of the S&P market cap, additional tailwind of lower corporate taxes fully embedded in estimates, revenue and earnings appears to be reasonably well-anchored in the near- to intermediate-term, with some incremental support potentially coming from other sectors. Should earnings growth increase in 2Q18 as expected, it will represent the 8th consecutive quarter of year-over-year improvement. On a reported earnings basis, all 11 sectors are expected to be in positive territory for the quarter, with Consumer Staples, Real Estate and Utilities the weakest. Energy, Materials and Telecom are expected to contribute the highest earnings growth. Profit margin, in the aggregate, is expected to be up ~100bps in 2Q18 vs 2Q17, to 11.5%. The largest sector, Technology, is expected to post a near 21% vs 19% in 2Q17. The outlook for 2018 has bled higher vs March forecasts, currently calling for estimated top-line growth of ~8% and earnings growth of ~20%, levels now above what we have affectionately called a “Five & Dime” market backdrop (5% top and 10% bottom-line growth). As noted in prior commentaries, recently enacted tax legislation has generated some spare change, or cushion against the original baseline sans tax. By sector, the picture is
- 16. ¹Comments and opinions expressed reflect solely the personal views of Anthony Lombardi as of 6/30/18, and not any other individual or firm. Such views are not a recommendation to buy or sell any security, fund or portfolio. Any investment decision should be made in consultation with a financial advisor. JUNE 2018 INVESTMENT COMMENTARY1 quite different, with bifurcation in earnings led by Energy and Real Estate at the extreme tails of expectations for FY18. As these sectors are materially smaller in market capitalization, we reiterate the more relevant story to monitor remains those sectors within the tails. All else constant, we believe the basic math of the market’s forward P/E suggests it has not been as rich as generally perceived during this expansion when viewed in the context of the underlying mix: Technology sector’s high profit margins and higher growth, the Financial sector trading at ~12x forward EPS (with newly approved buyback and dividend plans), the benefit of cyclical tailwinds materializing within Industrials and Consumer Discretionary, and Energy having traded well above the market average for some time, though now at 18x forward estimates. Bottom line: As contrarians, we have been attracted to many facets in the backdrop noted above, particularly those that underscore the fundamental and emotional swings that are part of any natural market environment. It is the short-to-intermediate term fluctuations which provide the right backdrop for us to position our portfolio for the long-term at both the sector and security level. While we have repeatedly noted selective areas of the market as expensive (namely traditionally defensive, higher quality sectors and a fundamentally challenged energy complex), many of the cyclical areas within our value-based discipline, have presented as quite compelling to us for quite some time. If one simply places on blinders, and focuses on the aggregate level of the market, to include broader market earnings growth, valuation metrics, GDP growth, and nominal debt levels the backdrop might be viewed challenging. We prefer to go deeper, into sectors and individual stocks, assess related fundamentals and metrics, place broader macroeconomic measures such as GDP growth into context, and break apart aggregate metrics such as debt into more relevant measures such as net debt, interest costs and service coverage ratios, etc. In so doing, we have been quite bullish as to the opportunity set in our concentrated yet diversified large cap value strategy. That is not to say the opportunity set would be the same for other investors in different or less-concentrated strategies. As long-term investors, we remain focused on executing a consistent process, buying cheapness and not over-paying for quality. As disciplined contrarians, mindful of capital protection, we have found the cyclical sectors, ex-energy/commodities, home to stocks with the most compelling valuations relative to the broader market. Given our contrarian nature, we are also cognizant of consensus having moved in our direction, although much of the change was back-end loaded post US elections, and not universal across the macroeconomic, sector or individual stock landscape. Nevertheless, we remain quite sensitive to the shifts that have occurred, for which our portfolio decisions have reflected. With our radar dialed up for changes that cause swings in the pendulum too far in any one direction, we have made it a point to take actions during the last several quarters to solidify cheapness in our portfolio and be protective of capital. This is a transparent exercise and can clearly be seen in the valuation characteristics of our LCV portfolio as compared to the broader market, our key benchmark (R1KV) and the entire LCV equity peer group. Conviction is key for us and is reflected in our portfolio actions. Most importantly, with any company, it is those possessing characteristics strong in balance sheet and free-cash flow, combined with compelling equity valuation, that garner our attention--these remain the type of roommates we prefer when seeking opportunity and MOS. AAL Document is meant to be used in its entirety. Reference to prior quarterly and monthly publications is noted. Views expressed represent personal assessment of privately managed separate account and market environment as of the date indicated, and should not be considered a recommendation to buy, hold or sell any security, and should not be relied on as research or investment advice. Information is as of the date indicated and subject to change. All market and other related information relied upon and mentioned is from market data sources viewed as reliable. No guarantees are made regarding accuracy.
- 17. ¹Comments and opinions expressed reflect solely the personal views of Anthony Lombardi as of 6/30/18, and not any other individual or firm. Such views are not a recommendation to buy or sell any security, fund or portfolio. Any investment decision should be made in consultation with a financial advisor. JUNE 2018 INVESTMENT COMMENTARY1 Index returns are for illustrative purposes only. Index performance returns do not reflect any management fees, transaction costs or expenses. Indexes are unmanaged and one cannot invest directly in an index. Past performance does not guarantee future results. The S&P 500 Index measures the performance of 500 mostly large-cap stocks weighted by market value, and is often used to represent performance of the U.S. Stock market. The Russell 1000 Value Index measures the performance of the large-cap value segment of the U.S. equity universe. It includes those Russell 1000 companies with lower price-to-book ratios and lower forecasted growth values. The Russell 1000 Growth Index measures the performance of the large- cap growth segment of the U.S. equity universe. It includes those Russell 1000 companies with higher price-to-book ratios and higher forecasted growth values. Russell Investment Group is the source and owner of the trademarks, service marks, and copyrights related to the Russell Indexes. Russell® is a trademark of the Russell Investment Group. iShares® Funds are distributed by BlackRock Investments, LLC. The iShares Funds are not sponsored, endorsed, issued, sold or promoted by Russell Investment Group. Nor does this company make any representation regarding the advisability of investing in iShares Funds. BlackRock is not affiliated with the company listed above. iShares® and BlackRock® are registered trademarks of BlackRock, Inc., or its subsidiaries. MSCI Emerging Market index is an index created by Morgan Stanley Capital International (MSCI), designed to measure equity market performance in global emerging markets. The Emerging Markets Index is a float-adjusted market capitalization index. MSCI®, and the MSCI index names are registered trademarks of MSCI Inc. or its affiliates. Where noted, S&P 500® Index, Russell 1000® Value Index, Russell 1000® Growth Index, iShares® Russell 1000 Value ETF and MSCI® Emerging Market Index are referenced with abbreviations and respective footnotes. Abbreviations include S&P 500, R1KV, R1KG and MSCI EM. Use of iShares ETF for a respective index is footnoted accordingly and/or mentioned as such. Performance commentary comparisons are made in reference to iShares, unless otherwise noted. Performance quoted represents past performance and does not guarantee future results. Investment return and principal value of an investment will fluctuate, and when sold, may be worth more or less than original cost. Returns for less than one year are not annualized.