September 2017 Investment Commentary & Performance
•
1 like•114 views

Third-Quarter 2017 Market & Portfolio Review

Recommended
More Related Content
What's hot
What's hot (20)
Similar to September 2017 Investment Commentary & Performance
Similar to September 2017 Investment Commentary & Performance (20)
More from Anthony A. Lombardi, CFA
More from Anthony A. Lombardi, CFA (20)
Recently uploaded
Recently uploaded (20)
September 2017 Investment Commentary & Performance
- 1. ¹Comments and opinions expressed reflect solely the personal views of Anthony Lombardi as of 9/30/17, and not any other individual or firm. Such views are not a recommendation to buy or sell any security, fund or portfolio. Any investment decision should be made in consultation with a financial advisor. SEPTEMBER 2017 INVESTMENT COMMENTARY1
- 2. ¹Comments and opinions expressed reflect solely the personal views of Anthony Lombardi as of 9/30/17, and not any other individual or firm. Such views are not a recommendation to buy or sell any security, fund or portfolio. Any investment decision should be made in consultation with a financial advisor. SEPTEMBER 2017 INVESTMENT COMMENTARY1 Resolve, through stormy weather Like we have done for nearly three decades in this business, we listen--to the market, the macro backdrop, sector and company news flow, and the corresponding swings in investor psychology. With our typical investment horizon targeted at ~3-5 years, implicit in this holding period is not simply low turnover (and low cost), but a time-period integral to an investment discipline that is undeterred by short-term events and emotions. Given our large cap value process is contrarian, high conviction, and concentrated, we need not scramble adjusting our long-standing views, or portfolio positioning, due to weekly or quarterly events. As part of implementing our disciplined process, we overlay our longer-term secular view as it pertains to the broader macroeconomic and market backdrop, resulting in active sector and stock exposures. Several of our prior commentaries have detailed reasons as to how we are wired not to succumb to near-term emotions, including the most recent political landscape, and much of what has transpired in its wake during the past year. Simply put, investment backdrops do not formulate overnight. The foundation of our disciplined investment process and philosophy does not allow for it to be radically altered, nor its portfolio’s stock selection and sector allocation be impacted in the same vein. Whether a function of near- or intermediate-term fundamentals, and/or investor psychology, our focus remains on recognizing, assessing and seizing upon valuations that potentially present opportunities, be they BUY or SELL. The pendulum in the third-quarter again reflected market emotions at work. Cumulatively, such swings serve as a building block in our constant assault seeking out opportunities for entry into, and exit from, investment positions. Most importantly, in being contrarian and finding value, we stay true to our process with unrelenting focus on MOS (margin of safety). We have highlighted with each commentary key underlying themes in the backdrop, and at the top of the list each quarter has been the constant, and unfortunate acts of terrorism, with the events in Barcelona perhaps being the most vivid this past summer. Throughout the world, we all have continued to witness numerous such attacks, devastation and personal tragedies as thousands of innocents were either injured, or worse, lives lost. Each time, first responders and the collaborative efforts by all areas of law enforcement are to be commended. However, with each such event, we are also reminded of a world dynamic which has changed, is ever present, and requires continued global attention for such cowardly acts. The world cannot afford to be bifurcated in its stance against this enemy, nor can it ever succumb. While constant acts of terrorism present their specific challenges, a trifecta of natural disasters added further pain this quarter, when terrible destruction and loss of life was caused when three consecutive, massive and powerful hurricanes swept through the Caribbean, two ultimately making landfall in Texas and Florida, while a third devastated the island of Puerto Rico. First responders, and fellow man and woman, have truly been put to the test this quarter in aiding one another, efforts which will be relied upon going forward given recovery and rebuilding process will take considerable time for many. Storm clouds of a different nature hit in various other ways during the quarter. Geopolitical tensions intensified as saber rattling between North Korea and the United States seemed to take to a level reminiscent of the Cuban Missile crisis decades earlier. Re-listening to President Kennedy’s address to the nation 55 years ago (October 22, 1962) is quite the parallel when viewed through the lens of world order at that time. http://www.americanrhetoric.com/speeches/jfkcubanmissilecrisis.html
- 3. ¹Comments and opinions expressed reflect solely the personal views of Anthony Lombardi as of 9/30/17, and not any other individual or firm. Such views are not a recommendation to buy or sell any security, fund or portfolio. Any investment decision should be made in consultation with a financial advisor. SEPTEMBER 2017 INVESTMENT COMMENTARY1 In countries throughout the world, protests from every day citizens desiring to have their voices heard, continued to rise-up, in groups ranging from peaceful to hostile to outright violent. Professional athletes have entered the fray, leaving some fans left questioning whether to jeer or cheer. Companies continued to face the drumbeat of activist investors who desire representation, management change, shifts in capital allocation, separation of corporate assets/lines of business, or all the above. Active investing remains under the microscope, and in the crosshairs of passive/ETF/algorithmic strategies. Major data breaches and cybersecurity intrusions seem to be more routine. The President’s administration personnel and policy agenda at times seems like a carousel at the amusement park. The Russia story nor ongoing independent counsel investigation has yet to find a terminal point. Ms. Clinton has written a memoir, not of her political career, but of the events of the 2016 election. The honeymoon period was over a long time ago, and the first year of marriage between the new administration in DC, the congress and its people is just about over. From the outside, the world looks in turmoil, yet the market continues to hit record highs. Perhaps history will repeat itself, and the world, its citizens, and their leaders will find the passion, determination, and endurance to manage through these latest obstacles—in essence, the same resolve the market seems to have found; after all, it has typically been a leading indicator. Portfolio Positioning & Review For some time. we have believed numerous individual security opportunities existed across several sectors of the large cap US stock market, boding particularly well for a more concentrated, contrarian strategy. Such an optimistic perspective was our long-standing view prior to seeding our LCV portfolio, and despite broader headline valuation multiples of major indices. Our conviction has been anchored in a belief that conditions, while not optimal, were attractive for generating returns over our stated time-horizon, a view that was contrarian to prevailing perceptions at the time. However, as noted in our December and March commentaries, our perspective has increasingly become a centrally-held market view, particularly post-election November 2016. Given our contrarian nature, we have been cognizant of consensus moving in our direction, and have remained quite sensitive to psychological shifts which have occurred. In the prior quarter, with our radar dialed up for changes causing swings in the market pendulum too far in any one direction, we took the opportunity afforded in our investment process, to modestly raise interim cash levels. During the 3rd quarter we were able to deploy some dry powder--retaining an optimistic posture in our portfolio positioning, but always with MOS as our guide. While our LCV portfolio remains fully exposed to all 11 sectors of the market, our focus has been steadfast—a favorable disposition to traditionally cyclical areas possessing compelling valuations, financial statement strength, and where near-term psychology serve to compensate for risk, providing the inherent MOS we seek when investing over a 3 to 5-year time horizon. Other value investors may choose to stray to own safety, but our value conscious, and investment process, simply will not allow us to pay any multiple for quality. While conscious of risk factors, we are investors viewing through a risk/reward prism, in active pursuit of opportunities providing the right balance. We believe in seeking companies that offer a combination of cheapness, a contrarian view, possess stable balance sheets and attractive FCF characteristics, all which provide for a more compelling alternative to simply positioning our portfolio in a traditionally defensive manor (i.e. high allocations to Staples, Healthcare, Utilities, & Telecom). As regular readers of our commentary are fully aware, such areas of the large- cap market have been simply too rich, with many individual equities garnering valuation levels well above the broader market. Most notable in this context has been the lofty valuations in Consumer Staples and Healthcare that existed during course of 2016, and good portion of 2017. Combined, these latter two sectors comprise ~23%
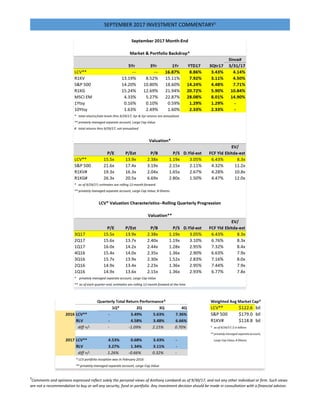
- 4. ¹Comments and opinions expressed reflect solely the personal views of Anthony Lombardi as of 9/30/17, and not any other individual or firm. Such views are not a recommendation to buy or sell any security, fund or portfolio. Any investment decision should be made in consultation with a financial advisor. SEPTEMBER 2017 INVESTMENT COMMENTARY1 of the S&P 500; materially higher than our 14% target allocation at quarter-end. With the broader S&P 500 trading ~17.5x forward 2018 EPS, many traditionally defensive areas of the market command multiples at, or above this level, particularly when viewed on a purely GAAP basis. While we have witnessed some compression during the past year in Healthcare and Staples, most valuations still are not compelling to us. We have readily identified quality, balance sheet strength, and cash flows much cheaper elsewhere. Not only is this more acceptable to our value and contrarian-based investment discipline, but also in recognition that forward long- term returns are typically related to point-of-entry valuation multiples. Our long-term investment views have remained unchanged and we have stayed true to our process discipline and convictions. Compared to 2Q17, our portfolio positioning, sector allocations and stock positions are largely unchanged at the end of 3Q17, except for actions we took to further underscore our convictions in sector target weights, existing holdings, and or to remain true to process constraints. Where we think it prudent to rebalance, we continue to make active decisions, but without change to our conviction in the large cap value opportunity set we see. We are still finding, buying and remaining owners of cheapness, MOS and compelling free cash flow (FCF), while at the same time we are sellers when our valuation criteria are breached. When juxtaposed against our belief that favorable operating leverage opportunities exist in the economy, and amongst the companies we target, we remain steadfast in how we desire to position our LCV portfolio. Key Trades & Attribution We seeded a concentrated LCV strategy during the first quarter 2016. Since inception, as opportunities have been presented, we have made several active decisions, at both the stock and sector level. During 3Q17, notable actions included: 50bp INCREASE Industrial Sector target, to near process maximum. 50bp DECREASE Cash target. Selective rebalance trades in individual holdings within Financials & Consumer Discretionary sectors. This was the second consecutive quarter, where fundamentals did not warrant any full position SALEs or BUYs. As noted in prior commentaries, target sector weightings are influenced by our top-down and bottom-up views. Quarter-end target and market value weights for our LCV portfolio are detailed below.
- 5. ¹Comments and opinions expressed reflect solely the personal views of Anthony Lombardi as of 9/30/17, and not any other individual or firm. Such views are not a recommendation to buy or sell any security, fund or portfolio. Any investment decision should be made in consultation with a financial advisor. SEPTEMBER 2017 INVESTMENT COMMENTARY1 On a market value basis, we ended 3Q17 near the high cash positions during the past year and a half, ~2.2% vs 2.3% 2Q17, but about level with our interim model target of 2.0%, which was reduced 50bps vs 2.5% in 2Q17. We have been methodical in deploying available cash, having purposefully set aside some initial dry powder at inception in February 2016. Recall, from a process perspective, our targeted process cash range is designed to provide flexibility, and allow for repositioning within a highly concentrated, yet diversified portfolio. While we are long-term investors, with low-turnover embedded in our process, we have a stated preference to monetize winners, and/or sell-down positions based on discipline, in so doing avoid placing capital at risk by simply holding investments as place-markers. MOS is paramount for us and is critical in limiting potential downside. Holding a position that has attained valuation levels no longer representative of attractive risk/reward only serves to create undo diversification risk; and is simply unacceptable. With protection of capital a covenant we are unwilling to break, we firmly believe in utilizing process-permitted cash level when situations dictate, to adhere to this core investment principle. Several examples of our cash/MOS discipline have been cited in prior commentaries, including full sales of CSX Corp. (CSX, 1Q17), Time Warner (TWX, 4Q16) and St. Jude Medical (STJ, 2Q16). Similarly, significant rebalancing trades we have executed, since inception, serve in very much the same way. Given it’s not uncommon for our individual position re-balance trades to size in the ~50bps to ~100bps range, such transactions are material, and likely equal to another, less concentrated, lower conviction manager’s full target positions. Such discipline is among several key distinguishing characteristics in our process. We simply have no penchant to manage a portfolio structured with individual positions not representative of our high conviction, and firmly believe in a concentrated list of holdings, yet diversified across market sectors. Being accused of closet indexing, or subject to extinction by ETFs or automated algorithmic-driven strategies remains least among our concerns. Investment Performance. For the September quarter, our LCV portfolio generated total return of 3.43% (a snap back from 0.68% in prior quarter) vs the Russell 1000 Value (R1KV) return of 3.11%, and broader S&P 500 return of 4.48%. For the rolling full year-ended September, our LCV portfolio generated total return of 16.9% vs R1KV return of 15.1% and broader S&P 500 return of 18.6%. Our portfolio’s outperformance of 32bps vs R1KV in the September quarter was primarily driven by stock selection, as we retained continued high conviction in our target holdings by opportunistically taking advantage (ex-post) of pullbacks in select positions during the current and preceding quarters, through active rebalancing to target levels. Our portfolio’s characteristics continue to reflect a disciplined, contrarian, value-oriented process. To this end, despite strong outperformance in 2016-2017 time-frame, our portfolio remains materially cheaper across nearly every valuation metric, notably boasting higher FCF & dividend yields compared to the broader S&P 500 and R1KV, the latter being our primary large cap value benchmark. As illustrated in the tables on page one of this report, staying mindful of general market valuation levels, and our LCV portfolio specifically, remains paramount. To this end, compared to the end of 1Q16, our portfolio has witnessed the most notable valuation creep in Price/Book, Free Cash Flow Yield and forward EV/EBITDA. The portfolio’s FCF Yield is currently at the lowest level (6.43%) during this time frame, although a healthy 215bps above the R1KV. Conversely, forward P/E, Dividend Yield and Price/Sales metrics have remained flat or declined, with all valuation metrics reflecting active portfolio actions during the time-period identified. At current levels, despite some multiple migration becoming a bit more expensive, we remain quite comfortable with our portfolio’s characteristics, particularly when viewed against the broader market, and the R1KV in particular.
- 6. ¹Comments and opinions expressed reflect solely the personal views of Anthony Lombardi as of 9/30/17, and not any other individual or firm. Such views are not a recommendation to buy or sell any security, fund or portfolio. Any investment decision should be made in consultation with a financial advisor. SEPTEMBER 2017 INVESTMENT COMMENTARY1 From a performance attribution standpoint, versus the R1KV, the contribution from Security Selection supplanted the modest drag from Allocation. Specifically, contributions from Security Selection and Allocation during the September quarter amounted to ~+40bps and ~-10bps, respectively. Financials, Consumer Staples and Technology were the most significant contributors in total attribution, while Consumer Discretionary, Energy and Industrials were the most significant detractors. By Allocation, Technology and Healthcare sectors had the largest positive attribution, while Energy was the largest detractor. By Stock Selection, Financials, Staples and Telecom were the largest contributors, while Consumer Discretionary was the single largest drag on performance. On an absolute basis, our portfolio had four sectors experience modest declines quarter/quarter; Consumer Discretionary, Energy, Industrials and Healthcare. Within the R1KV, two sectors with equally modest declines were Consumer Staples and Real Estate. Since inception of our LCV portfolio in February 2016, every sector in the R1KV remains in positive territory on an absolute basis, as does our portfolio. With moves made in prior quarters, relatively few active portfolio decisions occurred during 3Q17. That said, we instituted one increase to a sector target weight, and executed two rebalance trades to individual stock position weightings. As is always the case, these changes were reflective of process, conviction levels and targeted investment opportunities. While our targeted cash position was reduced 50bps to fund a sector increase, overall portfolio liquidity on a market value basis was relatively unchanged versus prior quarter-end levels. For the quarter, our cash position resulted in a drag of ~5bps. Industrial target weighting INCREASED 50bps to near maximum overweight: 14.5% to 15.0% The IND sector has comprised part of our long-standing, favorable cyclical view, and the opportunity set available amongst individual securities with compelling valuations and characteristics. During the quarter, we took the opportunity to raise our target weighting to the maximum allowed by our process, raising the sector weighting 50bps to 15.0%. We funded the IND sector weighting increase with a corresponding 50bps decrease in our targeted cash level, 2.50% to 2.00%. With our conviction in the cyclical backdrop remaining unchanged, and with valuation opportunities presenting themselves, we utilized the pullback in an existing holding to raise both our stock and sector weighting. Given the maximum allowable process weighting in IND against the S&P 500, was ~15.4% at quarter-end, our latest increase placed the portfolio near the upper end of our sector discipline. Compared to the S&P 500 and R1KV, our portfolio’s targeted overweight allocation for IND was ~475bps and ~650bps, respectively, at the end of September. Financials: No sector weight change; 1 rebalance trade to target: 16.0% Within FIN we trimmed one position for rebalance to initial target weight. The reduction comprised slightly more than 60bps of portfolio market value, but the aggregate sector weighting target remained unchanged at 16.0%, ~140bps above the S&P 500 at quarter-end. Compared to the R1KV, our targeted FIN sector weighting represented ~995bps of underweight at quarter-end. We last raised the weighting in the FIN sector during 3Q16, +100bps to its current 16.0% target where it has remained unchanged. Consumer Discretionary: No sector weight change; 1 rebalance trade to target: 16.5% Like prior quarters, we again executed a rebalance trade within CD during the third quarter to bring a position to target level. The corresponding rebalance trade in FIN more than provided the nearly 45bps of portfolio market value required to fund the increase in CD. As previously noted, portfolio attribution in the September
- 7. ¹Comments and opinions expressed reflect solely the personal views of Anthony Lombardi as of 9/30/17, and not any other individual or firm. Such views are not a recommendation to buy or sell any security, fund or portfolio. Any investment decision should be made in consultation with a financial advisor. SEPTEMBER 2017 INVESTMENT COMMENTARY1 quarter was negatively impacted by the drag in CD. Our actions and decision to round-up targeted names within the sector reflects our continued high conviction, anchored in a contrarian view and protected by compelling valuation characteristics and free cash flow. Along with TECH, IND, and FIN, the CD sector comprises a significant part of our portfolio’s cyclical bias. At quarter-end, our sector target allocation remained 16.5%, an active overweighting of ~465bps versus the S&P 500, our process benchmark. Our process compliant maximum weighting for CD was 17.8% at quarter-end leaving additional untapped headroom. Compared to the R1KV, the portfolio ended the quarter with a target overweight of ~975bps. Energy target underweight unchanged, with not much hurt given small representation in S&P 500 Despite Energy posting a near 7% gain, and being the second strongest sector in the S&P 500 during the quarter, the aggregate size of the sector prevents it from being overly punitive to our portfolios performance given our targeted underweight of 4.00% provides representation. As we have stated in prior commentaries, Energy remains our most pronounced exception to our favorable cyclical bias, with our portfolio allocation emphasizing a strategic decision to be prudent and mindful of our concerns. Process is key for us, and we listen and actively implement it, otherwise there is no process. With the quarter-end S&P 500 Energy weighting at ~6.10%, our allowable process maximum to the sector is a ~9.15% allocation. Strategically, for the vast reasons cited in prior commentaries, we desire to remain meaningfully underweight, which at quarter-end was ~210bps and ~685bps below the S&P 500 and R1KV, respectively. With our fundamental concerns unaltered, we believe the sector to be a quintessential “value trap”, and, in our opinion, will take several years to fully play out. We continue to believe there to be a significant difference in business models and financial flexibility across the sector, anticipating many restructurings and cash flow recoveries will likely come up well short. We are quite comfortable at 4% allocation and would not hesitate to cut further should process and opportunities warrant, either within or outside the sector. Our holdings within Energy remain bifurcated, as we desire to barbell our exposure across a challenged sector. Cash target DECREASE of 50bps: 2.0% Our portfolio target cash level was reduced 50bps versus 2Q17, to 2.00%, as we continued making active use of process-permitted cash levels during the quarter through the execution of various actions noted above. From a market value perspective, cash level was down marginally, to 2.2% at quarter-end, versus 2.3% at the end of June. The contrast in market value to target levels was a function of the rebalance in FIN being a greater source of funds than what was deployed in our position rebalance within CD. Market and Economic backdrop As has been the case during this recovery, the broader US equity market in the third quarter was able to absorb a multitude of events, including the political landscape at home, rising geopolitical tensions and events around the world, terrorist attacks, dollar weakness, oil price volatility, improving economic data and actions by the Federal Reserve to continue normalizing monetary policy through a combination of rate and balance sheet actions. Despite a mid-August pullback (on the heels of terrorist attacks, speculation of NEA Gary Cohn resigning his post in the Trump Administration, and potential stall in Fiscal plans), the S&P 500 posted a respectable performance on the heels of a strong showing in the prior three quarters. Bifurcation of performance across styles and regions remained status quo, with the backdrop continuing to very much favor growth and emerging markets. While back-end loaded in the quarter, however, there was a clear rotation from Growth/Emerging
- 8. ¹Comments and opinions expressed reflect solely the personal views of Anthony Lombardi as of 9/30/17, and not any other individual or firm. Such views are not a recommendation to buy or sell any security, fund or portfolio. Any investment decision should be made in consultation with a financial advisor. SEPTEMBER 2017 INVESTMENT COMMENTARY1 Markets to Value. With the valuation characteristics detailed at the forefront of this report, we are not surprised by this latest pendulum action in the market, particularly in lieu of the monetary and fiscal backdrop. For the quarter, the S&P 500 posted a 4.5% total return, with continued variance by sector and industry group. Four of the top five sectors in absolute terms were cyclicals, led by Technology. Growth (as measured by Russell 1000 Growth) posted a 5.9% total return, meaningfully outperforming Value for the third consecutive quarter, with a ~280bps differential. For the month of September, however, Growth underperformed Value by a notable ~165bps. Emerging Markets (MSCI) continued to trounce the pack, posting a 8% total return, representing a YTD return of more than 28%. Much like the September weakness in Growth, EM also underperformed Value, posting a more significant ~330bps negative differential. While U.S. interest rates and spreads have struggled to make a significant and sustained turn higher, we remain of the opinion their extended path lower has largely bottomed given broad expectations for improved growth, higher inflation, and changes in monetary and fiscal policy. Across the globe, performance of stock markets (total returns measured in U.S. Dollars) was bifurcated, but in the black across several geographic theaters: Brazil +23.5% (vs -8.4% in 2Q17), Hong Kong +8.6%, France +7.9%, Germany +7.6%, China +7.1% (vs -2.4% in 2Q17), UK +4.9%, Australia +3.7%, Japan +2.0%, and Mexico +0.9%. For the quarter, the S&P 500 posted +4.0% price increase. Comparatively, the R1KV fell below the broader market, at +2.5%, and, as previously noted, below the R1KG, at +5.5%. Despite quarter-end weakness in the sector, Technology again drove a large part of the differential between Growth and Value. Healthcare and Industrials were the other notable positive contributors for Growth vs Value, while underweights in Energy and Financials, combined with overweight in Consumer Discretionary served as top detractors for Growth. Comparing Growth vs Value, the four most significant sectors in terms of weighting differentials are Technology (+2,930bps), Consumer Discretionary (+1,100bps), Financials (-2,250) and Energy (-1,000bps). Any continuation of performance differential between Growth and Value will likely be driven by these four sectors. Notably, spread compression across the term structure continued in the quarter, driven by a rising short-end and a pull-back in long rates. The former due in part to Fed action while the latter due in part to concerns regarding potential for a stalled Fiscal agenda, soft interim economic data and still modest inflation. As measured by the 10-year US Treasury yield, the benchmark rate’s progression is detailed below: 10 Yr at Period-End 4Q15: 2.27% 2Q16: 1.47% 4Q16: 2.45% 2Q17: 2.31% 3Q17: 2.33% Intra-quarter, the 10-year yield hit a low of 2.04% in early September, prior to spiking to its near complete round- trip finish of 2.33%. Excluding the short dip to 2% in 3Q17, the 10-year has essentially managed to hold the initial spike that occurred during the first few days following last year’s US presidential election, while major US equity indices have powered to all-time highs. Yield curve slope, using 1yr-10yr spread, which had expanded to ~ 165bps at year-end 2016, subsequently declined to ~ 140bps at end of 1Q17, to ~110bps at end of 2Q17, and ~105bps at end of 3Q17. This spread level is well below ~240bps of just 3-years ago. Despite current rate levels and
- 9. ¹Comments and opinions expressed reflect solely the personal views of Anthony Lombardi as of 9/30/17, and not any other individual or firm. Such views are not a recommendation to buy or sell any security, fund or portfolio. Any investment decision should be made in consultation with a financial advisor. SEPTEMBER 2017 INVESTMENT COMMENTARY1 fluctuations in the yield curve, we believe underlying catalysts for select Financials are notable: completion of stress test results and regulatory approval of material capital plans for the banks, more explicit details provided by the Fed regarding balance sheet/interest rate normalization, continued underlying economic improvement, strong credit quality and compelling valuations relative to the broader market. We continue to believe data dependency will remain the foundation for monetary policy, with any changes needing to be justified by the macroeconomic backdrop—the latter which we have been positively disposed for some time, and expect to continue driving interest rate movements and broader policy agenda. We are now 10 years out from the global financial crisis, and clearly on more stable economic ground, with improved conditions for both corporate and consumer fundamentals. As noted in prior commentaries, at this stage of the domestic economic, monetary and fiscal policy cycles, we remain less focused upon unit count of rate increases anticipated by the market and more biased to the level of potential rate changes, and the impact such step-changes could serve to vastly exceed market expectations. Our expectations for more transparency from the Fed regarding policy actions pertaining to active reduction of its $4.5 trillion in assets has been fortified by recent FOMC meetings from which more detail has been provided regarding the same. At times, it has been this part of monetary policy (balance sheet normalization) that has been lost amongst the market’s laser focus, and expectations upon, the unit count of interest rate increases in the forward 12-month calendar. Notably, other central banks have been increasingly signaling the potential for corresponding changes in monetary policy, reflective of improvements abroad, which have already been recognized by the equity markets. We reiterate our own expectations with respect to U.S. monetary policy stated in our December commentary: “…we would not be surprised to see a more fluid pace of change regarding monetary policy should situations warrant. This would include the possibility of at least one 50bp change amongst the current unit count of rate change decisions anticipated, and/or more action steps than currently discounted by the market.” Adding to this mosaic, the Board of Governors at the Fed will be undergoing material change, given Vice Chairman Stanley Fischer’s recently announced departure, three existing board vacancies, and continual speculation regarding Chairman Janet Yellen’s future role. Changes in capital allocations and priorities remain front-burners for us. As we have noted in prior commentaries, we would not be surprised to witness corporate actions that lead to a re-ranking of capital management priorities given potential for more a favorable tax code, deregulation, improving economic activity and executive management confidence, along with a corresponding increase in capital and human resource investments. While such changes could have negative implications for the level and/or pace of share repurchases and dividend increases witnessed during the recovery period since the trough of the financial crisis, they would likely vary by sector. To this end, given underlying performance of the stock market, simple mathematics suggest lower marginal buying power of previously approved, and remaining buyback authorizations. Still further yet, finance 101 suggests higher valuation multiples present as less appetizing to corporate CFO’s and Treasurers, acting as an incremental constraint to share buybacks. We also remain cognizant that saber rattling regarding manufacturing and trade, along with rising geopolitical tensions in North Korea, has the potential to create noteworthy supply chain issues. With exposure to several such factors, we note the Tech sector remains squarely in these cross-hairs, both positive and negative. More recently, we believe a new potential risk and opportunity requires monitoring within the Technology sector,
- 10. ¹Comments and opinions expressed reflect solely the personal views of Anthony Lombardi as of 9/30/17, and not any other individual or firm. Such views are not a recommendation to buy or sell any security, fund or portfolio. Any investment decision should be made in consultation with a financial advisor. SEPTEMBER 2017 INVESTMENT COMMENTARY1 particularly as it relates to larger players in social networking, search, and cyber/data security. Given the combination of terrorism-, security-, data hacking- and content-related concerns that have increasingly captured attention, the political and regulatory environment could lead to the application of “soft handcuffs”, on some companies while providing opportunities for others. While we do not expect the likes of Facebook, Google and others to trade at comparable multiples to Telecom/Utilities any time soon, the valuation gap is quite notable, as is the cash level at many coffers in big cap tech. Meanwhile, the burden for the Financial sector continues to drop. The banks, as evidenced by recent regulatory results, standout as one industry for which the handcuffs are off and the capital return process remains in the early stages. Not to be outdone, at quarter-end, AIG, perhaps the largest and most intertwined poster-child of the financial crisis, had its own shackles removed when its SIFI designation was rescinded by regulators under the premise it no longer poses a threat to financial stability. As is typically the case, earnings and free cash flow generation will serve as key drivers of the ultimate determinant of capital allocation across sectors and industries, all led by the respective fundamental backdrops of each. Volatility had a healthy spike but remains below the long-term average. Subdued for a while, market volatility, as measured by the CBOE Volatility Index (VIX), had a more notable spike during the quarter. The VIX, which had hit a new 2017 low of 9.8 in early June, spiked to ~16.0 in mid-August, although it did not breach the prior quarter’s parallel rise. By quarter-end, the VIX rested at 9.5, a level still near 5-year lows. As we have noted previously, since 1990, a year marked by the precipice of a multiyear financial crisis (and recession) involving S&L’s and commercial banks, the low mark on the VIX has been 9.3, and the average, 19.5. During the past several quarters, exceptions were an immediate, post-UK “Brexit” vote increase in late June, a less prominent increase in September 2016, and the November spike (to 22.5) subsequent to the U.S presidential election. Recent FOMC decisions; intra-meeting commentary regarding rate/balance sheet policy; swirling, divisive and emotional political winds blowing in Washington, geopolitical events & disruptions across the globe, and a late quarter sell-offs in Tech (the market’s anchor tenant) the past 2 quarters, have had less of an impact on VIX than either the Brexit vote or U.S. presidential election. Dollar weakness continued with some quarter-end recovery. Given the confluence of global events, relative strength of the U.S. economic backdrop, and perceived safety of U.S. capital markets, we have been of the view that an overly dire outcome for the Dollar will remain an unlikely scenario in the near-to-intermediate term. For the quarter, however, the Dollar index (DXY) continued to trend lower by another ~5%, reflecting in part the undercurrents in DC and expectations for economic improvement outside the US. By quarter-end, while the DXY had breached a level last realized post-Brexit vote, it remains in the upper quadrant of the 10-year high attained during 4Q16, and well-above financial crisis lows of ~70 reached in 1Q08. Capital investment and potential cross- border M&A, utilizing a strong currency, remain benefits of the Dollar’s strength. Further, to the point where any such investments or acquisitions lead to internationally parked cash, any potential favorable tax changes allowing for repatriation would serve as an incremental benefit from internationally exposed businesses. Any sustained weakness in the dollar would also likely serve as a benefit to multinationals experiencing FX-related revenue drag, to the degree expense pressures due to currency weakness are not an issue. Oils leak, found a plug for now. Following a near 21% YTD decline to its June low, the front-end contract for WTI posted a mirror gain of 21% to close the quarter at $51.67. Despite the recent rally, the commodity remains more than 50% below its 2014 high, underscoring a basic, and painful investment fact: a 50% loss requires a
- 11. ¹Comments and opinions expressed reflect solely the personal views of Anthony Lombardi as of 9/30/17, and not any other individual or firm. Such views are not a recommendation to buy or sell any security, fund or portfolio. Any investment decision should be made in consultation with a financial advisor. SEPTEMBER 2017 INVESTMENT COMMENTARY1 100% recovery to breakeven. Hurricane damage has added a new twist, and an unknown into the equation, in addition to the previously implemented production cuts attempted to be managed by OPEC. With the latest production actions taken, any new formalized OPEC actions might not be fully implemented until 2018. Beyond the risks we have previously highlighted with respect to high inventories, technological benefits and change, potential production cut slippage amongst OPEC, and production triggers being pulled by U.S. producers, a further constraint on materially higher price levels is the potential headwinds to economic growth that could metastasize with any material rise in WTI. Thus, while we simply don’t see what the oil bulls do, we continue to caution they should be mindful of what they wish. As evident in our 200bp reduction in sector allocation during the prior two quarters, and Energy’s modest 6% market cap representation in the S&P 500, we remain in no rush to add portfolio exposure to the sector given compelling opportunities we see elsewhere. Appetite to do deals spanning various sectors and geographies, remains high, reflecting confidence of management and boards to take on risk, and allocate capital. Among notable announcements in 3Q17: United Technologies/Rockwell Collins ($30 bil), Toshiba Memory business selling to consortium of buyers, including Apple ($18 bil cash), Discovery Communications/Scripps Networks ($15 bil), Vantiv/Worldpay ($11 bil), Gilead/Kite Pharma ($10 bil cash) and Northrop Grumman/Orbital ATK ($9 bil cash). From an economic perspective, 2Q17 Real GDP’s most recent revision was +3.1%, with 3Q17 and 4Q17 estimated at +2.6% and +2.4%, respectively. Given likely drag to be created by hurricanes hitting Texas and Florida, current estimates for 3Q & 4Q will likely see some pressure. Forward estimates for 2017, 2018 and 2019 remain largely unchanged, currently +2.2%, 2.3% and +2.1%, respectively. Versus crisis level losses of ~ 900k/month in 2008- 09, the labor market has witnessed continued improvement, generally posting nonfarm payroll gains of ~150k- 300k/month since 2013, with the most recent print of 156k at the low-end. Forward median forecasts for 2017- 2019 remain in the range of 140k-175k/month. In the prior quarter, the unemployment rate hit a 16-year, post- recession low of 4.3%, having declined nearly 600 bps from its peak. Estimates for 2017, 2018 and 2019 currently stand at 4.4% 4.2% and 4.2%, respectively. As noted in our prior commentaries, despite the labor market backdrop, aggregate economic growth had yet to accelerate. However, the recent breach above 3% on real GDP was a notable change and came without fiscal policy injection. FOMC commentary has continually underscored policy maker’s data dependency, with a bias to more than just U.S. economic conditions. During the past year, the Fed has shifted to a much-anticipated, policy rate increase cycle, with additional transparency regarding balance sheet management. This change mimicked the increased hawkishness that had been stirring in FOMC statements, despite longer-term projections of growth and rate levels (the dots) in the Fed forecasts having remained subdued for some time. Given global monetary stimulants that have existed for an extended period, combined with prospects of added Fiscal accelerants, monitoring price and wage inflation metrics remains at the forefront for us. Despite occasional soft spots in economic data, aggregate growth, wage and price pressure have been warming, although the latter may bear the most burden versus history given business models founded upon price competition (AMZN, COST, WMT, TMUS, NFLX, etc). Many are high-volume businesses, built upon thin margins where price points and distribution are primary differentiators. We have repeatedly underscored our belief that there is a good amount of operating leverage in the system, that can be readily monetized for the benefit of shareholders/consumers should top-line revenue (& GDP) growth move sustainably higher. We have also been cognizant of the amount of monetary stimulus that has
- 12. ¹Comments and opinions expressed reflect solely the personal views of Anthony Lombardi as of 9/30/17, and not any other individual or firm. Such views are not a recommendation to buy or sell any security, fund or portfolio. Any investment decision should be made in consultation with a financial advisor. SEPTEMBER 2017 INVESTMENT COMMENTARY1 occurred without a meaningful ramp in GDP. However, in the context the deepness of the economic hole for which we sank, a longer ladder was required. Our comfort level in having positioned with a more cyclical bias remains founded upon valuation multiples and balance sheet/cash flow conditions of the company’s we both seek, and own, as well as the corporate actions and broader economic conditions we continue to witness, and expect—all which well-preceded the election results last year. Should we find it increasingly difficult to discover new compelling opportunities, or valuation characteristics, balance sheet and/or cash flow attributes become more challenging, we will change course per our process discipline. Five and Dime earnings picture remains intact. Heading into 3Q17 earnings season, based on FactSet data, aggregate S&P 500 EPS on a reported basis are estimated at ~ $32.85, representing a year/year increase of ~4%, versus the 10% gain posted in 2Q17. Compared to June 30th, the estimated 3Q17 earnings growth for the S&P 500 has dropped a little more than ~3% pts. Estimates typically come down during a quarter, however, recent quarterly trajectories have been less than average due to a combination of lower cuts by analysts, a reduced level of negative guidance by companies and generally easing comps in the more pressured sectors. Some of the easier comps in certain sectors will now begin to fade, however. Top-line revenue growth forecast of 5.0% for 3Q17 declined modestly vs 5.2% estimated at June 30th, and lower than the 5.3% and 7.7% increase in 2Q17 and 1Q17, respectively. In line with our long-held bullish view, profit margins implied in forecasts are stable in the aggregate, including positive operating leverage in outer quarters. Basic math of the market supports the margin trajectory embedded in forecasts given the underlying mix and weighting of the high-level contributors, notably Technology, at 23.2% of S&P 500 market cap. Despite easy comps, which will begin fading dramatically over the course of the next 18 months, Energy sector’s weighting has been materially compressed, currently representing only 6.1% of S&P 500 market cap. Energy has certainly transitioned from the precipice of negative comparisons, reflected by FY16 earnings and revenue for the sector having declined ~ 76% and ~ 18% y/y, respectively. Currently, the sector is expected to post earnings and revenue gains of ~ +240% and ~ +18% in FY17, and ~ +35% and ~ +6% in FY18, respectively. Healthcare and Financials are nearly equal in market cap representation. Most notable within Financials (14.6% market cap), the banks have been given a green light on capital plans and potentially stand to benefit from rising interest rates, implying that nearly 40% of the S&P market cap appears reasonably anchored. Should earnings growth increase in 3Q17 as expected, it will represent the 5th consecutive quarter of y/y improvement. On a reported earnings basis, 8 of 11 sectors are expected to be in positive territory for the quarter, with Telecom, Utilities and Consumer Discretionary in the red. Energy, Materials and Technology possess the highest expected improvement. Currently, the outlook for 2017 and 2018 is for estimated top-line growth of ~ +5-6% for both, and earnings growth of ~ 10%-11%, what we have affectionately called a “Five & Dime” picture for the market backdrop (5% top and 10% bottom-line growth). By sector, the picture is quite different, with bifurcation in earnings led by Energy and Telecom at the extreme tails of expectations for FY17 and FY18. As these sectors are materially smaller in market capitalization, we reiterate the more relevant story to monitor during the next 12-18 months will be those sectors within the tails. All else constant, we believe the basic math of the market’s forward P/E may not be as rich as generally perceived when viewed in the context of mix: Technology sector’s high profit margins and higher growth, the Financial sector trading at less than 15x forward EPS (with newly approved bank capital plans), potential benefit of cyclical tailwinds materializing within Industrials and Consumer Discretionary, and Energy trading at nearly 30x forward estimates.
- 13. ¹Comments and opinions expressed reflect solely the personal views of Anthony Lombardi as of 9/30/17, and not any other individual or firm. Such views are not a recommendation to buy or sell any security, fund or portfolio. Any investment decision should be made in consultation with a financial advisor. SEPTEMBER 2017 INVESTMENT COMMENTARY1 Bottom line: As contrarians, we remain attracted to many facets in the backdrop noted above, particularly those that underscore the fundamental and emotional swings that are part of any natural market environment. It is the short-to-intermediate term fluctuations which provide the right backdrop for us to position our portfolio for the long-term at both the sector and security level. While we have noted selective areas of the market as expensive (namely traditionally defensive, higher quality sectors and a fundamentally challenged energy complex), many of the cyclical areas within our value-based discipline, remain quite compelling to us. If one simply focuses on the aggregate level of the market, to include broader market earnings growth, valuation metrics, GDP growth, and nominal debt levels the backdrop might be viewed challenging. We prefer to go deeper, into sectors and individual stocks, assess related fundamentals and metrics, place broader macroeconomic measures such as GDP growth into context, and break apart aggregate metrics such as debt into more relevant measures such as net debt, interest costs and coverage ratios, etc. In so doing, we have been quite bullish as to the opportunity set in our concentrated, yet diversified large cap value strategy. That is not to say the opportunity set would be the same for other investors in different or less-concentrated strategies. As long-term investors, we remain focused on executing a consistent process, buying cheapness and not over- paying for quality. As disciplined contrarians, mindful of capital protection, we continue to find the cyclical sectors, ex-energy/commodities, home to stocks with the most compelling valuations relative to the broader market. Given our contrarian nature, we are also cognizant of consensus having moved in our direction during 2016 and 2017, although much of the change was back-end loaded post US elections, and not universal across the macroeconomic, sector or individual stock landscape. Nevertheless, we remain quite sensitive to the shifts that have occurred. With our radar dialed up for changes that cause swings in the pendulum too far in any one direction, we have taken actions during the last few quarters to solidify cheapness in our portfolio, and be protective of capital. This can clearly be seen in the valuation characteristics of our LCV portfolio as compared to the broader market and our key benchmark. Conviction is key for us, and is reflected in our portfolio actions. Most importantly, with any company, it is those possessing characteristics strong in balance sheet and free-cash flow, combined with compelling equity valuation, that garner our attention--these remain the type of roommates we prefer when seeking opportunity and MOS. AAL Document is meant to be used in its entirety. Reference to prior quarterly and monthly publications is noted. Views expressed represent personal assessment of privately managed separate account and market environment as of the date indicated, and should not be considered a recommendation to buy, hold or sell any security, and should not be relied on as research or investment advice. Information is as of the date indicated and subject to change. All market and other related information relied upon and mentioned is from market data sources viewed as reliable. No guarantees are made regarding accuracy. Index returns are for illustrative purposes only. Index performance returns do not reflect any management fees, transaction costs or expenses. Indexes are unmanaged and one cannot invest directly in an index. Past performance does not guarantee future results. The S&P 500 Index measures the performance of 500 mostly large-cap stocks weighted by market value, and is often used to represent performance of the U.S. Stock market. The Russell 1000 Value Index measures the performance of the large-cap value segment of the U.S. equity universe. It includes those Russell 1000 companies with lower price-to-book ratios and lower forecasted growth values. The Russell 1000 Growth Index measures the performance of the large- cap growth segment of the U.S. equity universe. It includes those Russell 1000 companies with higher price-to-book ratios and higher forecasted growth values. Russell Investment Group is the source and owner of the trademarks, service marks, and copyrights related to the Russell Indexes. Russell® is a trademark of the Russell Investment Group.
- 14. ¹Comments and opinions expressed reflect solely the personal views of Anthony Lombardi as of 9/30/17, and not any other individual or firm. Such views are not a recommendation to buy or sell any security, fund or portfolio. Any investment decision should be made in consultation with a financial advisor. SEPTEMBER 2017 INVESTMENT COMMENTARY1 iShares® Funds are distributed by BlackRock Investments, LLC. The iShares Funds are not sponsored, endorsed, issued, sold or promoted by Russell Investment Group. Nor does this company make any representation regarding the advisability of investing in iShares Funds. BlackRock is not affiliated with the company listed above. iShares® and BlackRock® are registered trademarks of BlackRock, Inc., or its subsidiaries. MSCI Emerging Market index is an index created by Morgan Stanley Capital International (MSCI), designed to measure equity market performance in global emerging markets. The Emerging Markets Index is a float-adjusted market capitalization index. MSCI®, and the MSCI index names are registered trademarks of MSCI Inc. or its affiliates. Where noted, S&P 500® Index, Russell 1000® Value Index, Russell 1000® Growth Index, iShares® Russell 1000 Value ETF and MSCI® Emerging Market Index are referenced with abbreviations and respective footnotes. Abbreviations include S&P 500, R1KV, R1KG and MSCI EM. Use of iShares ETF for a respective index is footnoted accordingly and/or mentioned as such. Performance commentary comparisons are made in reference to iShares, unless otherwise noted. Performance quoted represents past performance and does not guarantee future results. Investment return and principal value of an investment will fluctuate, and when sold, may be worth more or less than original cost. Returns for less than one year are not annualized.