SlideShare a Scribd company logo
1 of 4
Download to read offline
averages to eliminate monthly and
seasonal variations.
If you are planning on selling your property,
call me for a free comparative market
analysis.
The median sales price for single-family,
re-sale was down 8.8% in July from June.
It was down 13.2% year-over-year.
The average sales price for single-family,
re-sale homes was down 8.7% month-
over-month. Year-over-year, it was down
12%.
Sales of single-family, re-sale homes fell
14.2% year-over-year. There were 151
homes sold in San Francisco last month.
The average since 2000 is 214.
The median sales price for condos/lofts
was down 4.6% year-over-year.
The average sales price was down 17.1%
year-over-year.
Sales of condos/lofts fell 27.3% year-over-
year. There were 160 condos/lofts sold
last month. The average since 2000 is
230.
The sales price to list price ratio, or what
buyers are paying over what sellers are
asking, rose from 105% to 105.2% for
homes. The ratio for condos/townhomes
fell from 100.2% to 99.4%.
Average days on market, or the time from
when a property is listed to when it goes
into contract, was 25 for homes and 53
for condos/lofts.
Sales momentum…
for homes rose from –43.8 to –42.2.
Sales momentum for condos/lofts was
down 1.4 of a point to –
65.7.
Pricing
momentum…
for single-family homes
fell 0.5 of a point to –
18. Pricing momentum
for condos/lofts fell 0.5
of a point to –9.9.
Our momentum
statistics are based on
12-month moving
Sotheby's International Realty
117 Greenwich Street
San Francisco, CA 94111
Cell: (415) 819-2663
AnnieWilliamsSF@gmail.com
http://www.anniewilliamshomes.com
Annie Williams
ANNIE WILLIAMS | ANNIEWILLIAMSSF@GMAIL.COM | HTTP://WWW.ANNIEWILLIAMSHOMES.COM
Prices and Sales Continue to Drop
Local Market Trends August 2023
San Francisco
Jul 23 Month % Jun 23 Year % Jul 22
Median Price: 1,450,000
$ -8.8% 1,590,000
$ -13.2% 1,670,000
$
Average Price: 1,830,962
$ -8.7% 2,004,984
$ -12.0% 2,081,708
$
Home Sales: 151 -26.0% 204 -14.2% 176
Sale/List Price Ratio: 105.2% 0.2% 105.0% -3.4% 108.9%
Days on Market: 25 0.0% 25 25.0% 20
(Condominiums)
Jul 23 Month % Jun 23 Year % Jul 22
Median Price: 1,145,000
$ 4.1% 1,100,000
$ -4.6% 1,200,000
$
Average Price: 1,222,515
$ -3.0% 1,260,762
$ -17.1% 1,475,078
$
Condo Sales: 160 -18.8% 197 -27.3% 220
Sale/List Price Ratio: 99.4% -0.8% 100.2% -1.3% 100.7%
Days on Market: 53 6.0% 50 10.4% 48
Trends at a Glance
(Single-family Homes)
0
10
20
30
40
50
60
70
80
90
1
0
A J O 1
1
A J O 1
2
A J O 1
3
A J O 1
4
A J O 1
5
A J O 1
6
A J O 1
7
A J O 1
8
A J O 1
9
A J O 2
0
A J O 2
1
A J O 2
2
A J O 2
3
A J
San Francisco Homes: Days on Market
© 2023 rereport.com
Aug 4, 2023 -- Mortgage and other interest rates
powered higher again this week, but the proximate
cause wasn't a spike of inflation, more tightness in
the labor market or a sudden surge in economic ac-
tivity. Rather, the increases were caused by concerns
about good old supply and demand, with those com-
pounded to a degree by a considered opinion about
America's ability to manage its debt.
With significant budget deficits to cover, the Treasury
announced its quarterly refunding needs this week,
and the expected borrowing for the July-September
quarter was pegged at one trillion dollars, up by $274
billion from the previous quarter. Supplies of new
bonds were already running at very high levels, and
even if there is enthusiastic demand for the increase
in supply, it is likely too much for investors to want to
readily absorb. More bond supply into uncertain de-
mand is a recipe for higher yields, and higher yields
we got.
Just a day after the Treasury announcement, Fitch
Ratings downgraded the U.S. credit rating from AAA
to AA+, noting that America's fiscal house is rather a
mess. In an interview with CNN, Richard Francis, the
lead analyst on US sovereign ratings for Fitch Rat-
ings, said "We do feel like governance has deteriorat-
ed steadily over the last 20 years" and "Because of
that, we have less confidence that the government
can tackle [these] fiscal challenges." While the down-
grade doesn't significantly alter the outlook for U.S.
borrowing, it may have added a bit of firmness to
yields this week. As far as mortgage-rate effects, the
ratings service also downgraded the debt issued by
Fannie Mae and Freddie Mac to AA+; while these
issuances to raise funds to buy mortgages from lend-
ers are essentially now fully guaranteed by the U.S.,
it could have an effect on the GSE's borrowing costs,
and that would translate into somewhat firmer mort-
gage rates than would otherwise be the case absent
the downgrade.
That rates were firming up this week is rather unfortu-
nate, as the overall tenor for the fresh economic data
out this week was just the kind of evidence that the
Fed is hoping to see as it looks to contain inflation. In
a different week, we might have seen interest rates
retreating a bit from recent levels, but all they are
likely to do at the moment is retrace some (or per-
haps all) of the latest rise.
(Continued on page 4)
ANNIE WILLIAMS
SOTHEBY'S INTERNATIONAL REALTY
ANNIEWILLIAMSSF@GMAIL.COM
2 Local Market Trends | San Francisco |
Favorable Evidence Accumulating
The chart above shows the National monthly
average for 30-year fixed rate mortgages as
compiled by http://www.freddiemac.com/.
August 2023
1.0% 3.0% 5.0% 7.0% 9.0%
01-10
07-10
01-11
07-11
01-12
07-12
01-13
07-13
01-14
07-14
01-15
07-15
01-16
07-16
01-17
07-17
01-18
07-18
01-19
07-19
01-20
07-20
01-21
07-21
01-22
07-22
01-23
30-Year Fixed Mortgage Rates
0
50
100
150
200
250
300
350
$300
$800
$1,300
$1,800
$2,300
$2,800
1
0
A J O 1
1
A J O 1
2
A J O 1
3
A J O 1
4
A J O 1
5
A J O 1
6
A J O 1
7
A J O 1
8
A J O 1
9
A J O 2
0
A J O 2
1
A J O 2
2
A J O 2
3
A J
San Francisco Homes: Sold Prices & Unit Sales
(3-month moving average — $000's)
Ave Med Units © 2023 rereport.com
Unit
Median Average Sales DOM SP/LP Median Average Sales Median Average Sales
San Francisco $1,450,000 $1,830,962 151 25 105.2% -13.2% -12.0% -14.2% -8.8% -8.7% -26.0%
D1: Northwest $2,000,000 $1,950,727 11 42 103.3% -17.0% -15.2% -15.4% -14.2% -22.6% -47.6%
D2: Central West $1,491,500 $1,538,268 34 24 111.4% -3.8% -10.4% -17.1% -2.2% 0.8% 0.0%
D3: Southwest $1,265,000 $1,315,833 12 25 113.2% -13.4% -13.2% -20.0% 0.4% -9.7% 9.1%
D4: Twin Peaks $1,925,000 $2,113,340 20 28 103.4% -0.8% -9.5% -16.7% 13.2% 17.1% -20.0%
D5: Central $2,682,500 $2,575,167 18 25 103.6% 1.3% -6.6% -30.8% 48.8% 17.6% -14.3%
D6: Central North $0 $0 0 0 0.0% n/a n/a n/a n/a n/a n/a
D7: North $5,250,000 $6,575,000 4 87 92.0% -25.3% -14.3% -20.0% 9.4% 19.0% -71.4%
D8: Northeast $3,439,500 $3,439,500 2 63 96.3% 70.7% 70.7% 0.0% -7.0% -7.0% 100.0%
D9: Central East $1,475,000 $1,654,750 14 14 105.1% -19.0% -17.3% 7.7% -17.3% -14.7% -50.0%
D10: Southeast $1,152,500 $1,165,580 36 22 110.9% -4.0% -6.4% 2.9% 2.4% 3.2% -12.2%
July Sales Statistics
(Single-family Homes)
Prices Yearly Change Monthly Change
Table Definitions
_______________
Median Price
The price at which 50% of prices
were higher and 50% were lower.
Average Price
Add all prices and divide by the
number of sales.
SP/LP
Sales price to list price ratio or the
price paid for the property divided
by the asking price.
DOI
Days of Inventory, or how many
days it would take to sell all the
property for sale at the current rate
of sales.
Pend
Property under contract to sell that
hasn’t closed escrow.
Inven
Number pf properties actively for
sale as of the last day of the month.
Local Market Trends | San Francisco | 3
August 2023
ANNIE WILLIAMS
SOTHEBY'S INTERNATIONAL REALTY
ANNIEWILLIAMSSF@GMAIL.COM
80.0%
85.0%
90.0%
95.0%
100.0%
105.0%
110.0%
115.0%
120.0%
125.0%
1
0
A J O 1
1
A J O 1
2
A J O 1
3
A J O 1
4
A J O 1
5
A J O 1
6
A J O 1
7
A J O 1
8
A J O 1
9
A J O 2
0
A J O 2
1
A J O 2
2
A J O 2
3
A J
San Francisco Homes: Sales Price to List Price Ratio
© 2023 rereport.com
-50.0
-40.0
-30.0
-20.0
-10.0
0.0
10.0
20.0
30.0
40.0
0
6
A J O 0
7
A J O 0
8
A J O 0
9
A J O 1
0
A J O 1
1
A J O 1
2
A J O 1
3
A J O 1
4
A J O 1
5
A J O 1
6
A J O 1
7
A J O 1
8
A J O 1
9
A J O 2
0
A J O 2
1
A J O 2
2
A J O 2
3
A J
San Francisco Homes: Sales Momentum
Sales Pricing © 2023 rereport.com
0
100
200
300
400
500
$300
$500
$700
$900
$1,100
$1,300
$1,500
$1,700
1
0
A J O 1
1
A J O 1
2
A J O 1
3
A J O 1
4
A J O 1
5
A J O 1
6
A J O 1
7
A J O 1
8
A J O 1
9
A J O 2
0
A J O 2
1
A J O 2
2
A J O 2
3
A J
San Francisco Condos: Sold Prices & Unit Sales
(3-month moving average — $000's)
Ave Med Units © 2023 rereport.com
Unit
Median Average Sales DOM SP/LP Median Average Sales Median Average Sales
San Francisco $1,145,000 $1,222,515 160 53 99.4% -4.6% -17.1% -27.3% 4.1% -3.0% -18.8%
D1: Northwest $1,400,000 $1,432,222 9 49 101.3% -7.3% -9.0% -30.8% 21.7% -0.2% -18.2%
D2: Central West $0 $0 0 0 0.0% n/a n/a n/a n/a n/a n/a
D3: Southwest $610,750 $610,750 2 27 100.5% -18.7% -18.7% 0.0% -58.6% -58.6% 100.0%
D4: Twin Peaks $702,000 $702,000 2 57 98.5% 15.1% -22.1% -33.3% -28.4% -16.4% -33.3%
D5: Central $1,247,500 $1,256,500 28 32 102.2% -11.2% -12.0% -12.5% 1.8% -4.9% -20.0%
D6: Central North $950,000 $980,706 17 64 100.8% -28.3% -24.8% -19.0% -5.0% -10.3% -32.0%
D7: North $1,580,000 $1,751,500 18 59 98.4% 9.0% 6.7% -28.0% -1.3% -6.1% 28.6%
D8: Northeast $1,197,500 $1,316,644 36 63 97.7% 11.4% -39.3% -10.0% 29.3% 14.2% -2.7%
D9: Central East $905,000 $1,038,865 46 52 98.6% -22.3% -15.4% -37.0% -19.0% -16.3% -20.7%
D10: Southeast $759,500 $759,500 2 32 99.5% -1.2% 4.2% -77.8% -15.5% -14.7% -66.7%
July Sales Statistics
(Condos/TICs/Co-ops/Lofts)
Prices Yearly Change Monthly Change
San Francisco
This Real Estate Report is published and copyrighted by http://rereport.com.
Information contained herein is deemed accurate and correct, but no warranty is implied or given.
Annie Williams
Sotheby's International Realty
117 Greenwich Street
San Francisco, CA 94111
Go online to see the full report with the district by district breakdown: https://rereport.com/sf/aw/
Spending on construction projects rose by 0.5% in
June, a sixth consecutive monthly increase. Out-
lays for residential construction contributed to the
increase, rising 0.9%, a second consecutive gain
after 10 months of declines.
With mortgage rates elevated, it's not likely we'll
see much by way of routinely increasing demand
for home loans anytime soon. Another 3% decline
in overall requests for mortgage credit was seen in
the week ending July 28, according to the
Mortgage Bankers Association. The over-
all figure was pulled downward by a 3.2%
drop in applications for purchase-money
mortgages (third weekly decline in a row)
and a 2.5% drop in requests for funds to
refinance existing mortgages, a second
consecutive easing.
Which brings us into the rate outlook for
next week. The recent upward pressure
on mortgage rates was only partly ex-
pressed in Freddie Mac's data this week,
as their previous-Thursday-to-this-
Wednesday survey week missed the
worst of the bond-market selloff. Some of
that uptick yet remains, but most of it may
wash out of the market by the time next
Thursday rolls around and new survey
(Continued from page 2) data becomes available. With the CPI and PPI
coming out Friday, those reports won't play a role in
next week's mortgage rates, at least as far as Fred-
die's survey is concerned.
Given all that, there's a good chance that there's
only a slight residual bump in mortgage rates at
most for next week, and if the bond-market rally of
Friday can carry, a chance of stable or even slightly
lower rates, as well. We'll hedge those possible
outcomes, and expect an increase of perhaps a
basis point or three in the average offered rate for a
conforming 30-year fixed-rate mortgage as reported
by Freddie Mac next Thursday at noon.
2009 2010 2011 2012 2013 2014 2015 2016 2017 2018 2019 2020 2021 2022 2023
Condos 943 1,426 1,549 1,817 1,905 1,852 1,719 1,564 1,659 1,817 1,703 1,219 2,586 1,995 1,264
Homes 1,074 1,368 1,389 1,474 1,626 1,323 1,501 1,430 1,250 1,264 1,252 961 1,629 1,432 1,038
0
500
1,000
1,500
2,000
2,500
3,000
3,500
4,000
4,500
Property Sales
(Year-to-Date)
© 2021 rereport.com

More Related Content

Similar to Annie Williams Real Estate Report - August 2023

Annie Williams Real Estate Report - July 2020
Annie Williams Real Estate Report - July 2020Annie Williams Real Estate Report - July 2020
Annie Williams Real Estate Report - July 2020Jon Weaver
 
Annie Williams Real Estate Report - September 2020
Annie Williams Real Estate Report - September 2020Annie Williams Real Estate Report - September 2020
Annie Williams Real Estate Report - September 2020Jon Weaver
 
Annie Williams Real Estate Report, Nov 2022
Annie Williams Real Estate Report, Nov 2022Annie Williams Real Estate Report, Nov 2022
Annie Williams Real Estate Report, Nov 2022Annie Williams
 
Annie Williams Real Estate Report - Feb 2023
Annie Williams Real Estate Report - Feb 2023Annie Williams Real Estate Report - Feb 2023
Annie Williams Real Estate Report - Feb 2023Annie Williams
 
Annie Williams Real Estate Report - February 2020
Annie Williams Real Estate Report - February 2020Annie Williams Real Estate Report - February 2020
Annie Williams Real Estate Report - February 2020Jon Weaver
 
Annie Williams Real Estate Report - February 2022
Annie Williams Real Estate Report - February 2022Annie Williams Real Estate Report - February 2022
Annie Williams Real Estate Report - February 2022Annie Williams
 
Annie Williams Real Estate Report - June 2020
Annie Williams Real Estate Report - June 2020Annie Williams Real Estate Report - June 2020
Annie Williams Real Estate Report - June 2020Jon Weaver
 
Annie Williams Real Estate Report-September 2023-9.pdf
Annie Williams Real Estate Report-September 2023-9.pdfAnnie Williams Real Estate Report-September 2023-9.pdf
Annie Williams Real Estate Report-September 2023-9.pdfAnnie Williams
 
Annie Williams Real Estate Report - April 2023
Annie Williams Real Estate Report - April 2023Annie Williams Real Estate Report - April 2023
Annie Williams Real Estate Report - April 2023Annie Williams
 
Annie Williams Real Estate Report - December 2021
Annie Williams Real Estate Report - December 2021Annie Williams Real Estate Report - December 2021
Annie Williams Real Estate Report - December 2021Annie Williams
 
Annie Williams Real Estate Report - November 2019
Annie Williams Real Estate Report - November 2019Annie Williams Real Estate Report - November 2019
Annie Williams Real Estate Report - November 2019Jon Weaver
 
Annie Williams Real Estate Report - October 2021
Annie Williams Real Estate Report - October 2021Annie Williams Real Estate Report - October 2021
Annie Williams Real Estate Report - October 2021Annie Williams
 
Annie Williams Real Estate Report - February 2021
Annie Williams Real Estate Report - February 2021Annie Williams Real Estate Report - February 2021
Annie Williams Real Estate Report - February 2021Annie Williams
 
Annie Williams Real Estate Report - May 2020
Annie Williams Real Estate Report - May 2020Annie Williams Real Estate Report - May 2020
Annie Williams Real Estate Report - May 2020Jon Weaver
 
Annie Williams Real Estate Report - October 2019
Annie Williams Real Estate Report - October 2019Annie Williams Real Estate Report - October 2019
Annie Williams Real Estate Report - October 2019Jon Weaver
 
Annie Williams Market Report April-May 2016
Annie Williams Market Report April-May 2016Annie Williams Market Report April-May 2016
Annie Williams Market Report April-May 2016Jon Weaver
 
Annie Williams Real Estate Report - January 2021
Annie Williams Real Estate Report - January 2021Annie Williams Real Estate Report - January 2021
Annie Williams Real Estate Report - January 2021Jon Weaver
 
Annie Williams Real Estate Report - November 2021
Annie Williams Real Estate Report - November 2021Annie Williams Real Estate Report - November 2021
Annie Williams Real Estate Report - November 2021Annie Williams
 
Annie Williams Real Estate Report - March 2020
Annie Williams Real Estate Report - March 2020Annie Williams Real Estate Report - March 2020
Annie Williams Real Estate Report - March 2020Jon Weaver
 
Annie Williams Real Estate Report Sept-Oct 2016
Annie Williams Real Estate Report Sept-Oct 2016Annie Williams Real Estate Report Sept-Oct 2016
Annie Williams Real Estate Report Sept-Oct 2016Annie Williams
 

Similar to Annie Williams Real Estate Report - August 2023 (20)

Annie Williams Real Estate Report - July 2020
Annie Williams Real Estate Report - July 2020Annie Williams Real Estate Report - July 2020
Annie Williams Real Estate Report - July 2020
 
Annie Williams Real Estate Report - September 2020
Annie Williams Real Estate Report - September 2020Annie Williams Real Estate Report - September 2020
Annie Williams Real Estate Report - September 2020
 
Annie Williams Real Estate Report, Nov 2022
Annie Williams Real Estate Report, Nov 2022Annie Williams Real Estate Report, Nov 2022
Annie Williams Real Estate Report, Nov 2022
 
Annie Williams Real Estate Report - Feb 2023
Annie Williams Real Estate Report - Feb 2023Annie Williams Real Estate Report - Feb 2023
Annie Williams Real Estate Report - Feb 2023
 
Annie Williams Real Estate Report - February 2020
Annie Williams Real Estate Report - February 2020Annie Williams Real Estate Report - February 2020
Annie Williams Real Estate Report - February 2020
 
Annie Williams Real Estate Report - February 2022
Annie Williams Real Estate Report - February 2022Annie Williams Real Estate Report - February 2022
Annie Williams Real Estate Report - February 2022
 
Annie Williams Real Estate Report - June 2020
Annie Williams Real Estate Report - June 2020Annie Williams Real Estate Report - June 2020
Annie Williams Real Estate Report - June 2020
 
Annie Williams Real Estate Report-September 2023-9.pdf
Annie Williams Real Estate Report-September 2023-9.pdfAnnie Williams Real Estate Report-September 2023-9.pdf
Annie Williams Real Estate Report-September 2023-9.pdf
 
Annie Williams Real Estate Report - April 2023
Annie Williams Real Estate Report - April 2023Annie Williams Real Estate Report - April 2023
Annie Williams Real Estate Report - April 2023
 
Annie Williams Real Estate Report - December 2021
Annie Williams Real Estate Report - December 2021Annie Williams Real Estate Report - December 2021
Annie Williams Real Estate Report - December 2021
 
Annie Williams Real Estate Report - November 2019
Annie Williams Real Estate Report - November 2019Annie Williams Real Estate Report - November 2019
Annie Williams Real Estate Report - November 2019
 
Annie Williams Real Estate Report - October 2021
Annie Williams Real Estate Report - October 2021Annie Williams Real Estate Report - October 2021
Annie Williams Real Estate Report - October 2021
 
Annie Williams Real Estate Report - February 2021
Annie Williams Real Estate Report - February 2021Annie Williams Real Estate Report - February 2021
Annie Williams Real Estate Report - February 2021
 
Annie Williams Real Estate Report - May 2020
Annie Williams Real Estate Report - May 2020Annie Williams Real Estate Report - May 2020
Annie Williams Real Estate Report - May 2020
 
Annie Williams Real Estate Report - October 2019
Annie Williams Real Estate Report - October 2019Annie Williams Real Estate Report - October 2019
Annie Williams Real Estate Report - October 2019
 
Annie Williams Market Report April-May 2016
Annie Williams Market Report April-May 2016Annie Williams Market Report April-May 2016
Annie Williams Market Report April-May 2016
 
Annie Williams Real Estate Report - January 2021
Annie Williams Real Estate Report - January 2021Annie Williams Real Estate Report - January 2021
Annie Williams Real Estate Report - January 2021
 
Annie Williams Real Estate Report - November 2021
Annie Williams Real Estate Report - November 2021Annie Williams Real Estate Report - November 2021
Annie Williams Real Estate Report - November 2021
 
Annie Williams Real Estate Report - March 2020
Annie Williams Real Estate Report - March 2020Annie Williams Real Estate Report - March 2020
Annie Williams Real Estate Report - March 2020
 
Annie Williams Real Estate Report Sept-Oct 2016
Annie Williams Real Estate Report Sept-Oct 2016Annie Williams Real Estate Report Sept-Oct 2016
Annie Williams Real Estate Report Sept-Oct 2016
 

More from Annie Williams

Annie Williams Real Estate Report - March 2022
Annie Williams Real Estate Report - March 2022Annie Williams Real Estate Report - March 2022
Annie Williams Real Estate Report - March 2022Annie Williams
 
Annie Williams Real Estate Report - September 2021
Annie Williams Real Estate Report - September 2021Annie Williams Real Estate Report - September 2021
Annie Williams Real Estate Report - September 2021Annie Williams
 
Annie Williams Real Estate Report - March 2021
Annie Williams Real Estate Report - March 2021Annie Williams Real Estate Report - March 2021
Annie Williams Real Estate Report - March 2021Annie Williams
 
Annie Williams - San Francisco Demographics - Household Expenditures
Annie Williams - San Francisco Demographics - Household ExpendituresAnnie Williams - San Francisco Demographics - Household Expenditures
Annie Williams - San Francisco Demographics - Household ExpendituresAnnie Williams
 
Annie Williams - San Francisco Demographics - Commuting
Annie Williams - San Francisco Demographics - CommutingAnnie Williams - San Francisco Demographics - Commuting
Annie Williams - San Francisco Demographics - CommutingAnnie Williams
 
Annie Williams - San Francisco Demographics - Employment
Annie Williams - San Francisco Demographics - EmploymentAnnie Williams - San Francisco Demographics - Employment
Annie Williams - San Francisco Demographics - EmploymentAnnie Williams
 
Annie Williams - San Francisco Demographics - Median Income by Education & Sex
Annie Williams - San Francisco Demographics - Median Income by Education & SexAnnie Williams - San Francisco Demographics - Median Income by Education & Sex
Annie Williams - San Francisco Demographics - Median Income by Education & SexAnnie Williams
 
Annie Williams - San Francisco Demographics - Education
Annie Williams - San Francisco Demographics - EducationAnnie Williams - San Francisco Demographics - Education
Annie Williams - San Francisco Demographics - EducationAnnie Williams
 
Annie Williams Real Estate Report - March 2018
Annie Williams Real Estate Report - March 2018Annie Williams Real Estate Report - March 2018
Annie Williams Real Estate Report - March 2018Annie Williams
 
Annie Williams - San Francisco Demographics - Beliefs & Practices
Annie Williams - San Francisco Demographics - Beliefs & PracticesAnnie Williams - San Francisco Demographics - Beliefs & Practices
Annie Williams - San Francisco Demographics - Beliefs & PracticesAnnie Williams
 
Annie Williams - San Francisco Demographics - Religion or Lack Thereof
Annie Williams - San Francisco Demographics - Religion or Lack ThereofAnnie Williams - San Francisco Demographics - Religion or Lack Thereof
Annie Williams - San Francisco Demographics - Religion or Lack ThereofAnnie Williams
 
Annie Williams Real Estate Report July-Aug 2017
Annie Williams Real Estate Report July-Aug 2017Annie Williams Real Estate Report July-Aug 2017
Annie Williams Real Estate Report July-Aug 2017Annie Williams
 
Annie W: Interest Rate History since 1995
Annie W: Interest Rate History since 1995Annie W: Interest Rate History since 1995
Annie W: Interest Rate History since 1995Annie Williams
 
Annie Williams 2016 Annual Real Estate Report
Annie Williams 2016 Annual Real Estate ReportAnnie Williams 2016 Annual Real Estate Report
Annie Williams 2016 Annual Real Estate ReportAnnie Williams
 
Annie Williams Real Estate Report Nov-Dec 2016
Annie Williams Real Estate Report Nov-Dec 2016Annie Williams Real Estate Report Nov-Dec 2016
Annie Williams Real Estate Report Nov-Dec 2016Annie Williams
 

More from Annie Williams (15)

Annie Williams Real Estate Report - March 2022
Annie Williams Real Estate Report - March 2022Annie Williams Real Estate Report - March 2022
Annie Williams Real Estate Report - March 2022
 
Annie Williams Real Estate Report - September 2021
Annie Williams Real Estate Report - September 2021Annie Williams Real Estate Report - September 2021
Annie Williams Real Estate Report - September 2021
 
Annie Williams Real Estate Report - March 2021
Annie Williams Real Estate Report - March 2021Annie Williams Real Estate Report - March 2021
Annie Williams Real Estate Report - March 2021
 
Annie Williams - San Francisco Demographics - Household Expenditures
Annie Williams - San Francisco Demographics - Household ExpendituresAnnie Williams - San Francisco Demographics - Household Expenditures
Annie Williams - San Francisco Demographics - Household Expenditures
 
Annie Williams - San Francisco Demographics - Commuting
Annie Williams - San Francisco Demographics - CommutingAnnie Williams - San Francisco Demographics - Commuting
Annie Williams - San Francisco Demographics - Commuting
 
Annie Williams - San Francisco Demographics - Employment
Annie Williams - San Francisco Demographics - EmploymentAnnie Williams - San Francisco Demographics - Employment
Annie Williams - San Francisco Demographics - Employment
 
Annie Williams - San Francisco Demographics - Median Income by Education & Sex
Annie Williams - San Francisco Demographics - Median Income by Education & SexAnnie Williams - San Francisco Demographics - Median Income by Education & Sex
Annie Williams - San Francisco Demographics - Median Income by Education & Sex
 
Annie Williams - San Francisco Demographics - Education
Annie Williams - San Francisco Demographics - EducationAnnie Williams - San Francisco Demographics - Education
Annie Williams - San Francisco Demographics - Education
 
Annie Williams Real Estate Report - March 2018
Annie Williams Real Estate Report - March 2018Annie Williams Real Estate Report - March 2018
Annie Williams Real Estate Report - March 2018
 
Annie Williams - San Francisco Demographics - Beliefs & Practices
Annie Williams - San Francisco Demographics - Beliefs & PracticesAnnie Williams - San Francisco Demographics - Beliefs & Practices
Annie Williams - San Francisco Demographics - Beliefs & Practices
 
Annie Williams - San Francisco Demographics - Religion or Lack Thereof
Annie Williams - San Francisco Demographics - Religion or Lack ThereofAnnie Williams - San Francisco Demographics - Religion or Lack Thereof
Annie Williams - San Francisco Demographics - Religion or Lack Thereof
 
Annie Williams Real Estate Report July-Aug 2017
Annie Williams Real Estate Report July-Aug 2017Annie Williams Real Estate Report July-Aug 2017
Annie Williams Real Estate Report July-Aug 2017
 
Annie W: Interest Rate History since 1995
Annie W: Interest Rate History since 1995Annie W: Interest Rate History since 1995
Annie W: Interest Rate History since 1995
 
Annie Williams 2016 Annual Real Estate Report
Annie Williams 2016 Annual Real Estate ReportAnnie Williams 2016 Annual Real Estate Report
Annie Williams 2016 Annual Real Estate Report
 
Annie Williams Real Estate Report Nov-Dec 2016
Annie Williams Real Estate Report Nov-Dec 2016Annie Williams Real Estate Report Nov-Dec 2016
Annie Williams Real Estate Report Nov-Dec 2016
 

Recently uploaded

Low Rate Call Girls in Trilokpuri Delhi Call 9990771857
Low Rate Call Girls in Trilokpuri Delhi Call 9990771857Low Rate Call Girls in Trilokpuri Delhi Call 9990771857
Low Rate Call Girls in Trilokpuri Delhi Call 9990771857delhimodel235
 
Eco-Efficient Living: Redefining Sustainability through Leech's Green Design ...
Eco-Efficient Living: Redefining Sustainability through Leech's Green Design ...Eco-Efficient Living: Redefining Sustainability through Leech's Green Design ...
Eco-Efficient Living: Redefining Sustainability through Leech's Green Design ...Newman George Leech
 
Call Girls in Model Town Delhi 💯Call Us 🔝8264348440🔝
Call Girls in Model Town Delhi 💯Call Us 🔝8264348440🔝Call Girls in Model Town Delhi 💯Call Us 🔝8264348440🔝
Call Girls in Model Town Delhi 💯Call Us 🔝8264348440🔝soniya singh
 
Call Girls In Vasant Vihar Delhi 💯Call Us 🔝8264348440🔝
Call Girls In Vasant Vihar Delhi 💯Call Us 🔝8264348440🔝Call Girls In Vasant Vihar Delhi 💯Call Us 🔝8264348440🔝
Call Girls In Vasant Vihar Delhi 💯Call Us 🔝8264348440🔝soniya singh
 
call girls in ganesh nagar Delhi 8264348440 ✅ call girls ❤️
call girls in ganesh nagar Delhi 8264348440 ✅ call girls ❤️call girls in ganesh nagar Delhi 8264348440 ✅ call girls ❤️
call girls in ganesh nagar Delhi 8264348440 ✅ call girls ❤️soniya singh
 
Call girls in Jeewan Park .Delhi↫8447779280↬ ꧂Escorts Service In Delhi Ncr
Call girls in Jeewan Park .Delhi↫8447779280↬ ꧂Escorts Service In Delhi NcrCall girls in Jeewan Park .Delhi↫8447779280↬ ꧂Escorts Service In Delhi Ncr
Call girls in Jeewan Park .Delhi↫8447779280↬ ꧂Escorts Service In Delhi Ncrasmaqueen5
 
FULL ENJOY 🔝 8264348440 🔝 Call Girls in DLF phase 3 | Gurgaon
FULL ENJOY 🔝 8264348440 🔝 Call Girls in DLF phase 3 | GurgaonFULL ENJOY 🔝 8264348440 🔝 Call Girls in DLF phase 3 | Gurgaon
FULL ENJOY 🔝 8264348440 🔝 Call Girls in DLF phase 3 | Gurgaonsoniya singh
 
Magarpatta Nova Elegance Mundhwa Pune E-Brochure.pdf
Magarpatta Nova Elegance Mundhwa Pune  E-Brochure.pdfMagarpatta Nova Elegance Mundhwa Pune  E-Brochure.pdf
Magarpatta Nova Elegance Mundhwa Pune E-Brochure.pdfManishSaxena95
 
Raquel Thompson: Combining Creativity with Practicality in Architecture
Raquel Thompson: Combining  Creativity with Practicality in ArchitectureRaquel Thompson: Combining  Creativity with Practicality in Architecture
Raquel Thompson: Combining Creativity with Practicality in ArchitectureRaquel Thompson Barbados
 
9990771857 Call Girls in Noida Sector 34 Noida (Call Girls) Delhi
9990771857 Call Girls in Noida Sector 34 Noida (Call Girls) Delhi9990771857 Call Girls in Noida Sector 34 Noida (Call Girls) Delhi
9990771857 Call Girls in Noida Sector 34 Noida (Call Girls) Delhidelhimodel235
 
Low Rate Call Girls in Triveni Complex Delhi Call 9990771857
Low Rate Call Girls in Triveni Complex Delhi Call 9990771857Low Rate Call Girls in Triveni Complex Delhi Call 9990771857
Low Rate Call Girls in Triveni Complex Delhi Call 9990771857delhimodel235
 
call girls in Shahdara (DELHI) 🔝 >༒9953330565🔝 genuine Escort Service 🔝✔️✔️
call girls in Shahdara (DELHI) 🔝 >༒9953330565🔝 genuine Escort Service 🔝✔️✔️call girls in Shahdara (DELHI) 🔝 >༒9953330565🔝 genuine Escort Service 🔝✔️✔️
call girls in Shahdara (DELHI) 🔝 >༒9953330565🔝 genuine Escort Service 🔝✔️✔️9953056974 Low Rate Call Girls In Saket, Delhi NCR
 
Low Rate Call Girls in Tughlakabad Delhi Call 9990771857
Low Rate Call Girls in Tughlakabad Delhi Call 9990771857Low Rate Call Girls in Tughlakabad Delhi Call 9990771857
Low Rate Call Girls in Tughlakabad Delhi Call 9990771857delhimodel235
 
Rustomjee Cleon Bandra East, Mumbai - Brochure.pdf
Rustomjee Cleon Bandra East, Mumbai - Brochure.pdfRustomjee Cleon Bandra East, Mumbai - Brochure.pdf
Rustomjee Cleon Bandra East, Mumbai - Brochure.pdfmonikasharma630
 
The Omaxe State Dwarka Delhi-broucher.pdf.pdf
The Omaxe State Dwarka Delhi-broucher.pdf.pdfThe Omaxe State Dwarka Delhi-broucher.pdf.pdf
The Omaxe State Dwarka Delhi-broucher.pdf.pdfkratirudram
 
Call Girls in Inderpuri Delhi 💯Call Us 🔝8264348440🔝
Call Girls in Inderpuri Delhi 💯Call Us 🔝8264348440🔝Call Girls in Inderpuri Delhi 💯Call Us 🔝8264348440🔝
Call Girls in Inderpuri Delhi 💯Call Us 🔝8264348440🔝soniya singh
 
Call Girls in Noida Sector 11 Noida 💯Call Us 🔝 9582086666 🔝 South Delhi Escor...
Call Girls in Noida Sector 11 Noida 💯Call Us 🔝 9582086666 🔝 South Delhi Escor...Call Girls in Noida Sector 11 Noida 💯Call Us 🔝 9582086666 🔝 South Delhi Escor...
Call Girls in Noida Sector 11 Noida 💯Call Us 🔝 9582086666 🔝 South Delhi Escor...delhimodel235
 
Call Girls in Kashmiri Gate Delhi 💯Call Us 🔝8264348440🔝
Call Girls in Kashmiri Gate Delhi 💯Call Us 🔝8264348440🔝Call Girls in Kashmiri Gate Delhi 💯Call Us 🔝8264348440🔝
Call Girls in Kashmiri Gate Delhi 💯Call Us 🔝8264348440🔝soniya singh
 
Listing Turkey Sylvana Istanbul - Bahcesehir
Listing Turkey Sylvana Istanbul - BahcesehirListing Turkey Sylvana Istanbul - Bahcesehir
Listing Turkey Sylvana Istanbul - BahcesehirListing Turkey
 

Recently uploaded (20)

Low Rate Call Girls in Trilokpuri Delhi Call 9990771857
Low Rate Call Girls in Trilokpuri Delhi Call 9990771857Low Rate Call Girls in Trilokpuri Delhi Call 9990771857
Low Rate Call Girls in Trilokpuri Delhi Call 9990771857
 
Eco-Efficient Living: Redefining Sustainability through Leech's Green Design ...
Eco-Efficient Living: Redefining Sustainability through Leech's Green Design ...Eco-Efficient Living: Redefining Sustainability through Leech's Green Design ...
Eco-Efficient Living: Redefining Sustainability through Leech's Green Design ...
 
Call Girls in Model Town Delhi 💯Call Us 🔝8264348440🔝
Call Girls in Model Town Delhi 💯Call Us 🔝8264348440🔝Call Girls in Model Town Delhi 💯Call Us 🔝8264348440🔝
Call Girls in Model Town Delhi 💯Call Us 🔝8264348440🔝
 
VIP Escorts in Delhi:🔝9953056974🔝 Hot Qutub Minar Delhi Escorts Service
VIP Escorts in Delhi:🔝9953056974🔝 Hot Qutub Minar Delhi Escorts ServiceVIP Escorts in Delhi:🔝9953056974🔝 Hot Qutub Minar Delhi Escorts Service
VIP Escorts in Delhi:🔝9953056974🔝 Hot Qutub Minar Delhi Escorts Service
 
Call Girls In Vasant Vihar Delhi 💯Call Us 🔝8264348440🔝
Call Girls In Vasant Vihar Delhi 💯Call Us 🔝8264348440🔝Call Girls In Vasant Vihar Delhi 💯Call Us 🔝8264348440🔝
Call Girls In Vasant Vihar Delhi 💯Call Us 🔝8264348440🔝
 
call girls in ganesh nagar Delhi 8264348440 ✅ call girls ❤️
call girls in ganesh nagar Delhi 8264348440 ✅ call girls ❤️call girls in ganesh nagar Delhi 8264348440 ✅ call girls ❤️
call girls in ganesh nagar Delhi 8264348440 ✅ call girls ❤️
 
Call girls in Jeewan Park .Delhi↫8447779280↬ ꧂Escorts Service In Delhi Ncr
Call girls in Jeewan Park .Delhi↫8447779280↬ ꧂Escorts Service In Delhi NcrCall girls in Jeewan Park .Delhi↫8447779280↬ ꧂Escorts Service In Delhi Ncr
Call girls in Jeewan Park .Delhi↫8447779280↬ ꧂Escorts Service In Delhi Ncr
 
FULL ENJOY 🔝 8264348440 🔝 Call Girls in DLF phase 3 | Gurgaon
FULL ENJOY 🔝 8264348440 🔝 Call Girls in DLF phase 3 | GurgaonFULL ENJOY 🔝 8264348440 🔝 Call Girls in DLF phase 3 | Gurgaon
FULL ENJOY 🔝 8264348440 🔝 Call Girls in DLF phase 3 | Gurgaon
 
Magarpatta Nova Elegance Mundhwa Pune E-Brochure.pdf
Magarpatta Nova Elegance Mundhwa Pune  E-Brochure.pdfMagarpatta Nova Elegance Mundhwa Pune  E-Brochure.pdf
Magarpatta Nova Elegance Mundhwa Pune E-Brochure.pdf
 
Raquel Thompson: Combining Creativity with Practicality in Architecture
Raquel Thompson: Combining  Creativity with Practicality in ArchitectureRaquel Thompson: Combining  Creativity with Practicality in Architecture
Raquel Thompson: Combining Creativity with Practicality in Architecture
 
9990771857 Call Girls in Noida Sector 34 Noida (Call Girls) Delhi
9990771857 Call Girls in Noida Sector 34 Noida (Call Girls) Delhi9990771857 Call Girls in Noida Sector 34 Noida (Call Girls) Delhi
9990771857 Call Girls in Noida Sector 34 Noida (Call Girls) Delhi
 
Low Rate Call Girls in Triveni Complex Delhi Call 9990771857
Low Rate Call Girls in Triveni Complex Delhi Call 9990771857Low Rate Call Girls in Triveni Complex Delhi Call 9990771857
Low Rate Call Girls in Triveni Complex Delhi Call 9990771857
 
call girls in Shahdara (DELHI) 🔝 >༒9953330565🔝 genuine Escort Service 🔝✔️✔️
call girls in Shahdara (DELHI) 🔝 >༒9953330565🔝 genuine Escort Service 🔝✔️✔️call girls in Shahdara (DELHI) 🔝 >༒9953330565🔝 genuine Escort Service 🔝✔️✔️
call girls in Shahdara (DELHI) 🔝 >༒9953330565🔝 genuine Escort Service 🔝✔️✔️
 
Low Rate Call Girls in Tughlakabad Delhi Call 9990771857
Low Rate Call Girls in Tughlakabad Delhi Call 9990771857Low Rate Call Girls in Tughlakabad Delhi Call 9990771857
Low Rate Call Girls in Tughlakabad Delhi Call 9990771857
 
Rustomjee Cleon Bandra East, Mumbai - Brochure.pdf
Rustomjee Cleon Bandra East, Mumbai - Brochure.pdfRustomjee Cleon Bandra East, Mumbai - Brochure.pdf
Rustomjee Cleon Bandra East, Mumbai - Brochure.pdf
 
The Omaxe State Dwarka Delhi-broucher.pdf.pdf
The Omaxe State Dwarka Delhi-broucher.pdf.pdfThe Omaxe State Dwarka Delhi-broucher.pdf.pdf
The Omaxe State Dwarka Delhi-broucher.pdf.pdf
 
Call Girls in Inderpuri Delhi 💯Call Us 🔝8264348440🔝
Call Girls in Inderpuri Delhi 💯Call Us 🔝8264348440🔝Call Girls in Inderpuri Delhi 💯Call Us 🔝8264348440🔝
Call Girls in Inderpuri Delhi 💯Call Us 🔝8264348440🔝
 
Call Girls in Noida Sector 11 Noida 💯Call Us 🔝 9582086666 🔝 South Delhi Escor...
Call Girls in Noida Sector 11 Noida 💯Call Us 🔝 9582086666 🔝 South Delhi Escor...Call Girls in Noida Sector 11 Noida 💯Call Us 🔝 9582086666 🔝 South Delhi Escor...
Call Girls in Noida Sector 11 Noida 💯Call Us 🔝 9582086666 🔝 South Delhi Escor...
 
Call Girls in Kashmiri Gate Delhi 💯Call Us 🔝8264348440🔝
Call Girls in Kashmiri Gate Delhi 💯Call Us 🔝8264348440🔝Call Girls in Kashmiri Gate Delhi 💯Call Us 🔝8264348440🔝
Call Girls in Kashmiri Gate Delhi 💯Call Us 🔝8264348440🔝
 
Listing Turkey Sylvana Istanbul - Bahcesehir
Listing Turkey Sylvana Istanbul - BahcesehirListing Turkey Sylvana Istanbul - Bahcesehir
Listing Turkey Sylvana Istanbul - Bahcesehir
 

Annie Williams Real Estate Report - August 2023

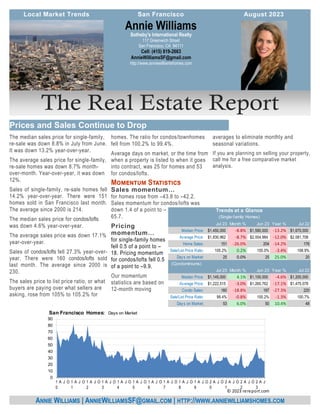
  • 1. averages to eliminate monthly and seasonal variations. If you are planning on selling your property, call me for a free comparative market analysis. The median sales price for single-family, re-sale was down 8.8% in July from June. It was down 13.2% year-over-year. The average sales price for single-family, re-sale homes was down 8.7% month- over-month. Year-over-year, it was down 12%. Sales of single-family, re-sale homes fell 14.2% year-over-year. There were 151 homes sold in San Francisco last month. The average since 2000 is 214. The median sales price for condos/lofts was down 4.6% year-over-year. The average sales price was down 17.1% year-over-year. Sales of condos/lofts fell 27.3% year-over- year. There were 160 condos/lofts sold last month. The average since 2000 is 230. The sales price to list price ratio, or what buyers are paying over what sellers are asking, rose from 105% to 105.2% for homes. The ratio for condos/townhomes fell from 100.2% to 99.4%. Average days on market, or the time from when a property is listed to when it goes into contract, was 25 for homes and 53 for condos/lofts. Sales momentum… for homes rose from –43.8 to –42.2. Sales momentum for condos/lofts was down 1.4 of a point to – 65.7. Pricing momentum… for single-family homes fell 0.5 of a point to – 18. Pricing momentum for condos/lofts fell 0.5 of a point to –9.9. Our momentum statistics are based on 12-month moving Sotheby's International Realty 117 Greenwich Street San Francisco, CA 94111 Cell: (415) 819-2663 AnnieWilliamsSF@gmail.com http://www.anniewilliamshomes.com Annie Williams ANNIE WILLIAMS | ANNIEWILLIAMSSF@GMAIL.COM | HTTP://WWW.ANNIEWILLIAMSHOMES.COM Prices and Sales Continue to Drop Local Market Trends August 2023 San Francisco Jul 23 Month % Jun 23 Year % Jul 22 Median Price: 1,450,000 $ -8.8% 1,590,000 $ -13.2% 1,670,000 $ Average Price: 1,830,962 $ -8.7% 2,004,984 $ -12.0% 2,081,708 $ Home Sales: 151 -26.0% 204 -14.2% 176 Sale/List Price Ratio: 105.2% 0.2% 105.0% -3.4% 108.9% Days on Market: 25 0.0% 25 25.0% 20 (Condominiums) Jul 23 Month % Jun 23 Year % Jul 22 Median Price: 1,145,000 $ 4.1% 1,100,000 $ -4.6% 1,200,000 $ Average Price: 1,222,515 $ -3.0% 1,260,762 $ -17.1% 1,475,078 $ Condo Sales: 160 -18.8% 197 -27.3% 220 Sale/List Price Ratio: 99.4% -0.8% 100.2% -1.3% 100.7% Days on Market: 53 6.0% 50 10.4% 48 Trends at a Glance (Single-family Homes) 0 10 20 30 40 50 60 70 80 90 1 0 A J O 1 1 A J O 1 2 A J O 1 3 A J O 1 4 A J O 1 5 A J O 1 6 A J O 1 7 A J O 1 8 A J O 1 9 A J O 2 0 A J O 2 1 A J O 2 2 A J O 2 3 A J San Francisco Homes: Days on Market © 2023 rereport.com
  • 2. Aug 4, 2023 -- Mortgage and other interest rates powered higher again this week, but the proximate cause wasn't a spike of inflation, more tightness in the labor market or a sudden surge in economic ac- tivity. Rather, the increases were caused by concerns about good old supply and demand, with those com- pounded to a degree by a considered opinion about America's ability to manage its debt. With significant budget deficits to cover, the Treasury announced its quarterly refunding needs this week, and the expected borrowing for the July-September quarter was pegged at one trillion dollars, up by $274 billion from the previous quarter. Supplies of new bonds were already running at very high levels, and even if there is enthusiastic demand for the increase in supply, it is likely too much for investors to want to readily absorb. More bond supply into uncertain de- mand is a recipe for higher yields, and higher yields we got. Just a day after the Treasury announcement, Fitch Ratings downgraded the U.S. credit rating from AAA to AA+, noting that America's fiscal house is rather a mess. In an interview with CNN, Richard Francis, the lead analyst on US sovereign ratings for Fitch Rat- ings, said "We do feel like governance has deteriorat- ed steadily over the last 20 years" and "Because of that, we have less confidence that the government can tackle [these] fiscal challenges." While the down- grade doesn't significantly alter the outlook for U.S. borrowing, it may have added a bit of firmness to yields this week. As far as mortgage-rate effects, the ratings service also downgraded the debt issued by Fannie Mae and Freddie Mac to AA+; while these issuances to raise funds to buy mortgages from lend- ers are essentially now fully guaranteed by the U.S., it could have an effect on the GSE's borrowing costs, and that would translate into somewhat firmer mort- gage rates than would otherwise be the case absent the downgrade. That rates were firming up this week is rather unfortu- nate, as the overall tenor for the fresh economic data out this week was just the kind of evidence that the Fed is hoping to see as it looks to contain inflation. In a different week, we might have seen interest rates retreating a bit from recent levels, but all they are likely to do at the moment is retrace some (or per- haps all) of the latest rise. (Continued on page 4) ANNIE WILLIAMS SOTHEBY'S INTERNATIONAL REALTY ANNIEWILLIAMSSF@GMAIL.COM 2 Local Market Trends | San Francisco | Favorable Evidence Accumulating The chart above shows the National monthly average for 30-year fixed rate mortgages as compiled by http://www.freddiemac.com/. August 2023 1.0% 3.0% 5.0% 7.0% 9.0% 01-10 07-10 01-11 07-11 01-12 07-12 01-13 07-13 01-14 07-14 01-15 07-15 01-16 07-16 01-17 07-17 01-18 07-18 01-19 07-19 01-20 07-20 01-21 07-21 01-22 07-22 01-23 30-Year Fixed Mortgage Rates 0 50 100 150 200 250 300 350 $300 $800 $1,300 $1,800 $2,300 $2,800 1 0 A J O 1 1 A J O 1 2 A J O 1 3 A J O 1 4 A J O 1 5 A J O 1 6 A J O 1 7 A J O 1 8 A J O 1 9 A J O 2 0 A J O 2 1 A J O 2 2 A J O 2 3 A J San Francisco Homes: Sold Prices & Unit Sales (3-month moving average — $000's) Ave Med Units © 2023 rereport.com Unit Median Average Sales DOM SP/LP Median Average Sales Median Average Sales San Francisco $1,450,000 $1,830,962 151 25 105.2% -13.2% -12.0% -14.2% -8.8% -8.7% -26.0% D1: Northwest $2,000,000 $1,950,727 11 42 103.3% -17.0% -15.2% -15.4% -14.2% -22.6% -47.6% D2: Central West $1,491,500 $1,538,268 34 24 111.4% -3.8% -10.4% -17.1% -2.2% 0.8% 0.0% D3: Southwest $1,265,000 $1,315,833 12 25 113.2% -13.4% -13.2% -20.0% 0.4% -9.7% 9.1% D4: Twin Peaks $1,925,000 $2,113,340 20 28 103.4% -0.8% -9.5% -16.7% 13.2% 17.1% -20.0% D5: Central $2,682,500 $2,575,167 18 25 103.6% 1.3% -6.6% -30.8% 48.8% 17.6% -14.3% D6: Central North $0 $0 0 0 0.0% n/a n/a n/a n/a n/a n/a D7: North $5,250,000 $6,575,000 4 87 92.0% -25.3% -14.3% -20.0% 9.4% 19.0% -71.4% D8: Northeast $3,439,500 $3,439,500 2 63 96.3% 70.7% 70.7% 0.0% -7.0% -7.0% 100.0% D9: Central East $1,475,000 $1,654,750 14 14 105.1% -19.0% -17.3% 7.7% -17.3% -14.7% -50.0% D10: Southeast $1,152,500 $1,165,580 36 22 110.9% -4.0% -6.4% 2.9% 2.4% 3.2% -12.2% July Sales Statistics (Single-family Homes) Prices Yearly Change Monthly Change
  • 3. Table Definitions _______________ Median Price The price at which 50% of prices were higher and 50% were lower. Average Price Add all prices and divide by the number of sales. SP/LP Sales price to list price ratio or the price paid for the property divided by the asking price. DOI Days of Inventory, or how many days it would take to sell all the property for sale at the current rate of sales. Pend Property under contract to sell that hasn’t closed escrow. Inven Number pf properties actively for sale as of the last day of the month. Local Market Trends | San Francisco | 3 August 2023 ANNIE WILLIAMS SOTHEBY'S INTERNATIONAL REALTY ANNIEWILLIAMSSF@GMAIL.COM 80.0% 85.0% 90.0% 95.0% 100.0% 105.0% 110.0% 115.0% 120.0% 125.0% 1 0 A J O 1 1 A J O 1 2 A J O 1 3 A J O 1 4 A J O 1 5 A J O 1 6 A J O 1 7 A J O 1 8 A J O 1 9 A J O 2 0 A J O 2 1 A J O 2 2 A J O 2 3 A J San Francisco Homes: Sales Price to List Price Ratio © 2023 rereport.com -50.0 -40.0 -30.0 -20.0 -10.0 0.0 10.0 20.0 30.0 40.0 0 6 A J O 0 7 A J O 0 8 A J O 0 9 A J O 1 0 A J O 1 1 A J O 1 2 A J O 1 3 A J O 1 4 A J O 1 5 A J O 1 6 A J O 1 7 A J O 1 8 A J O 1 9 A J O 2 0 A J O 2 1 A J O 2 2 A J O 2 3 A J San Francisco Homes: Sales Momentum Sales Pricing © 2023 rereport.com 0 100 200 300 400 500 $300 $500 $700 $900 $1,100 $1,300 $1,500 $1,700 1 0 A J O 1 1 A J O 1 2 A J O 1 3 A J O 1 4 A J O 1 5 A J O 1 6 A J O 1 7 A J O 1 8 A J O 1 9 A J O 2 0 A J O 2 1 A J O 2 2 A J O 2 3 A J San Francisco Condos: Sold Prices & Unit Sales (3-month moving average — $000's) Ave Med Units © 2023 rereport.com Unit Median Average Sales DOM SP/LP Median Average Sales Median Average Sales San Francisco $1,145,000 $1,222,515 160 53 99.4% -4.6% -17.1% -27.3% 4.1% -3.0% -18.8% D1: Northwest $1,400,000 $1,432,222 9 49 101.3% -7.3% -9.0% -30.8% 21.7% -0.2% -18.2% D2: Central West $0 $0 0 0 0.0% n/a n/a n/a n/a n/a n/a D3: Southwest $610,750 $610,750 2 27 100.5% -18.7% -18.7% 0.0% -58.6% -58.6% 100.0% D4: Twin Peaks $702,000 $702,000 2 57 98.5% 15.1% -22.1% -33.3% -28.4% -16.4% -33.3% D5: Central $1,247,500 $1,256,500 28 32 102.2% -11.2% -12.0% -12.5% 1.8% -4.9% -20.0% D6: Central North $950,000 $980,706 17 64 100.8% -28.3% -24.8% -19.0% -5.0% -10.3% -32.0% D7: North $1,580,000 $1,751,500 18 59 98.4% 9.0% 6.7% -28.0% -1.3% -6.1% 28.6% D8: Northeast $1,197,500 $1,316,644 36 63 97.7% 11.4% -39.3% -10.0% 29.3% 14.2% -2.7% D9: Central East $905,000 $1,038,865 46 52 98.6% -22.3% -15.4% -37.0% -19.0% -16.3% -20.7% D10: Southeast $759,500 $759,500 2 32 99.5% -1.2% 4.2% -77.8% -15.5% -14.7% -66.7% July Sales Statistics (Condos/TICs/Co-ops/Lofts) Prices Yearly Change Monthly Change
  • 4. San Francisco This Real Estate Report is published and copyrighted by http://rereport.com. Information contained herein is deemed accurate and correct, but no warranty is implied or given. Annie Williams Sotheby's International Realty 117 Greenwich Street San Francisco, CA 94111 Go online to see the full report with the district by district breakdown: https://rereport.com/sf/aw/ Spending on construction projects rose by 0.5% in June, a sixth consecutive monthly increase. Out- lays for residential construction contributed to the increase, rising 0.9%, a second consecutive gain after 10 months of declines. With mortgage rates elevated, it's not likely we'll see much by way of routinely increasing demand for home loans anytime soon. Another 3% decline in overall requests for mortgage credit was seen in the week ending July 28, according to the Mortgage Bankers Association. The over- all figure was pulled downward by a 3.2% drop in applications for purchase-money mortgages (third weekly decline in a row) and a 2.5% drop in requests for funds to refinance existing mortgages, a second consecutive easing. Which brings us into the rate outlook for next week. The recent upward pressure on mortgage rates was only partly ex- pressed in Freddie Mac's data this week, as their previous-Thursday-to-this- Wednesday survey week missed the worst of the bond-market selloff. Some of that uptick yet remains, but most of it may wash out of the market by the time next Thursday rolls around and new survey (Continued from page 2) data becomes available. With the CPI and PPI coming out Friday, those reports won't play a role in next week's mortgage rates, at least as far as Fred- die's survey is concerned. Given all that, there's a good chance that there's only a slight residual bump in mortgage rates at most for next week, and if the bond-market rally of Friday can carry, a chance of stable or even slightly lower rates, as well. We'll hedge those possible outcomes, and expect an increase of perhaps a basis point or three in the average offered rate for a conforming 30-year fixed-rate mortgage as reported by Freddie Mac next Thursday at noon. 2009 2010 2011 2012 2013 2014 2015 2016 2017 2018 2019 2020 2021 2022 2023 Condos 943 1,426 1,549 1,817 1,905 1,852 1,719 1,564 1,659 1,817 1,703 1,219 2,586 1,995 1,264 Homes 1,074 1,368 1,389 1,474 1,626 1,323 1,501 1,430 1,250 1,264 1,252 961 1,629 1,432 1,038 0 500 1,000 1,500 2,000 2,500 3,000 3,500 4,000 4,500 Property Sales (Year-to-Date) © 2021 rereport.com